5386
Workflow for spatial alignment of MR data and histopathological images of tumors for region-of-interest-based correlation analysis1Department of Medical Radiation Sciences, Institute of Clinical Sciences, Sahlgrenska Academy, University of Gothenburg, Gothenburg, Sweden, 2Department of Medical Physics and Biomedical Engineering, Sahlgrenska University Hospital, Gothenburg, Sweden
Synopsis
Keywords: Quantitative Imaging, Validation, histopathology
Validation of MRI-derived tumor biomarkers require ground truth validation against histopathology, but pixel-by-pixel spatial alignment with histopathological images pose unresolved challenges. A reasonable approach is to correlate regions-of-interest from MRI with corresponding regions from histopathology. However, clinical protocols for histopathological processing of tissue sections require modifications to preserve spatial information relative to MR images. In this educational exhibit we describe a workflow, based on literature and experience, that enables region-of-interest-based spatial correlation analysis between MRI and histopathological data.
Motivation
MRI shows great potential for non-invasive tumor tissue characterization and early response assessment, but increased knowledge of the link between tumor biology and MRI biomarkers is required. One advantage with MRI is that it reveals local variations within tumors in vivo, which may reflect, e.g., necrosis of fibrosis, but this also requires that the biological analysis for validation of MRI biomarkers, typically histopathology, is spatially correlated with the MR images1.Several methods have been suggested to spatially correlate MRI data with histopathology, with ambitious aims to account for problems caused by, e.g., histopathological tissue deformation. However, this often requires advanced image registration methods/software, hundreds of serially acquired and digitally “stitched” histopathological images (3D histopathology) or long high-resolution ex vivo MRI as an intermediate step to bridge the gap between in vivo MRI and histopathology (e.g. 2,3).
This tutorial describes a way to achieve a spatial match that often suffice for region-of-interest-based histopathological analysis of local variations on MRI, without requiring advanced image registration or 3D histopathology. The workflow is based on a combination of methods proposed in the literature and our experience within the field, and includes recommendations and pitfalls. We briefly described the method in 4.
Workflow
Step 1 – MRI acquisition
MRI acquisition immediately before tumor resection facilitates correlation analysis since marking (step 2) can be performed with the tumor in the imaging position, and since gross morphological changes in rapidly evolving tumors are avoided. Acquire image data so that the imaged plane can be located on the animal outside the magnet. For a subcutaneous tumor, the most obvious image location might be the greatest transversal tumor cross-section (Fig. 1), which would be the most protruding part of the tumor visible outside the magnet. For orthotopic tumors an anatomical landmark may be required. To reduce the risk that the tumor orientation changes before it has been marked, the animal should be sacrificed and tumor marked in the MRI animal holder (e.g. pull out the holder and switch/increase the anesthetic gas to a lethal dose, without moving the animal). Make sure procedures comply with ethical permits.Step 2 – Tissue marking
Carefully cut skin/other tissues to clear the tumor enough to mark the left, dorsal and right rim of the imaged tumor plane (Fig 2). Using a sharp object dipped in colored ink (tissue marking dye), carefully breach the tumor capsule/outer boarder (dab the tumor with a cotton swab to remove superficial blood before the marking to avoid ink dispersion on the capsule). A syringe can be used for marking, but the amount of ink is difficult to control (ink needs to be pushed out from the syringe which may result in too much ink in the tumor). A thin sharp wooden object, such as a toothpick, may be better if it is sharp enough to penetrate the tumor capsule. The wood fibers absorb surplus ink (avoids dispersion, Fig. 2). Insert red/yellow/green ink to the left/dorsal/right rim of the imaged plane for unambiguous recovery of its orientation on histopathology if it, e.g., lands upside down on the histology glass slip.Step 3 – Histopathological processing
Gently divide the tumor parallel but a few mm from the marked plane (Fig. 2) using a sharp scalpel, and remove the marked half and put it in formaldehyde for storage until histopathological processing (formaldehyde will not dissolve ink that has entered the tumor capsule/boarder). When it is time to embed it in the paraffin block for sectioning, it is important to make sure that the cut surface faces the bottom of the mold as it is filled with heated, floating paraffin, and to hold it there until the paraffin solidifies. This surface first meets the microtome knife, and the histopathological slices will thus be parallel to the imaged plane. Let the microtome work its way through the tumor until the ink is clearly visible on the paraffin block (Fig. 3a) before you collect your slices for further processing. These slices should now represent the tumor plane that was imaged in step 1.The almost transparent 3-5 µm thick slices are released from the microtome knife to a bath of water where you collect them on the glass slips on which they will be fixated and stained. It is advisable, as an extra measure to keep track of orientation, to compare the visible outer rim of the tumor on the glass slips to the tumor in the paraffin block, or that you look at the glass slip in a conventional light microscope, and mark the color orientation on e.g. a post-it note and take a picture of it (Fig. 3b). This can be very helpful if not all three colors are visible on the final stained histopathological slides.
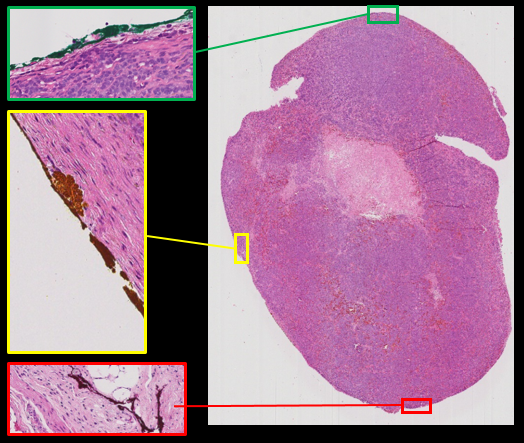
At our department, we use a whole slide imager (Leica Biosystems, Germany) to digitize the stained tumor sections, where the color marks can be identified and the histopathological images thus spatially matched with the MRIs (Fig. 4). We use, e.g., Matlab (Mathworks, USA) and ImageJ/FIJI freeware to extract ROI data from MRI and histopathology, respectively, but there are plenty of other freeware available for such analysis.
Acknowledgements
Swedish Cancer Society, Swedish Research Council, the King Gustav V Jubilee Clinic Cancer Research Foundation, BioCARE – a National Strategic Research Program at the University of Gothenburg, the Sahlgrenska University Hospital Research Funds, the Assar Gabrielsson Cancer Research Foundation, the Adlerbertska Research Foundation, the Herbert & Karin Jacobsson Foundation, Lion's Cancer Research Fund of Western Sweden, the Royal Society of Arts and Sciences in Gothenburg (KVVS), and the Wilhelm and Martina Lundgren Research FoundationReferences
1. Alyami W, Kyme A, Bourne R. Histological Validation of MRI: A Review of Challenges in Registration of Imaging and Whole-Mount Histopathology. J. Magn. Reson. Imaging 2020 doi: 10.1002/JMRI.27409.
2. Zimmerman BE, Johnson SL, Odéen HA, et al. Histology to 3D in vivo MR registration for volumetric evaluation of MRgFUS treatment assessment biomarkers. Sci. Reports 2021 111 2021;11(1):1–12.
3. McGrath DM, Lee J, Foltz WD, et al. Technical Note: Method to correlate whole-specimen histopathology of radical prostatectomy with diagnostic MR imaging. Med. Phys. 2016;43(3):1065–1072.
4. Montelius M, Jalnefjord O, Spetz J, et al. Multiparametric MR for non-invasive evaluation of tumour tissue histological characteristics after radionuclide therapy. NMR Biomed. 2019;32(3).
Figures
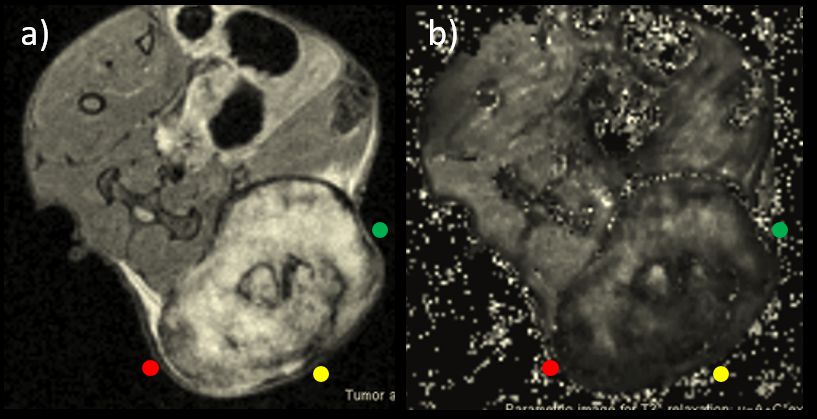
Figure 1a. Transversal MRI (T2 RARE) of the greatest cross-section of a subcutaneous tumor (bright mass in lower right) in a mouse, where colors indicate where tissue ink should be applied (c.f. step 2 and Fig 2). 1b. The parametric image(s) (here T2* map) that will be histologically correlated is acquired with identical slice positioning as in 1a, and reveal intra-tumor variations that may be of interest to locate on histological sections using the proposed method in this tutorial
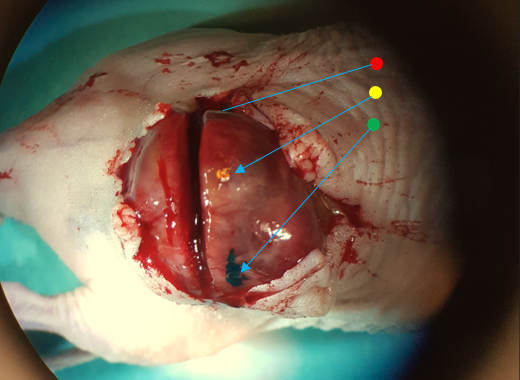
Figure 2. Tumor cleared from skin with animal still in MRI holder. Green/yellow ink is visible on the right/dorsal parts of the rim of the greatest cross-section of the tumor, i.e. where the image to be analyzed was acquired (red/left not visible). For illustration, the green ink was applied using a syringe tip and is dispersed on the tumor capsule, and the yellow using a broken toothpick, which has absorbed surplus ink from the tip. The dividing incision is visible parallel, but slightly offset from the marked plane
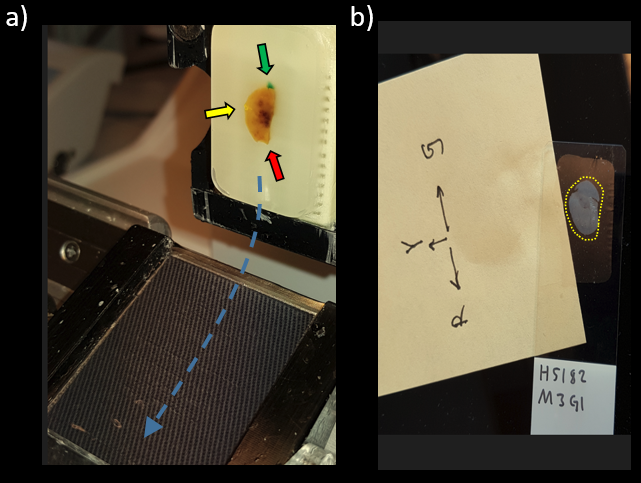
Figure 3a. Tumor embedded in the paraffin block and attached to the microtome with cut surface facing outwards (towards the knife sweep plane). Tissue ink is visible in the embedded block, but the thin sections that fall off the knife and slide into the water bath via the water slide (blue dashed arrow) where they unfold before they are picked up on the glass slips are transparent. 3b. Once picked up, they should be compared to the block and marked and photographed as redundant orientation information