5383
Proton MRI-based oximetry1Medical Physics Unit, McGill University, Montréal, QC, Canada, 2Medical Imaging, McGill University Health Centre, Montréal, QC, Canada
Synopsis
Keywords: Oxygenation, Oxygenation, BOLD, OE-MRI, DCE-MRI, TOLD, QSM, relaxometry, MR oximetry, hypoxia
We will review 1H MR-oximetry techniques including R1, R2*, DCE, and susceptibility-based techniques. We will present the basic principles behind each technique and the results of representative studies that show the relationship between MR-derived markers and blood and tissue oxygenation or hypoxia. We will also discuss oxygen modulation techniques in animal models and humans, report on trends in 1H MR-based oximetry techniques over the last two decades, and summarize the current state and challenges in the field as a whole.
Motivation
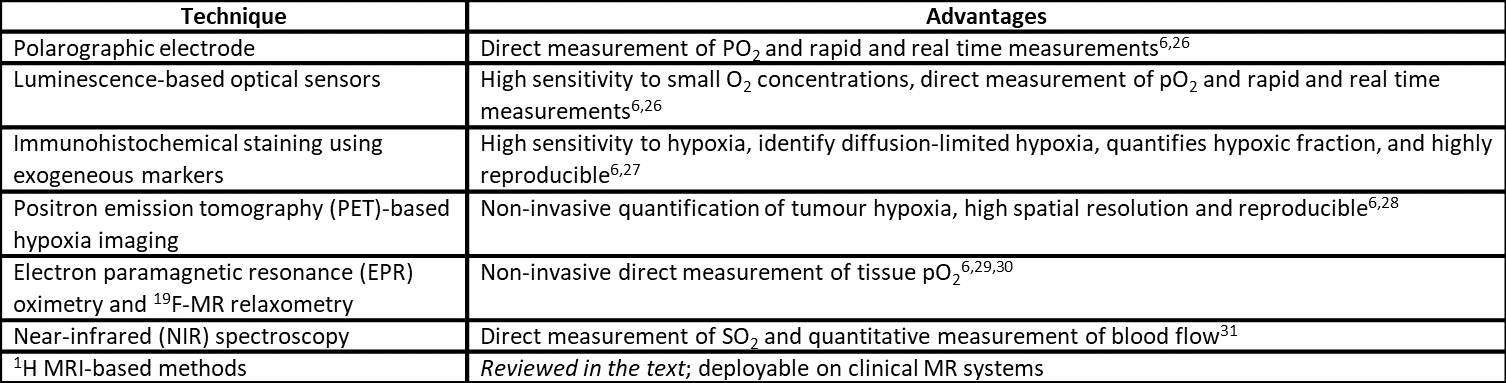
Sub-physiological supply of oxygen (O2) to tissue results in hypoxia1. Hypoxia is a marker for tumour progression and poor treatment outcome1, and is linked to a variety of disorders including fatty liver2, lung3, and cardiovascular2 disease, diabetes2, and renal dysfunction4. Hypoxia and tissue oxygenation can be assessed by measurement of O2 partial pressure (pO2)5. Polarographic electrode insertions provide the current pO2 “gold-standard” measurement, but the technique is invasive6. Oximetry techniques and their advantages are listed in Table 1. Growing interest has been placed in proton MRI (1H MRI)-based oximetry as a candidate for non-invasive, non-ionizing, and volumetric characterization of tissue oxygenation. We will review the theory behind various O2-sensitive mechanisms in 1H MRI; discuss the applications, advantages, and disadvantages of different approaches; and summarize the current state of the field.Background
MR-oximetry techniques can be categorized depending on the MR-based marker used to assess the oxygenation state of blood and/or tissue.R1-based techniques: Deoxyhaemoglobin (deoxyHb) and dissolved O2 are both paramagnetic molecules that linearly increase R1 via dipolar interactions7. In well-perfused and oxygenated tissue, dissolved O2 drives the induced R1 changes, which are proportional to changes in tissue pO28. Tissue O2 level dependent (TOLD) MRI, also known as O2-enhanced (OE) MRI, relies on this effect. Increased sensitivity to dissolved O2 in tissue has been shown by measuring lipid R1 in techniques like MOBILE9 and saturation recovery T1 mapping10. However, challenges arise due to the confounding effects of blood flow, field strength, temperature, and intrinsic tissue properties7.
R2*-based techniques: Local magnetic field gradients induced by deoxyHb increase blood R2*11. By extension, changes in R2* reflect blood O2 saturation (SO2)12. Techniques that exploit this effect fall under blood O2 level dependent (BOLD)-MRI. BOLD-MRI provides an indirect assessment of tissue oxygenation since blood pO2 (which is linked to SO2 by the oxygen-haemoglobin dissociation curve13) differs from tissue pO2 due to pressure gradients that drive O2 transport between vessels and mitochondria12. The link between R2* and deoxyHb however is complicated by factors like blood volume, blood flow, and vascular geometry7.
Susceptibility-based techniques: Susceptibility gradients introduced by the presence of dissolved O2 and deoxyHb can be directly measured with quantitative susceptibility mapping (QSM)14. Thus, in principle, QSM facilitates the assessment of local tissue oxygenation by quantifying the presence of these two substances and circumventing confounding effects in BOLD-MRI. QSM has been used for in vivo measurement of SO215, but phantom studies suggest QSM lacks the necessary sensitivity for tissue pO2 measurement16.
Dynamic contrast-enhanced (DCE)-MRI: Spatiotemporal changes in signal following the injection of a contrast agent depend on tissue perfusion and vascular density. These factors relate to tissue oxygenation and hypoxia, making DCE-MRI suitable for indirect assessment of tissue oxygenation state17.
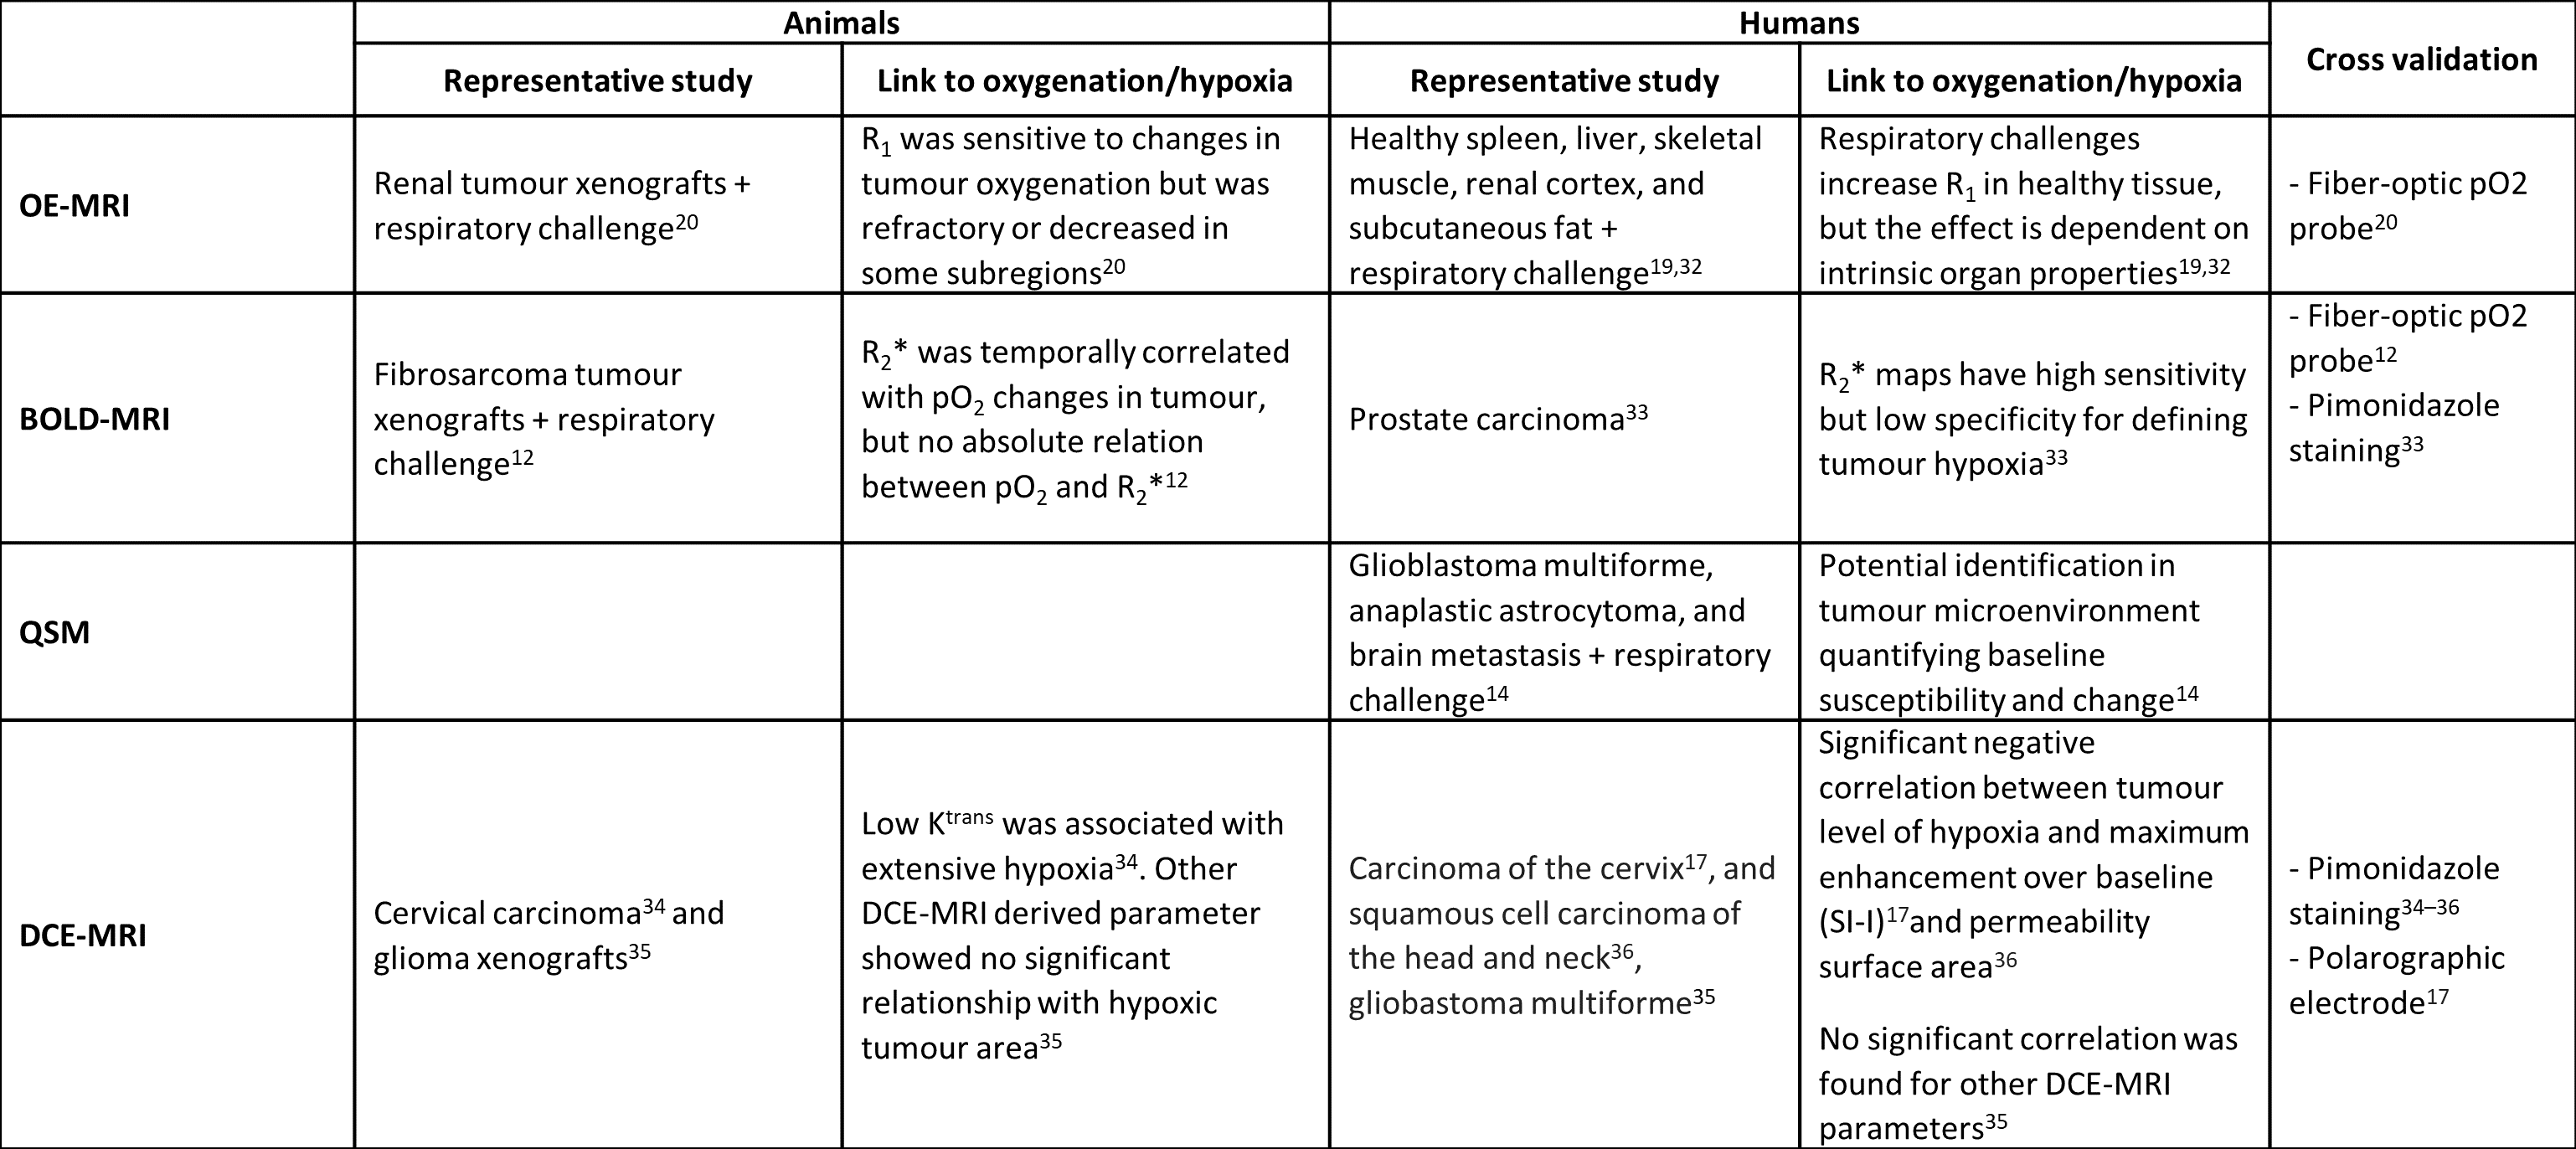
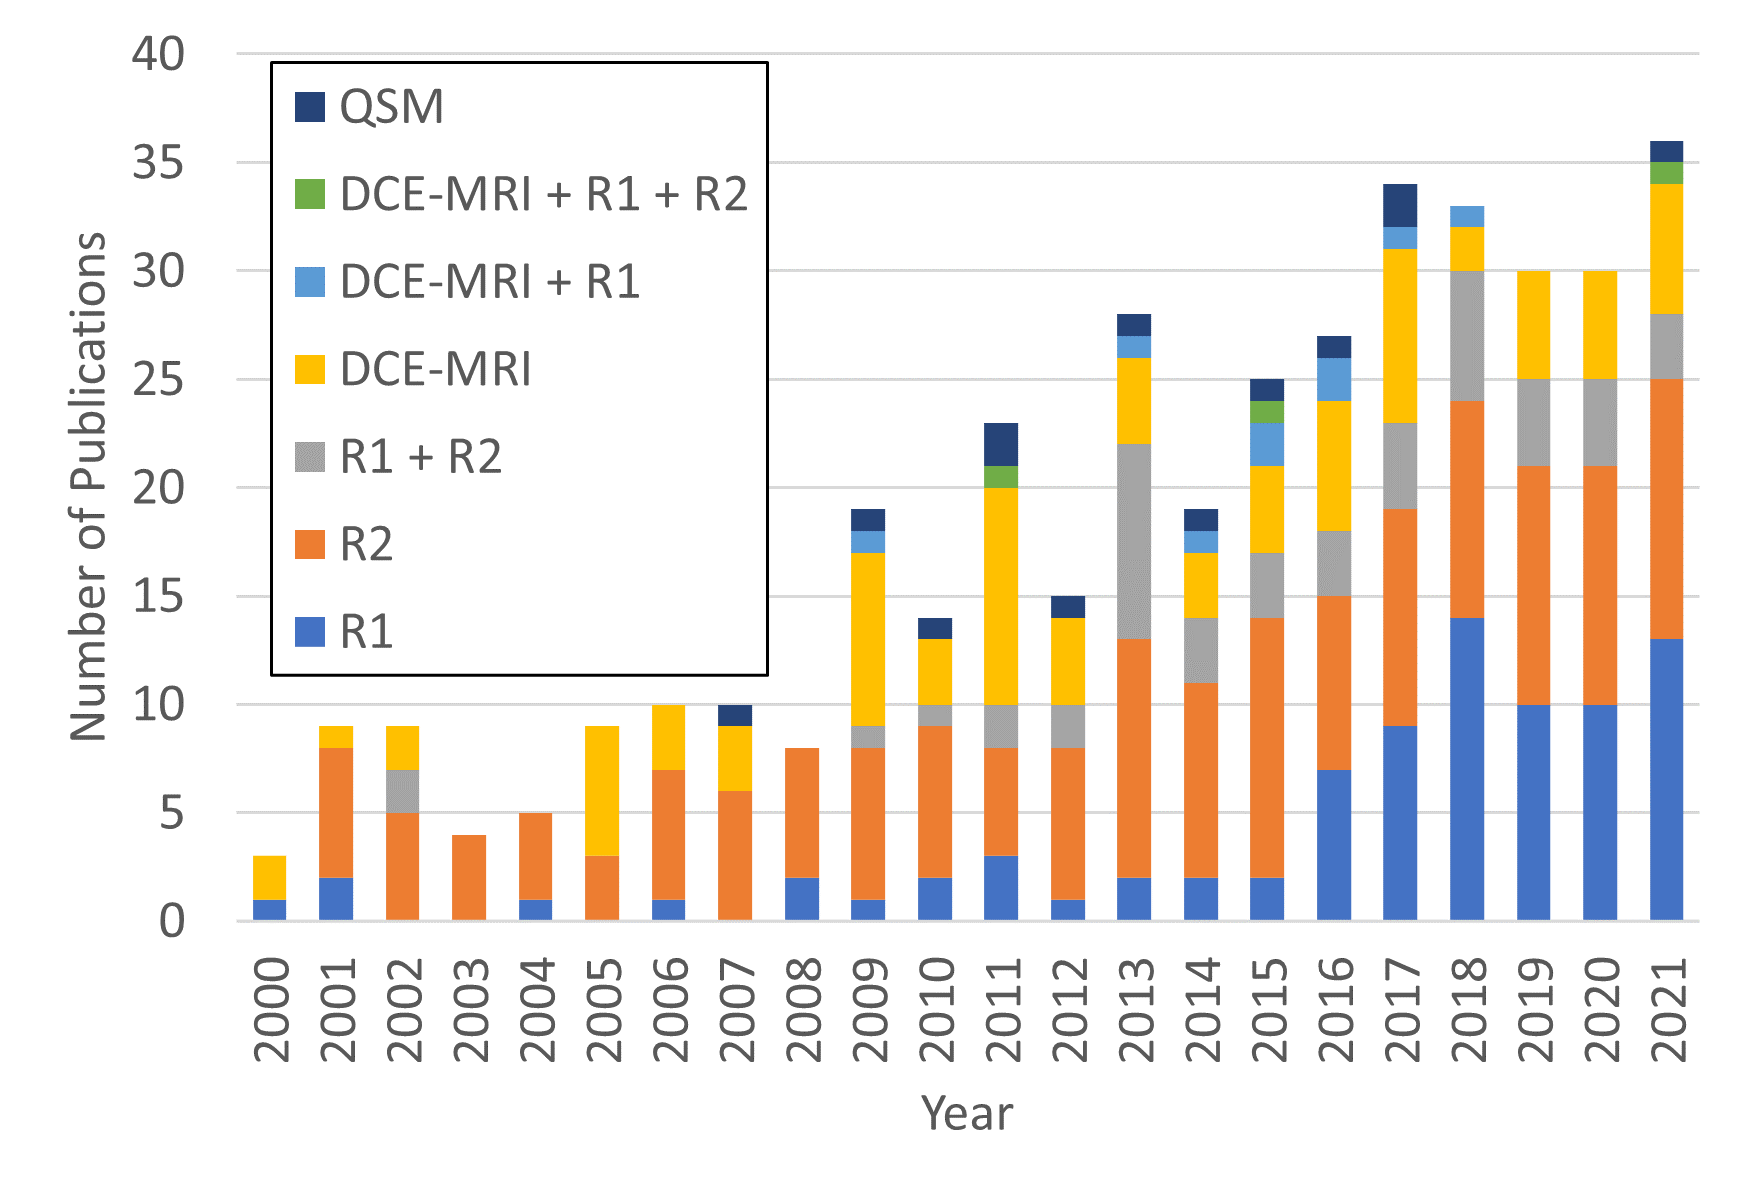
MR-oximetry techniques have been used to assess the effect of O2 modulation challenges in different anatomical regions in healthy volunteers, preclinical models of cancer, and human tumours. A summary of representative results of different techniques is presented in Table 2. The growing trends of the MR-oximetry field and evolution in the interests of each approach are illustrated in Figure 1.
Oxygen modulation methods
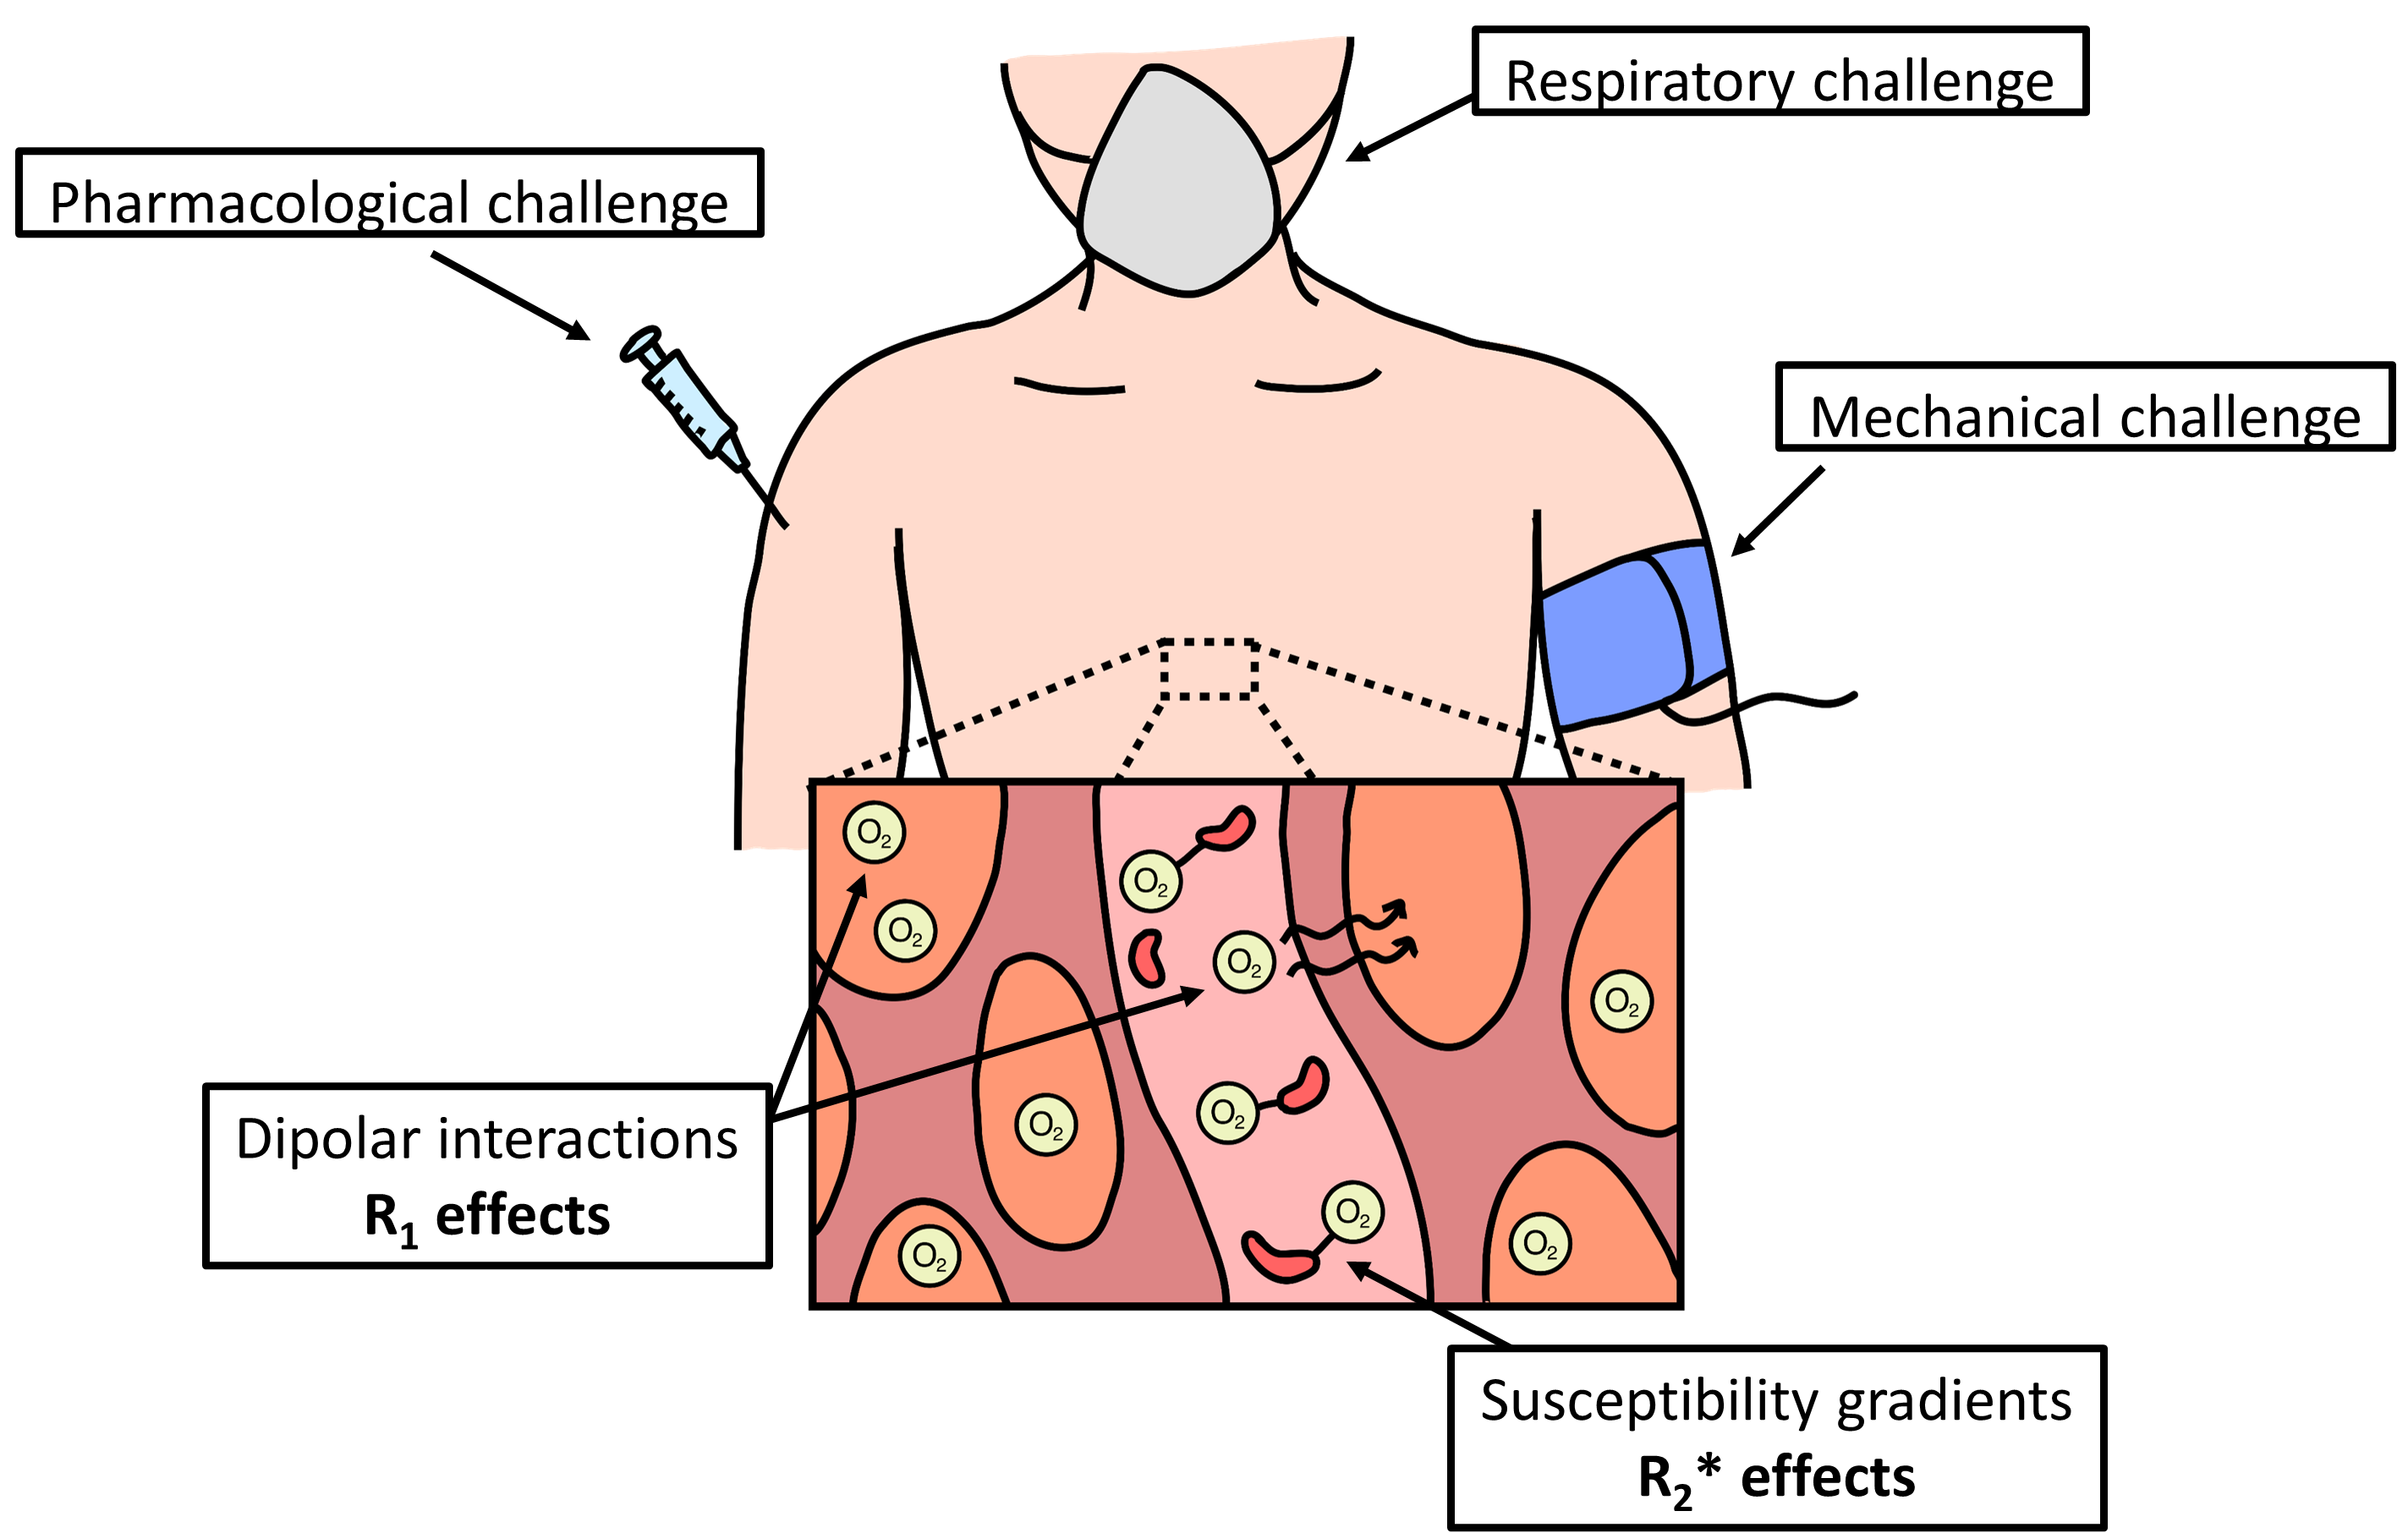
Tissue pO2 modulation techniques enable the study of relationships between MR-based markers and the oxygenation state of tissue. We will broadly classify pO2 modulation techniques as respiratory, pharmacological, and mechanical challenges. Respiratory challenges alter arterial pO2 and partial pressure of carbon dioxide (pCO2) leading to changes in blood flow and dissolved O2 in tissue and blood18. These challenges consist of the inhalation of hypoxic (<21% O2) or hyperoxic (>21% O2) gas mixtures, either using a combination of O2 and nitrogen, or carbogen19. Pharmacological challenges use drugs to alter blood flow and/or metabolic activity, and consequently tissue pO2. Examples include the administration of hydralazine to induce tissue hypoxia20 or norepinephrine to trigger metabolic activity and increase O2 consumption21. Mechanical challenges such as occlusion-induced ischaemia alter blood flow with mechanical devices9,22. A pictorial representation of each category is presented in Figure 2.Discussion
Improvements in 1H MR-oximetry have been driven by the combination of the various approaches, enabling more thorough characterization of blood and tissue oxygenation. Paired measurements of R1 and R2*23 or R1 and DCE-MRI20 have been used to identify tissue oxygenation and perfusion state, which also enables hypoxia mapping. BOLD has been modified to extract quantitative values for haemodynamic parameters such as blood volume, deoxyHb concentration, and O2 oxygen extraction fraction (OEF) in a framework called quantitative BOLD (qBOLD)24. Finally, PISTOL is a technique utilizing 1H MRI alongside the molecule hexamethyldisiloxane (HMDSO) as a sensitive proton NMR indicator of tissue pO225. This technique can directly quantify pO2, but the safe administration of HMDSO in humans has not yet been demonstrated25.Conclusions
1H MRI has been investigated for the purposes of measuring oxygenation and detecting hypoxia in the human body. MR-oximetry research has demonstrated the correspondence between blood and tissue oxygenation and MR-based markers. However, the assessment of tissue oxygenation poses limitations necessitating further research to reliably detect responses to oxygenation modulation techniques for a wide range of tissue oxygenation states. Moreover, future work in the field should aim to consolidate MR-based parameters as consistent and clinically feasible biomarkers for O2 and hypoxia assessment and tracking7.Acknowledgements
The authors acknowledge funding from an NSERC Discovery Grant, NSERC CGS-M Award (CC), FRQNT Doctoral Award (JCP), and FRQS Chercheur Boursier (IRL).References
1. Höckel M, Vaupel P. Tumor hypoxia: definitions and current clinical, biologic, and molecular aspects. J Natl Cancer Inst. 2001;93(4):266-276.
2. Hodson L. Adipose tissue oxygenation: Effects on metabolic function. Adipocyte. 2014;3(1):75.
3. Tuder RM, Yun JH, Bhunia A, Fijalkowska I. Hypoxia and chronic lung disease. J Mol Med (Berl). 2007;85(12):1317-1324.
4. Ow CPC, Ngo JP, Ullah MM, Hilliard LM, Evans RG. Renal hypoxia in kidney disease: Cause or consequence? Acta Physiol (Oxf). 2018;222(4):e12999.
5. Carreau A, El Hafny-Rahbi B, Matejuk A, Grillon C, Kieda C. Why is the partial oxygen pressure of human tissues a crucial parameter? Small molecules and hypoxia. J Cell Mol Med. 2011;15(6):1239-1253.
6. Le QT, Courter D. Clinical biomarkers for hypoxia targeting. Cancer Metastasis Rev. 2008;27(3):351-362.
7. O’Connor JPB, Robinson SP, Waterton JC. Imaging tumour hypoxia with oxygen-enhanced MRI and BOLD MRI. Br J Radiol. 2019;92(1095):20180642.
8. Vanderkooi JM, Erecińska M, Silver IA. Oxygen in mammalian tissue: methods of measurement and affinities of various reactions. Am J Physiol. 1991;260(6 Pt 1):C1131-50.
9. Jordan BF, Magat J, Colliez F, et al. Mapping of oxygen by imaging lipids relaxation enhancement: a potential sensitive endogenous MRI contrast to map variations in tissue oxygenation. Magn Reson Med. 2013;70(3):732-744.
10. Franconi F, Lemaire L, Saint-Jalmes H, Saulnier P. Tissue oxygenation mapping by combined chemical shift and T1 magnetic resonance imaging. Magn Reson Med. 2018;79(4):1981-1991.
11. Thulborn KR, Waterton JC, Matthews PM, Radda GK. Oxygenation dependence of the transverse relaxation time of water protons in whole blood at high field. Biochim Biophys Acta. 1982;714(2):265-270.
12. Baudelet C, Gallez B. How does blood oxygen level-dependent (BOLD) contrast correlate with oxygen partial pressure (pO2) inside tumors? Magn Reson Med. 2002;48(6):980-986.
13. Collins JA, Rudenski A, Gibson J, Howard L, O’Driscoll R. Relating oxygen partial pressure, saturation and content: the haemoglobin-oxygen dissociation curve. Breathe (Sheffield, England). 2015;11(3):194-201.
14. Özbay PS, Stieb S, Rossi C, et al. Lesion magnetic susceptibility response to hyperoxic challenge: A biomarker for malignant brain tumor microenvironment? Magn Reson Imaging. 2018;47:147-153.
15. Wen Y, Nguyen TD, Liu Z, et al. Cardiac quantitative susceptibility mapping (QSM) for heart chamber oxygenation. Magn Reson Med. 2018;79(3):1545-1552.
16. Fortier V, Levesque IR. Dissolved oxygen minimally affects magnetic susceptibility in biologically relevant conditions. bioRxiv. Published online January 1, 2021:2021.03.13.434266.
17. Cooper RA, Carrington BM, Loncaster JA, et al. Tumour oxygenation levels correlate with dynamic contrast-enhanced magnetic resonance imaging parameters in carcinoma of the cervix. Radiother Oncol J Eur Soc Ther Radiol Oncol. 2000;57(1):53-59.
18. Moreton FC, Dani KA, Goutcher C, O’Hare K, Muir KW. Respiratory challenge MRI: Practical aspects. NeuroImage Clin. 2016;11:667-677.
19. O’Connor JPB, Naish JH, Jackson A, et al. Comparison of normal tissue R1 and R*2 modulation by oxygen and carbogen. Magn Reson Med. 2009;61(1):75-83.
20. O’Connor JPB, Boult JKR, Jamin Y, et al. Oxygen-Enhanced MRI Accurately Identifies, Quantifies, and Maps Tumor Hypoxia in Preclinical Cancer Models. Cancer Res. 2016;76(4):787-795.
21. Khanna A, Branca RT. Detecting brown adipose tissue activity with BOLD MRI in mice. Magn Reson Med. 2012;68(4):1285-1290.
22. Stacy MR, Qiu M, Papademetris X, Caracciolo CM, Constable RT, Sinusas AJ. Application of BOLD Magnetic Resonance Imaging for Evaluating Regional Volumetric Foot Tissue Oxygenation: A Feasibility Study in Healthy Volunteers. Eur J Vasc Endovasc Surg Off J Eur Soc Vasc Surg. 2016;51(5):743-749.
23. Burrell JS, Walker-Samuel S, Baker LCJ, et al. Exploring ΔR(2) * and ΔR(1) as imaging biomarkers of tumor oxygenation. J Magn Reson Imaging. 2013;38(2):429-434.
24. He X, Yablonskiy DA. Quantitative BOLD: mapping of human cerebral deoxygenated blood volume and oxygen extraction fraction: default state. Magn Reson Med. 2007;57(1):115-126.
25. Kodibagkar VD, Wang X, Pacheco-Torres J, Gulaka P, Mason RP. Proton imaging of siloxanes to map tissue oxygenation levels (PISTOL): a tool for quantitative tissue oximetry. NMR Biomed. 2008;21(8):899-907.
26. Collingridge DR, Young WK, Vojnovic B, et al. Measurement of tumor oxygenation: a comparison between polarographic needle electrodes and a time-resolved luminescence-based optical sensor. Radiat Res. 1997;147(3):329-334.
27. Bache M, Kappler M, Said HM, Staab A, Vordermark D. Detection and specific targeting of hypoxic regions within solid tumors: current preclinical and clinical strategies. Curr Med Chem. 2008;15(4):322-338.
28. Lapi SE, Voller TF, Welch MJ. PET Imaging of Hypoxia. PET Clin. 2009;4(1):39-47. doi:https://doi.org/10.1016/j.cpet.2009.05.009
29. Williams BB, Khan N, Zaki B, Hartford A, Ernstoff MS, Swartz HM. Clinical electron paramagnetic resonance (EPR) oximetry using India ink. Adv Exp Med Biol. 2010;662:149-156.
30. Safley SA, Graham ML, Weegman BP, et al. Noninvasive Fluorine-19 Magnetic Resonance Relaxometry Measurement of the Partial Pressure of Oxygen in Acellular Perfluorochemical-loaded Alginate Microcapsules Implanted in the Peritoneal Cavity of Nonhuman Primates. Transplantation. 2020;104(2):259-269.
31. Boushel R, Langberg H, Olesen J, Gonzales-Alonzo J, Bülow J, Kjær M. Monitoring tissue oxygen availability with near infrared spectroscopy (NIRS) in health and disease. Scand J Med Sci Sports. 2001;11(4):213-222.
32. O’Connor JPB, Jackson A, Buonaccorsi GA, et al. Organ-specific effects of oxygen and carbogen gas inhalation on tissue longitudinal relaxation times. Magn Reson Med. 2007;58(3):490-496.
33. Hoskin PJ, Carnell DM, Taylor NJ, et al. Hypoxia in prostate cancer: correlation of BOLD-MRI with pimonidazole immunohistochemistry-initial observations. Int J Radiat Oncol Biol Phys. 2007;68(4):1065-1071.
34. Ellingsen C, Hompland T, Galappathi K, Mathiesen B, Rofstad EK. DCE-MRI of the hypoxic fraction, radioresponsiveness, and metastatic propensity of cervical carcinoma xenografts. Radiother Oncol J Eur Soc Ther Radiol Oncol. 2014;110(2):335-341.
35. Linnik I V, Scott MLJ, Holliday KF, et al. Noninvasive tumor hypoxia measurement using magnetic resonance imaging in murine U87 glioma xenografts and in patients with glioblastoma. Magn Reson Med. 2014;71(5):1854-1862.
36. Donaldson SB, Betts G, Bonington SC, et al. Perfusion estimated with rapid dynamic contrast-enhanced magnetic resonance imaging correlates inversely with vascular endothelial growth factor expression and pimonidazole staining in head-and-neck cancer: a pilot study. Int J Radiat Oncol Biol Phys. 2011;81(4):1176-1183.
Figures