5381
Liver Fibrosis Evaluation with MRI- A Primer for Engineers, Physicists, and Technologists
Sudhakar K Venkatesh1, Jiahui Li2, Meng Yin1, and Michael S Torbenson3
1Radiology, Mayo Clinic, Rochester, MN, United States, 2Radiology, li.jiahui@mayo.edu, Rochester, MN, United States, 3Pathology, Mayo Clinic, Rochester, MN, United States
1Radiology, Mayo Clinic, Rochester, MN, United States, 2Radiology, li.jiahui@mayo.edu, Rochester, MN, United States, 3Pathology, Mayo Clinic, Rochester, MN, United States
Synopsis
Keywords: Liver, Elastography, fibrosis
Knowledge of the pathophysiology of liver fibrosis (LF) is important to understand the application of MRI techniques in the evaluation of LF. LF is characterized by excessive deposition of extracellular matrix, predominantly in the collagen content that leads to measurable changes in MRI signal and also mechanical properties. In this educational exhibit, we will describe the pathology and evolution of LF in chronic liver diseases. Next, we will describe key concepts that form the basis for several MRI techniques for LF evaluation. An outline of confounders, limitations, current and future applications of the MRI techniques will be provided.Introduction
Liver fibrosis (LF) is a healing response to chronic liver injury and when untreated progresses to cirrhosis and its associated complications including portal hypertension, liver failure and hepatocellular carcinoma.Liver fibrosis pathophysiology
Normal liver has a small amount of fibrous tissue providing architectural support and scaffolding in the form of extracellular matrix (ECM) composed mainly of collagen, glycoproteins, and proteoglycans. Normal liver collagen content is usually <1%, approximately 2-8mg/g weight whereas in LF, this increases to 5-6-fold to the order of 30mg/g weight or more. LF is a dynamic process with accumulation and degradation of ECM, and parenchymal remodeling occurring simultaneously and at variable rate (1). When accumulation exceeds degradation, LF progresses to cirrhosis. LF progresses through different fibrosis stages (stage 0-4) which are currently used for clinical management (fig.1). Cirrhosis of liver is characterized by formation of regenerative nodules of liver parenchyma that are encapsulated by fibrous tissue septa and changes in vascular architecture (2). Different chronic liver diseases (CLD) produce characteristic spatial patterns of fibrosis, and all etiologies result in inhomogeneous distribution of fibrosis throughout the liver (fig.1).Liver fibrosis evaluation with MRI
A number of technological advances has established MRI as a clinically important modality for evaluation of liver fibrosis. The MR techniques can be broadly classified into a) Qualitative MRI and b) Quantitative MRI (Fig.2).Qualitative assessment
1. Textural changes- liver parenchyma becomes coarser and appears heterogeneous on MRI images particularly on T2W, DWI and post contrast images (fig.3)
2. Morphological changes in liver anatomy include right lobe atrophy, caudate lobe hypertrophy, left lobe hypertrophy, nodular outline, enlarged periportal space, enlarged gall bladder fossa sign, and posterior hepatic notch sign. These signs are mostly present when LF is advanced, or liver is cirrhotic.
Qualitative assessment is subjective, and performance depends on the experience of the readers. The anatomical images are reviewed. However, some of these qualitative features are quantifiable. For example, texture analysis using AI, DWI using apparent diffusion coefficient, surface nodularity index and fractional extracellular space (fECS) estimation with intravenous contrast. Common limitation for these qualitative features is the lack of standardization of the MRI parameters across scanners and vendors, dependence on magnet strength and gradient performance and need of intravenous contrast and prolonged scanning time.
Diffusion weighted imaging (DWI)
LF creates barriers for free diffusion of protons in the extracellular space. Restricted diffusion leads to increased signal on DWI which can be quantified using apparent diffusion coefficient (ADC). The ADC reduces with increased diffusion restriction. Although useful in differentiating cirrhosis from normal livers, there is significant overlap of the ADC values between intermediate stages of LF (3, 4) limiting the use of DWI routinely for assessment. In addition, there is no standardization of the parameters across scanners and vendors. DWI is a sensitive technique and susceptible to motion artifacts.Fractional extracellular space (fECS) estimation
Extracellular contrast agent (ECA) leaks from blood pool into and accumulates in the interstitial space and rapidly cleared in normal liver. However, in liver fibrosis, there is excessive amount of extracellular fluid due to collagen fibers and this leads to retention of more contrast in the delayed or equilibrium phase. Fractional extracellular space (fECS) estimation with MRI is a simple calculation to perform and may represent a practical way to suggest the presence of LF during routine liver MR evaluation. In one study, the accuracy of fECS was only 0.72 for detection of cirrhosis (5). However. one needs computation of hematocrit values, and a standardized equilibrium phase should be obtained for all cases for routine use. The performance of fECS in detection of early-stage fibrosis is not well established.Volumetry
Volumetry of the liver can be performed with or without contrast administration. Whereas total liver volume is a poor predictor of LF, regional changes in hepatic lobe volume and splenic volume correlate well with degree of fibrosis (6). The relative volumes are good at predicting advanced LF. In one study MR elastography performed better than liver and spleen volumes for prediction of liver disease severity and hepatic decompensation in primary sclerosing cholangitis (7).Liver surface nodularity (LSN)
LSN score is a fast method for precise quantification of nodularity of liver surface. While CT based LSN has shown utility in chronic viral diseases, MR-based LSN score is promising to accurately detect different stages of fibrosis in patients with NAFLD (8,9)MR Elastography (MRE)
MRE is currently the most accurate imaging technique for evaluation of LF (10). MRE has consistently shown very high accuracy for detection, staging of LF (11). MRE is also useful for prediction of outcome in chronic liver diseases. Technical advances and evaluation of other mechanical parameters for differentiation of confounders is promising.T1 mapping
T1-mapping of liver parenchyma is of value in evaluation of inflammation and fibrosis particularly in nonalcoholic steatohepatitis (14.15). However, the technique is not widely available or routinely performed as it needs additional computation, correction for liver fat and iron content and ECG gating.Acknowledgements
Buzz team at Mayo Clinic, Rochester, MNReferences
- Pinzani M, Rombouts K. Liver fibrosis: from the bench to clinical targets. Dig Liver Dis. 2004;36(4):231-42.
- Pinzani M, Rombouts K, Colagrande S. Fibrosis in chronic liver diseases: diagnosis and management. J Hepatol. 2005;42 Suppl(1):S22-36.
- Venkatesh SK, Torbenson MS. Liver fibrosis quantification. Abdom Radiol (NY). 2022 Mar;47(3):1032-1052.
- Sandrasegaran K, Akisik FM, Lin C, Tahir B, Rajan J, Saxena R, Aisen AM. Value of diffusion-weighted MRI for assessing liver fibrosis and cirrhosis. AJR Am J Roentgenol. 2009 Dec;193(6):1556-60.
- Wells ML, Moynagh MR, Carter RE, Childs RA, Leitch CE, Fletcher JG, Yeh BM, Venkatesh SK. Correlation of hepatic fractional extracellular space using gadolinium enhanced MRI with liver stiffness using magnetic resonance elastography. Abdom Radiol (NY). 2017 Jan;42(1):191-198.
- Pickhardt PJ, Malecki K, Hunt OF, Beaumont C, Kloke J, Ziemlewicz TJ, Lubner MG. Hepatosplenic volumetric assessment at MDCT for staging liver fibrosis. Eur Radiol. 2017 Jul;27(7):3060-3068.
- Idilman IS, Low HM, Bakhshi Z, Eaton J, Venkatesh SK. Comparison of liver stiffness measurement with MRE and liver and spleen volumetry for prediction of disease severity and hepatic decompensation in patients with primary sclerosing cholangitis. Abdom Radiol (NY). 2020 Mar;45(3):701-709.
- Catania R, Furlan A, Smith AD, Behari J, Tublin ME, Borhani AA. Diagnostic value of MRI-derived liver surface nodularity score for the non-invasive quantification of hepatic fibrosis in non-alcoholic fatty liver disease. Eur Radiol. 2021 Jan;31(1):256-263.
- Dioguardi Burgio M, Sartoris R, Beaufrere A, Grégory J, Guiu B, Guillot C, Rautou PE, Castera L, Bouattour M, Paradis V, Vilgrain V, Ronot M. Liver surface nodularity on non-contrast MRI identifies advanced fibrosis in patients with NAFLD. Eur Radiol. 2022 Mar;32(3):1781-179
- Idilman IS, Li J, Yin M, Venkatesh SK. MR elastography of liver: current status and future perspectives. Abdom Radiol (NY). 2020 Nov;45(11):3444-3462.
- Singh S, Venkatesh SK, Wang Z, et al. Diagnostic performance of magnetic resonance elastography in staging liver fibrosis: a systematic review and meta-analysis of individual participant data. Clin Gastroenterol Hepatol. 2015 Mar;13(3):440-451.e6.
- Gidener T, Yin M, Dierkhising RA, Allen AM, Ehman RL, Venkatesh SK. Magnetic resonance elastography for prediction of long-term progression and outcome in chronic liver disease: A retrospective study. Hepatology. 2022 Feb;75(2):379-390.
- Gidener T, Ahmed OT, Larson JJ, Mara KC, Therneau TM, Venkatesh SK, Ehman RL, Yin M, Allen AM. Liver Stiffness by Magnetic Resonance Elastography Predicts Future Cirrhosis, Decompensation, and Death in NAFLD. Clin Gastroenterol Hepatol. 2021 Sep;19(9):1915-1924.e6.
- Takayama Y, Nishie A, Asayama Y, Ushijima Y, Okamoto D, Fujita N, Morita K, Shirabe K, Kotoh K, Kubo Y, Okuaki T,Honda H (2015) T1 ρ Relaxation of the liver: A potential biomarker of liver function. J Magn Reson Imaging 42 (1):188-195.
- Hoffman DH, Ayoola A, Nickel D, Han F, Chandarana H, Shanbhogue KP (2020) T1 mapping, T2 mapping and MR elastography of the liver for detection and staging of liver fibrosis. Abdom Radiol (NY) 45 (3):692-700.
Figures
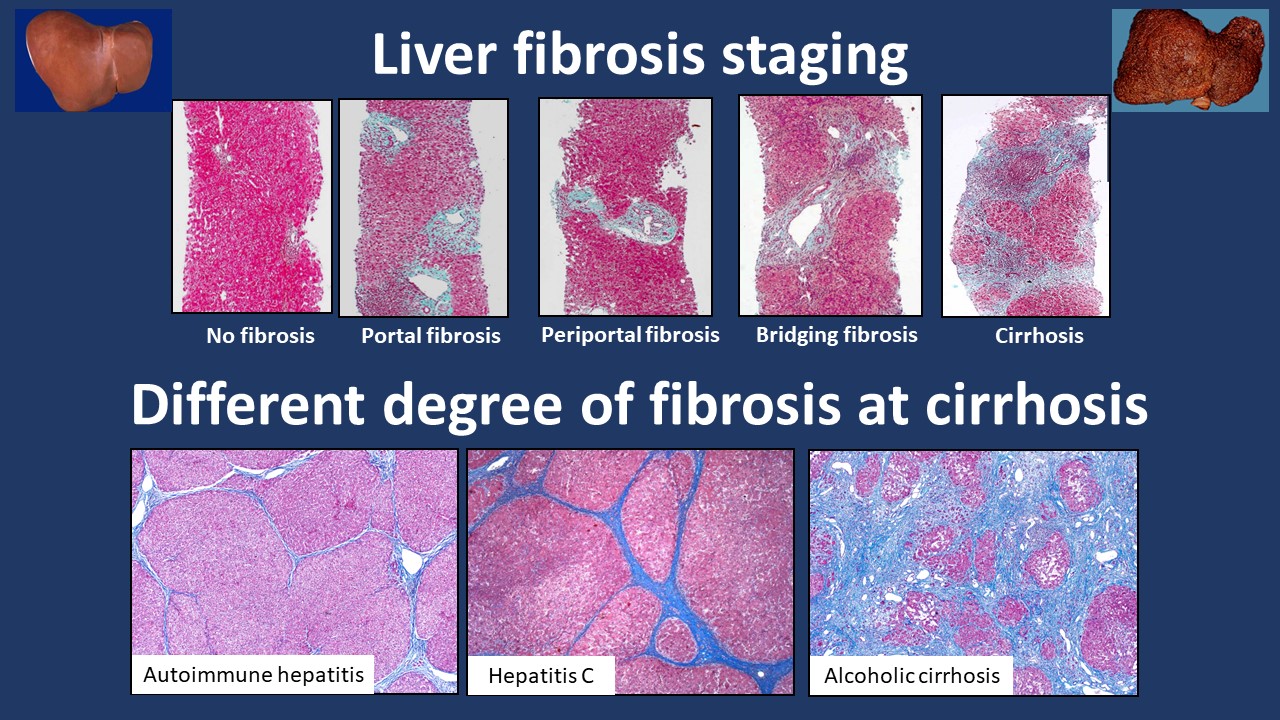
Fig.1. Top row.
Representative images of liver biopsies (Trichrome strain) showing normal liver
(no fibrosis), portal fibrosis (stage 1), periportal fibrosis with septa (stage
2), bridging fibrosis (stage 3) and cirrhosis (stage 4). Note normal liver parenchyma stains red/pink
and fibrosis stains blue. Bottom row. Examples of histological images of cirrhosis
from autoimmune hepatitis, hepatitis C and alcoholic hepatitis illustrating
spatial heterogeneity and also different degree of fibrosis deposition between
etiologies.
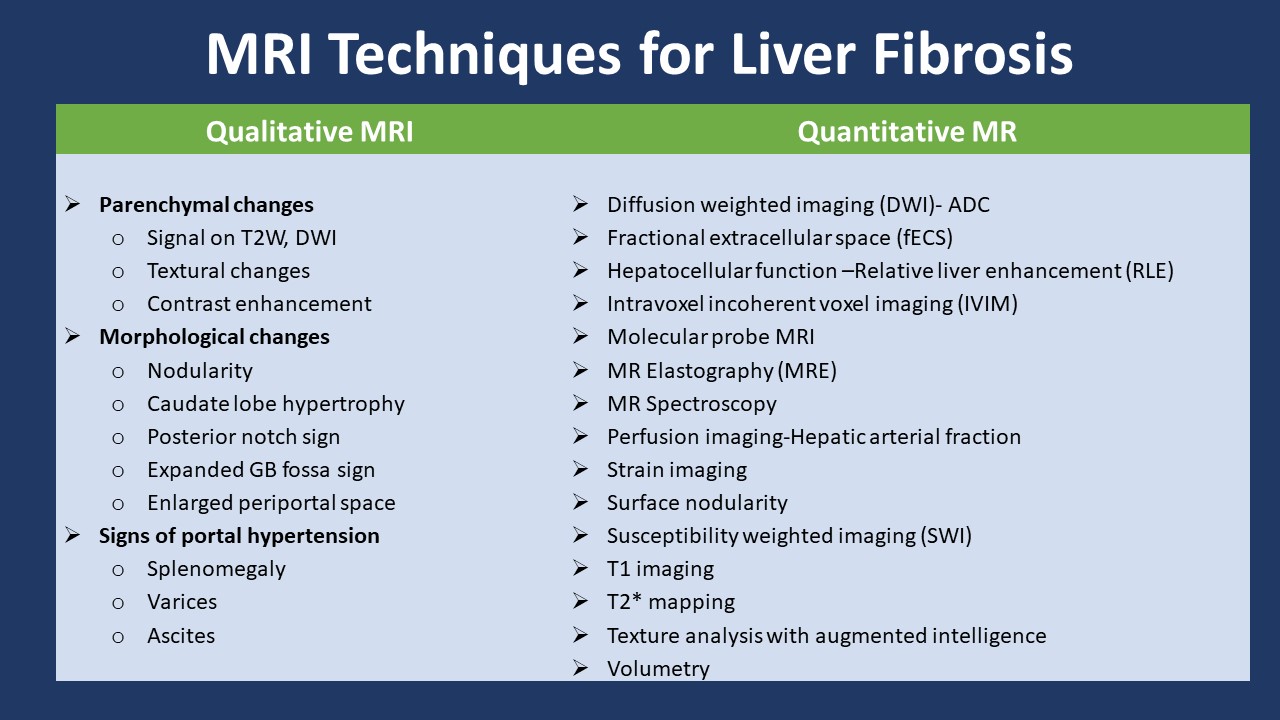
Fig.2. MRI techniques for
evaluation of liver fibrosis
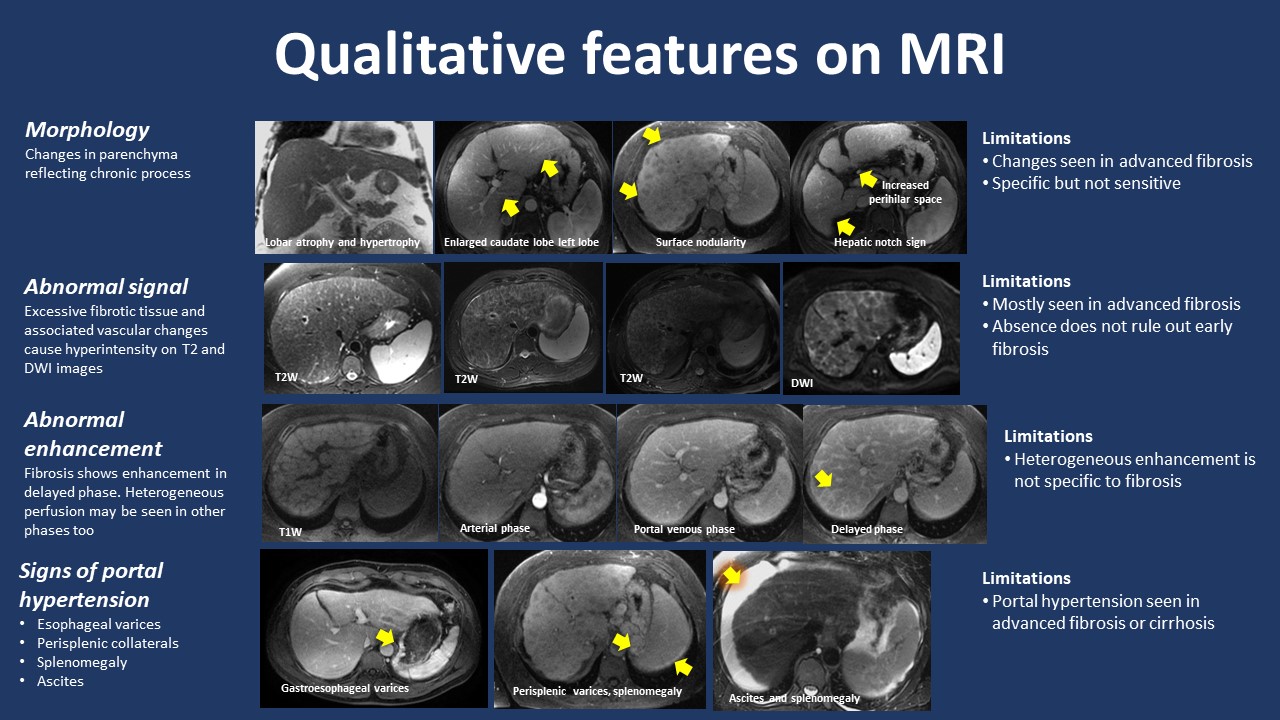
Fig.3. Summary of qualitative
features used for diagnosis of liver fibrosis and/or cirrhosis. Experienced
radiologists are able to detect subtle changes in these parameters. Addition of
augmented intelligence or deep learning for texture analysis may improve the
performance.
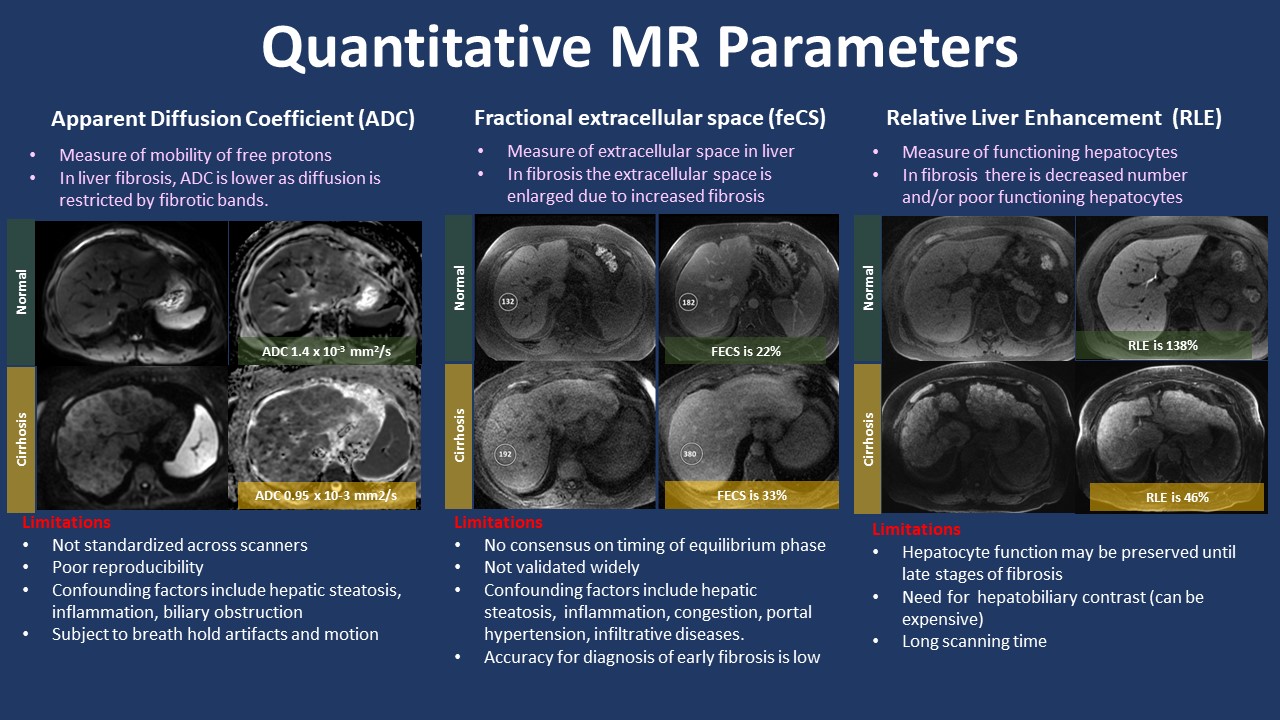
Fig.4. Quantitative
MR parameters that can be performed with routine clinical sequences. Note these
sequences are not standardized across MR scanners and may depend on magnet (1.5
T vs. 3T) and others need intravenous contrast administration.
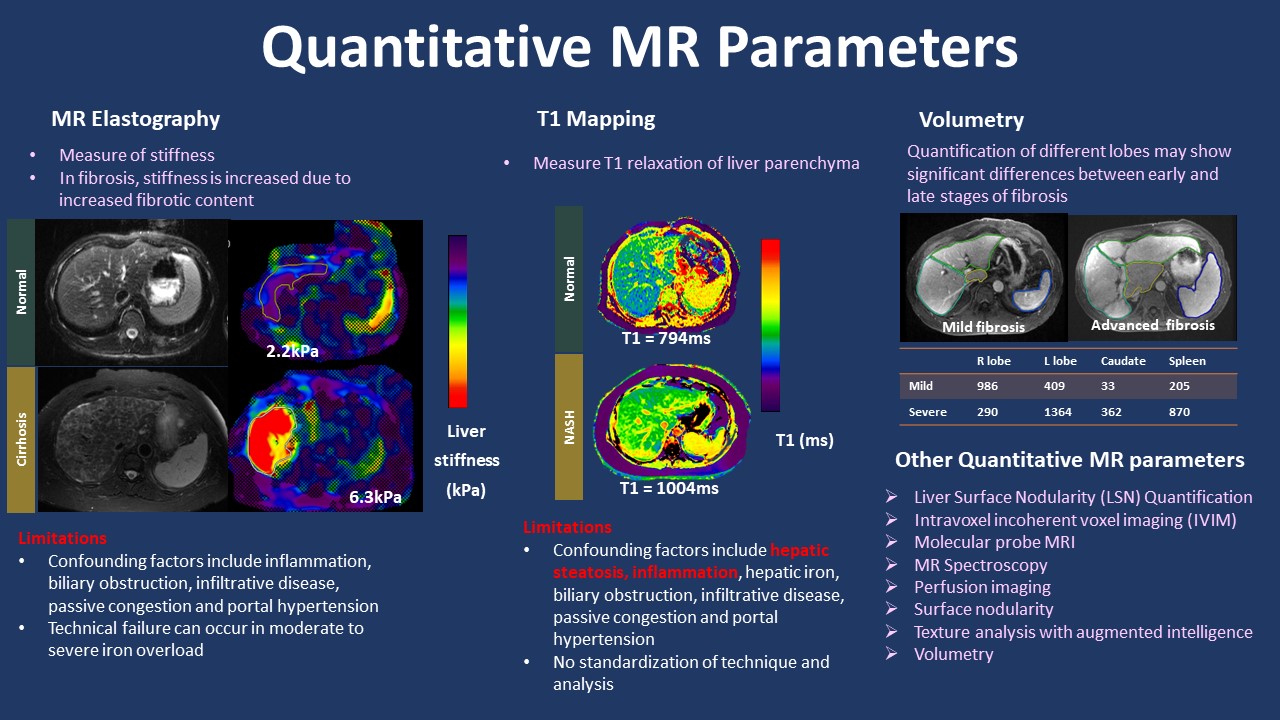
Fig.5. Quantitative
MR parameters that need additional technical or software for computing the quantitative
numbers. MR Elastography is currently considered the imaging reference standard
for evaluation of liver fibrosis imaging.
DOI: https://doi.org/10.58530/2023/5381