5372
Diffusion Tensor MRI in a Rat C6 Glioma Model at 9.4T1Medical Biophysics, Western University, London, ON, Canada, 2Centre for Functional and Metabolic Mapping, Robarts Research Institute, London, ON, Canada
Synopsis
Keywords: Diffusion/other diffusion imaging techniques, Brain, Animal model
The objective of this study was to characterize the diffusion properties of water in and around C6 glioma tumors in rats at 9.4T. DTI showed differences in some diffusion metrics between tumor tissue and surrounding tissues. Significantly higher FA, MD, and AD values were found in the tumor region compared to the contralateral side. DTI measurement of tumor microstructure and its surroundings could help to enhance the efficacy of diagnosis in different human malignancies.Introduction
Primary and metastatic brain tumors remain difficult to diagnose and treat due to relentless tumor growth and invasion into normal tissue, which often goes unrecognized. Contrast-enhanced T1- and T2-weighted MRIs are commonly used to identify such tumors; however, they may not show the full extent of cancerous tissue.1–3 Tissue microstructure can also vary considerably in brain tumors. Diffusion-weighted MRI measures the diffusion of water molecules within tissue and is sensitive to tissue microstructure. Characterizing the diffusion of the water within and around tumors may help identify the extent of cancerous tissue. A tensor model can be used to describe the water diffusion and measure the fractional anisotropy (FA), mean diffusivity (MD), axial diffusivity (AD), and radial diffusivity (RD).4–6 The purpose of this study was to characterize the diffusion properties of water within and surrounding the rat C6 glioma, which has not previously been performed at 9.4T.Methods
Six male adult Wistar rats were studied. Tumor cell implantation was initiated when rats were eight weeks old and grown to approximately 250 g. A 10 µL suspension containing 106 rat C6 glioma cells was manually injected at a depth of 3 mm from bregma into the right brain hemisphere. Rats were scanned on days 14-15 following tumor implantation. MRI data collection was performed on a 9.4T/31cm small animal MRI scanner consisting of a Varian magnet with a Bruker console (Bruker BioSpin Corp, Billerica, MA) and equipped with an in-house designed and built 15 cm gradient coil set with a maximum strength of 450 mT/m. A 6-channel receive-only phased array coil was used with a 2-channel transmit coil for data acquisition.7 The rats were placed on a custom-built stage securing their heads using bite and ear bars to limit respiratory motion. Anatomical images were acquired using a T2-weighted TurboRARE pulse sequence.8 Diffusion tensor images were acquired with a multi-shot, spin echo echo-planar-imaging pulse sequence (slice thickness = 500 μm, in-plane resolution = 250×250 μm, TE = 26.7 ms, TR = 2.5 s). Diffusion tensor imaging was acquired using two shells with a total of one hundred directions.9-11 Thirty directions with a b-value of 1000 s/mm2 and sixty directions with a b-value of 2000 s/mm2 were obtained. The remaining scans were acquired with a b-value of 0 s/mm2. One reverse phase encoded volume was also obtained to correct image distortions. The skull stripping tool from BrainSuite12 was used to make brain masks. Images then were pre-processed using Gibbs ringing correction followed by TOPUP and EDDY to correct susceptibility and eddy-current-induced distortions. For this study, DTI metrics maps, including FA, MD, AD, and RD, were generated using b0 and b1000 s/mm2 with the following diffusion gradient parameters: G = 244.4 mT/m, Δ = 14 ms, δ = 4.5 ms, as previously described.13,14 Regions of interest (tumor, tumor rim, contralateral grey matter (GM), contralateral white matter (WM), ipsilateral WM) were manually drawn on all the slices containing the solid tumor (including those with heterogeneous signal regions) using the FA maps. The tumor rim was defined as the bright ring surrounding the tumor. This rim may be due to vasogenic edema, such as the edema adjacent to meningiomas and metastatic tumors. Or it may be tumor-infiltrated edema, such as the edema surrounding gliomas. The ability of diffusion MRI to differentiate these, which must be confirmed by histology, is still controversial.15 Paired t-tests were used to compare DTI indices between the ROIs.Results
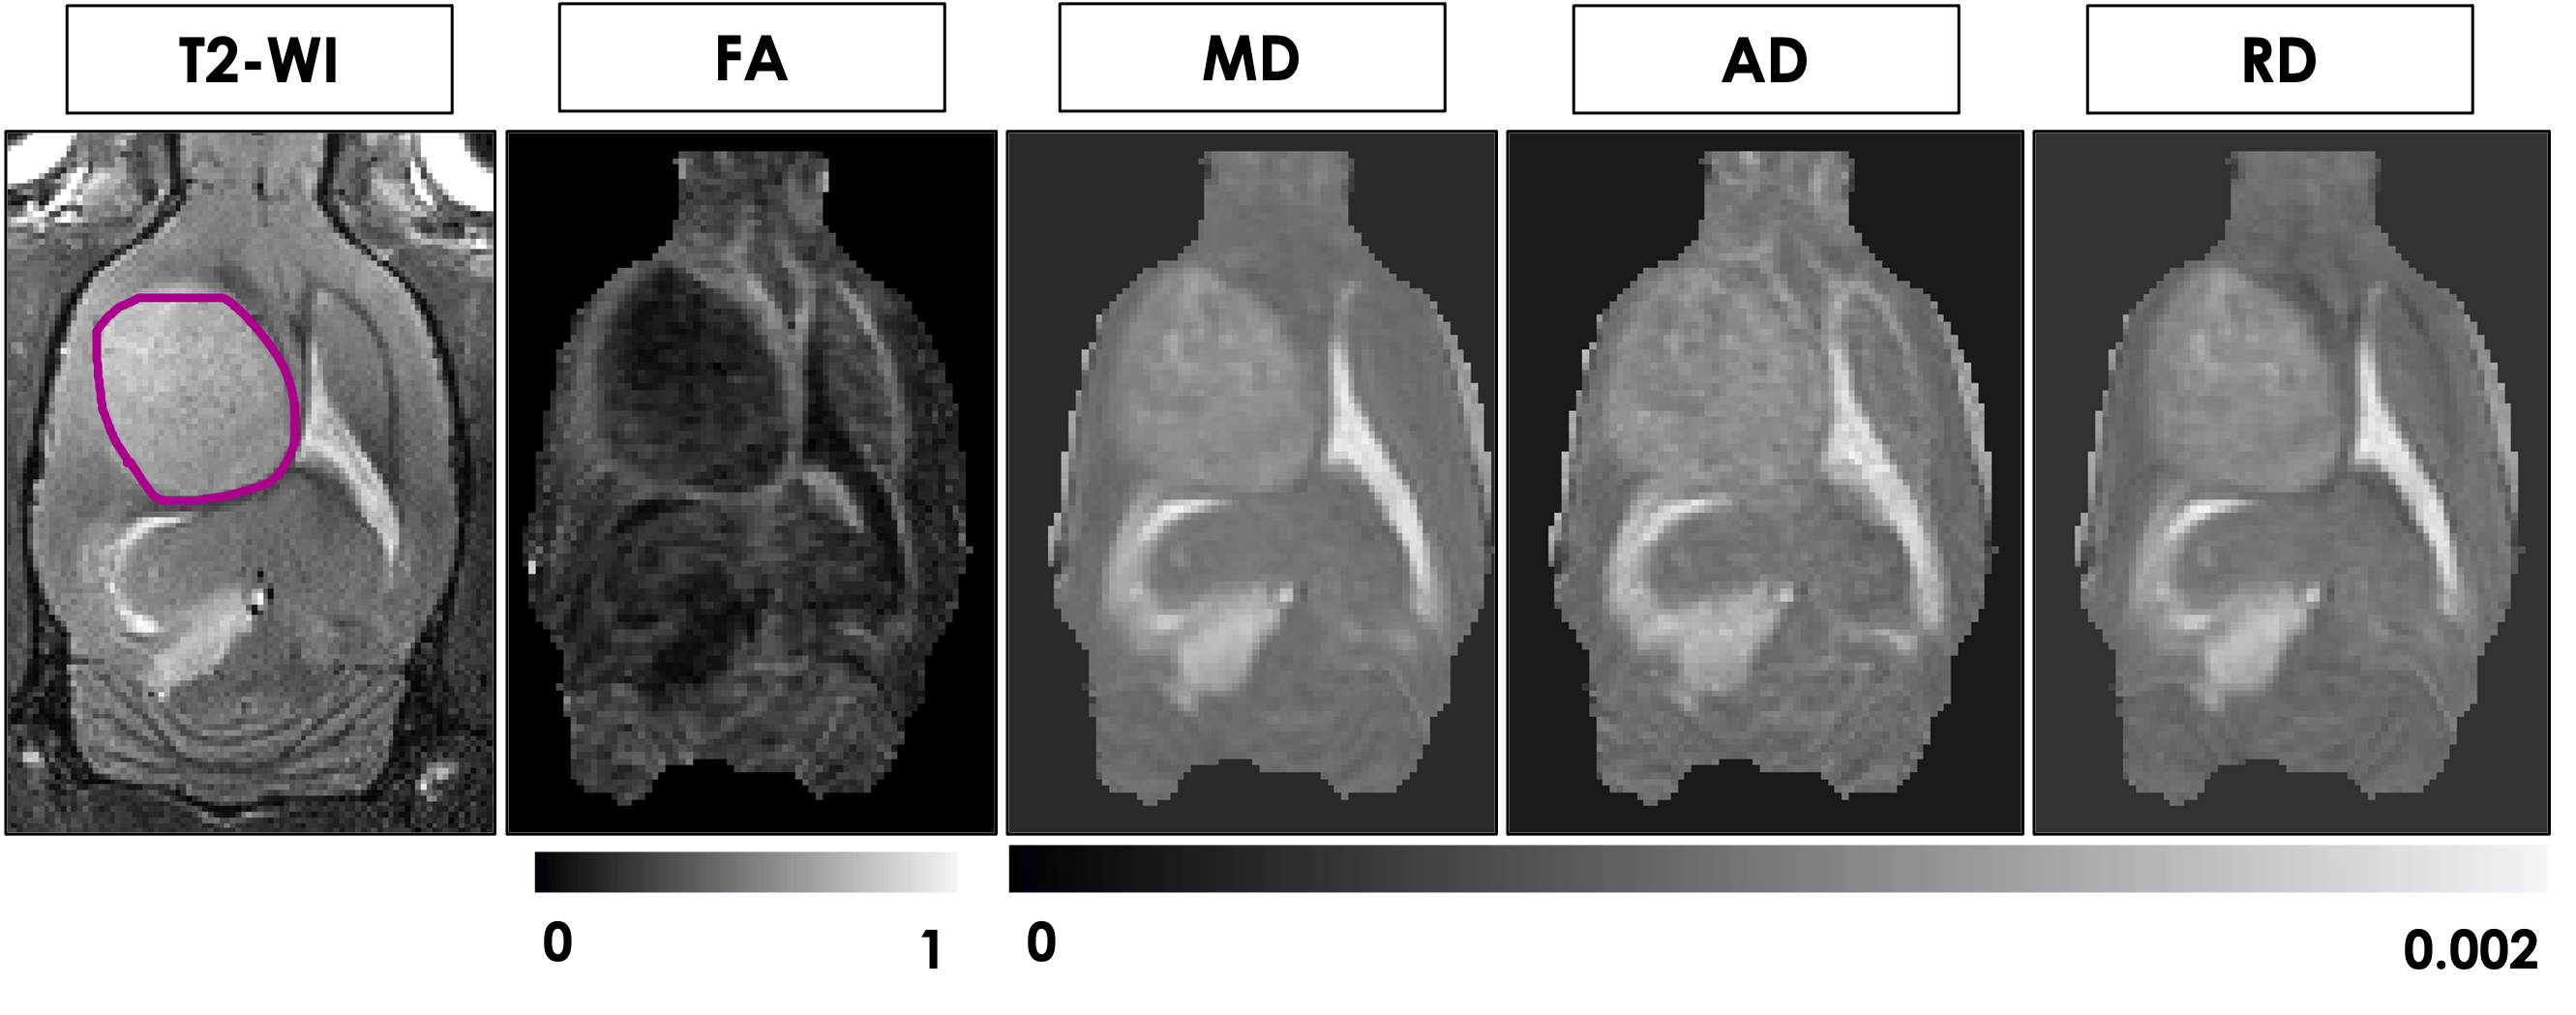
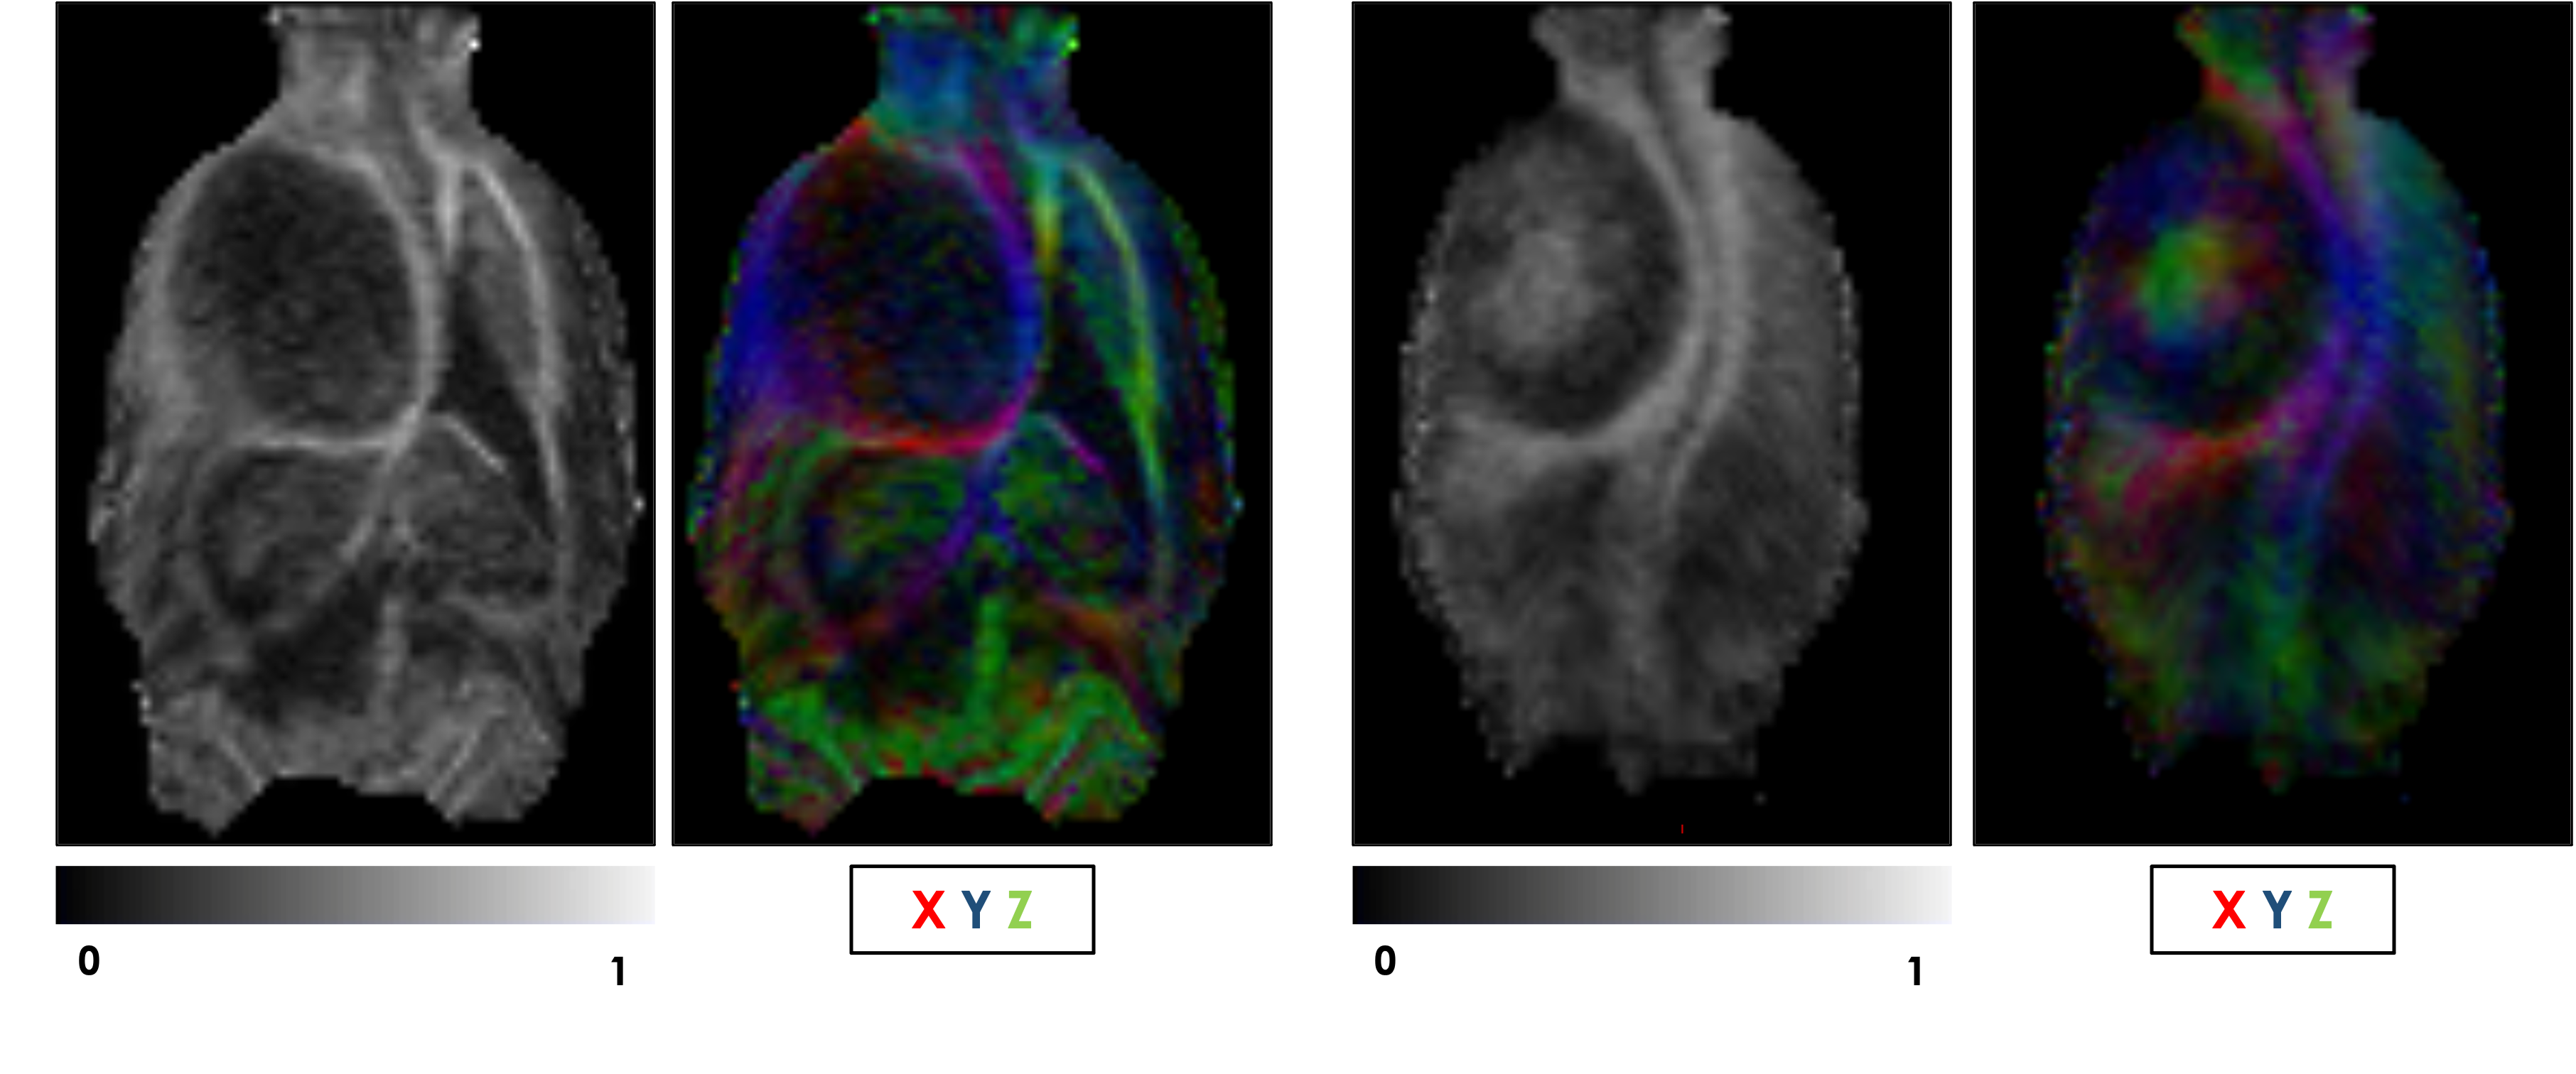
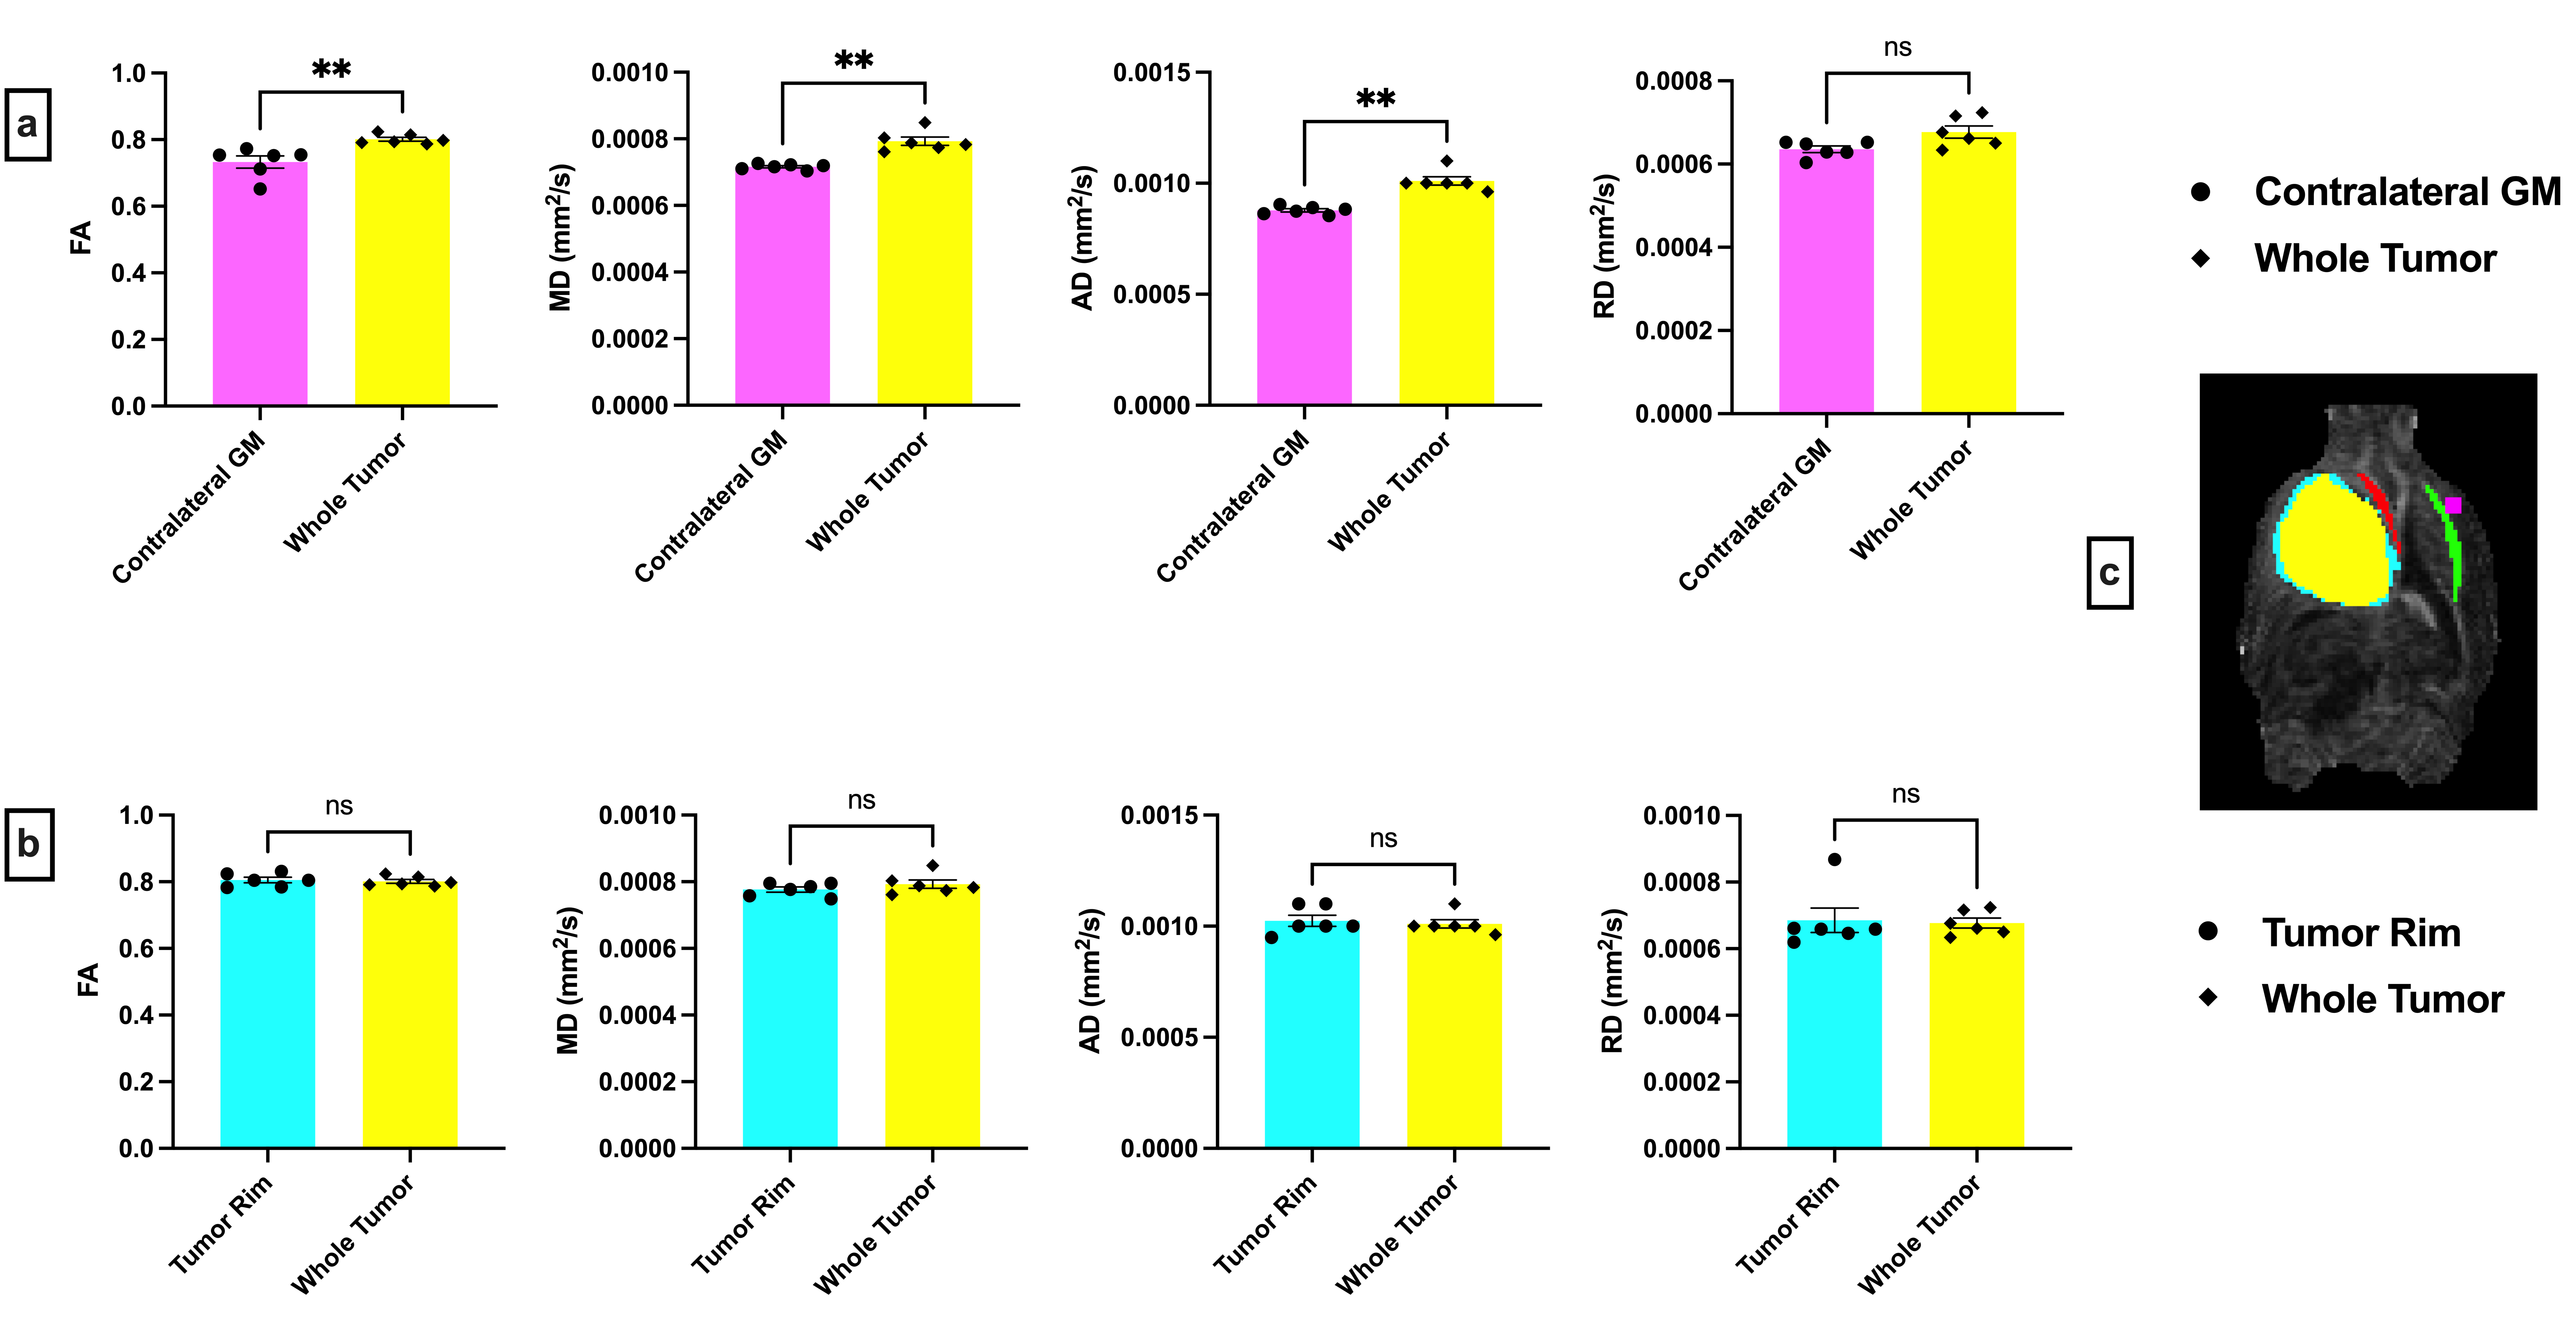
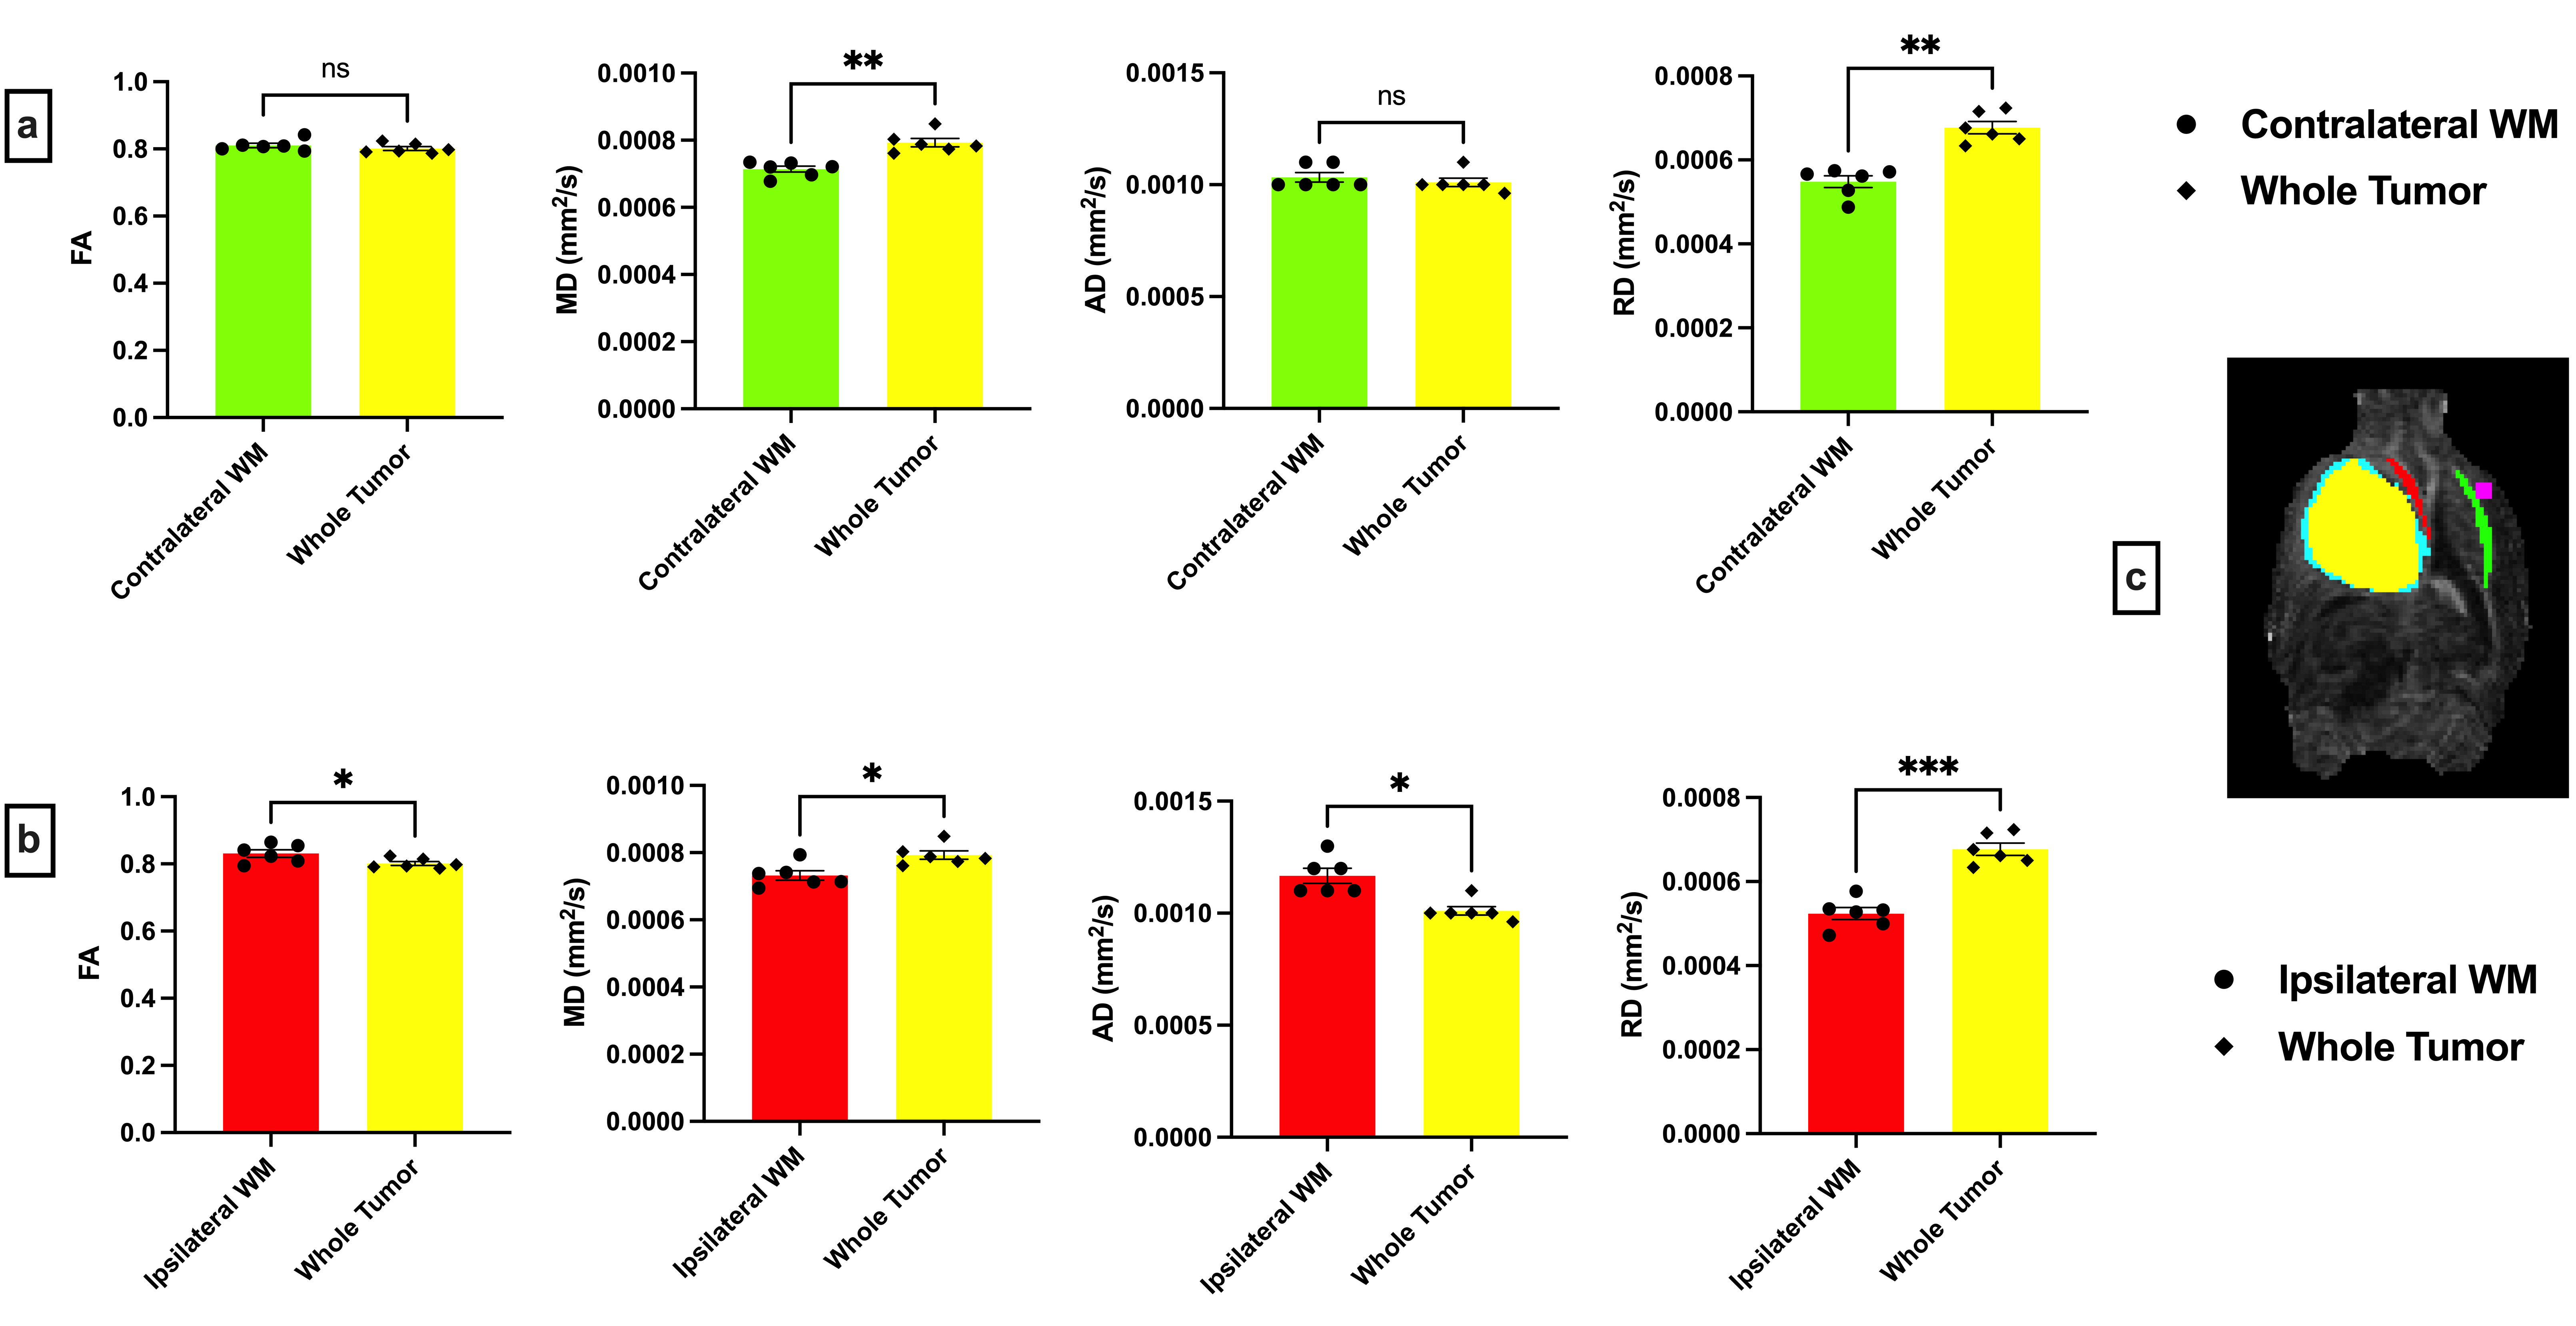
Figure 1 shows representative T2-weighted anatomical images and DTI maps (FA, MD, AD, RD) in the brain of a rat with a tumor (highlighted in purple). The DTI metric maps demonstrate contrast differences between tissue types. Heterogeneity was observed within the tumor in the FA and FA color-coded maps in two different slices (Figure 2). Figures 3 and 4 show the comparison of mean DTI indices between ROIs. In Figure 3a, significantly higher mean FA, MD, and AD values were observed in the tumor region compared to the contralateral grey matter. No differences were observed in the mean DTI indices between the tumor and the tumor rim (Figure 3b). The average MD and RD were significantly different in the tumor and contralateral WM (Figure 4a). The average FA and AD values were significantly higher in ipsilateral WM compared to the tumor. In contrast, the average MD and RD values were significantly higher in the tumor compared to ipsilateral WM (Figure 4b).Discussion and Conclusion
Diffusion metrics have not been previously measured within the C6 glioma model in rats at 9.4T. Differences in some diffusion metrics were observed between tumor tissue and brain GM and WM, which may occur due to differences in the tissue microstructure, compression due to mass effect, and cellularity.16,17 The diffusion metrics measured in the current study were generally similar to previous works on the C6,18-21 9L,4,15 and F984,15 glioma models. One difference was that previous work has shown lower FA and higher MD in tumors compared to the contralateral GM. This discrepancy may be due to differences in the ROI selection approach used in these studies. In the current study, the entire tumor was selected, including regions with the heterogeneous signal distribution.Acknowledgements
No acknowledgement found.References
1. S. Wang, E. Tryggestad, T. Zhou, M. Armour, Z. Wen, D.-X. Fu, E. Ford, P. C. van Zijl, and J. Zhou, International Journal of Radiation Oncology Biology Physics 83, e431 (2012).
2. Z. Wen, S. Hu, F. Huang, X. Wang, L. Guo, X. Quan, S. Wang, and J. Zhou, Neuroimage 51, 616 (2010).
3. J. Zhou, E. Tryggestad, Z. Wen, B. Lal, T. Zhou, R. Grossman, S. Wang, K. Yan, D.-X. Fu, E. Ford, et al., Nature medicine 17, 130 (2011).
4. J. Zhang, P. C. Van Zijl, J. Laterra, A. Salhotra, B. Lal, S. Mori, and J. Zhou, Magnetic Resonance in Medicine: An Official Journal of the International Society for Magnetic Resonance in Medicine 58, 454 (2007).
5. A. S. Field, A. L. Alexander, Y.-C. Wu, K. M. Hasan, B. Witwer, and B. Badie, Journal of Magnetic Resonance Imaging: An Official Journal of the International Society for Magnetic Resonance in Medicine 20, 555 (2004).
6. S. Sinha, M. E. Bastin, I. R. Whittle, and J. M. Wardlaw, American Journal of Neuroradiology 23, 520 (2002).
7. K. M. Gilbert, D. J. Schaeffer, J. S. Gati, L. M. Klassen, S. Everling, and R. S. Menon, Journal of Neuroscience Methods 312, 65 (2019).
8. J. Hennig, A. Nauerth, and H. Friedburg, Magnetic resonance in medicine 3, 823 (1986).
9. E. Caruyer, C. Lenglet, G. Sapiro, and R. Deriche, Magnetic resonance in medicine 69, 1534 (2013).
10. P. McCunn, K. M. Gilbert, P. Zeman, A. X. Li, M. J. Strong, A. R. Khan, and R. Bartha, PLoS One 14, e0215974 (2019).
11. P. McCunn, X. Xu, A. Moszczynski, A. Li, A. Brown, and R. Bartha, Journal of Neuroimaging 31, 879 (2021).
12. D. W. Shattuck and R. M. Leahy, Medical image analysis 6, 129 (2002).
13. N. Rahman, K. Xu, M. Omer, M. D. Budde, A. Brown, and C. A. Baron, PloS one 16, e0255711 (2021).
14. N. Rahman, J. Ramnarine, K. Xu, A. Brown, and C. A. Baron, Journal of Magnetic Resonance Imaging (2022).
15. S. Wang and J. Zhou, Journal of computer assisted tomography 36, 739 (2012).
16. T. Asanuma, S. Doblas, Y. A. Tesiram, D. Saunders, R. Cranford, J. Pearson, A. Abbott, N. Smith, and R. A. Towner, Journal of Magnetic Resonance Imaging: An Official Journal of the International Society for Magnetic Resonance in Medicine 28, 566 (2008).
17. D. Le Bihan and M. Iima, PLoS biology 13, e1002203 (2015).
18. L. J. ODonnell and C.-F. Westin, Neurosurgery Clinics 22, 185 (2011).
19. S. Lope-Piedrafita, M. L. Garcia-Martin, J.-P. Galons, R. J. Gillies, and T. P. Trouard, NMR in Biomedicine: An International Journal Devoted to the Development and Application of Magnetic Resonance In vivo 21, 799 (2008).
20. P. Haopeng, D. Xuefei, C. Zengai, Y. Zhenwei, C. Chien-Shan, and M. Zhiqiang, Academic Radiology 29, S80 (2022).
21. X.-Y. Li, J.-Q. Chen, Y.-K. Xu, and X.-J. Han, Asian Pacific journal of tropical medicine 10, 607 (2017).
Figures