5369
Using FW-DTI and VBM to identify white matter microstructural integrity and grey matter density in a preclinical model of Alzheimer’s disease1Barrow Neurological Institute, Phoenix, AZ, United States, 2Arizona State University, Tempe, AZ, United States, 3Purdue University, West Lafayette, IN, United States, 4MD Anderson Cancer center, Houston, TX, United States
Synopsis
Keywords: Data Analysis, Diffusion/other diffusion imaging techniques
The objective of this study was to assess white matter integrity and grey matter volume density in a mouse model of Alzheimer’s disease (3xTg-AD) using free-water (FW) diffusion tensor imaging (FW-DTI) and voxel-based morphometry (VBM). Additionally, histological analyses of amyloid and tau protein in different regions across the brain were examined.Introduction
Alzheimer's disease (AD) is the most common cause of dementia and affects 35 million people. Its worldwide prevalence is expected to reach 115 million by 2050 due to aging of the population1. Preclinical mouse models of AD have been developed to recapitulate phenotypical AD features, including amyloid and tau pathology, along with functional changes. Different magnetic resonance imaging (MRI) approaches can be used to detect changes associated with AD, in both preclinical models2 and human studies3.Diffusion tensor imaging (DTI) is used to evaluate white matter (WM) integrity in AD. However, single-shell DTI acquisition has several limitations, including known inaccuracies related to partial volume effects (PVEs)4. This limitation can be overcome using free-water (FW) correction algorithms, which are able to quantify and remove the contribution of extracellular FW in the DTI-related metrics5. Voxel-based morphometry (VBM) is an automated method to characterize volumetric brain changes in grey matter (GM) density6. VBM has been used to characterize patterns of brain atrophy in aging and neurodegenerative diseases, including AD7. In this study, single-shell free-water (FW) diffusion tensor imaging (FW-DTI) and VBM analysis were used to study the microstructural differences in WM and the GM density, respectively, between 3xTg-AD and wildtype (WT) mice. Additionally, the imaging results were verified with the histological analyses of amyloid and tau protein in regions across the brain.
Methods
This study included 12 WT and 11 3xTg-AD female mice. MRI data were acquired at 7 T (Bruker Biospec). Diffusion MRI was acquired with 30 directions (b=700 s/mm2) and 5 B0 images. Other scan parameters included TE=23.0 ms, TR=3000 ms, and voxel-size = (0.2×0.2×1.0) mm3. Gradient echo with flow compensation (GEFC) was acquired with TE=6.0 ms, TR=32.0 ms, flip-angle=15°, and voxel-size = (0.1×0.1×0.1) mm3.DTI pre-processing included brain extraction (AFNI8), alignment and eddy current correction (FSL9). FW-corrected fractional anisotropy (FW-FA) and FW index were computed by an in-house MATLAB script. Using the Advanced Normalization Tools (ANTs10), a B0 group-wise template was created, and all FW-FA and FW images were coregistered to this template by an ANTs non-linear coregistration algorithm.
GEFC images were corrected for bias (AFNI) and brain extracted (atlasBREX11) and were subsequently used to create a group-wise template for VBM analysis. Then, all pre-processed GEFC images were coregistered to this template and the FMRIB's Automated Segmentation Tool (fast)12 was used to segment the images in template space to create the GM mask. Modulation for the contraction and enlargement resulting from the nonlinear component of the transformation was obtained by multiplying the GM tissue images by the Jacobian of the warp field. The final GM-VBM images (in the group-template space) were smoothed using the FMRIB Software Library (FSL).
A two-sample t-test was conducted by an in-house R script to compare FW-DTI and VBM metrics between 3xTg-AD and WT mice at the voxel-wise level. Statistical significance was considered at p<0.05 (with the threshold-free cluster enhancement) after correction for multiple comparisons (FWE). Effect-size was calculated by an in-house R script (large effect: g>1.58). All DTI and VBM statistics were performed in the respective group-template space.
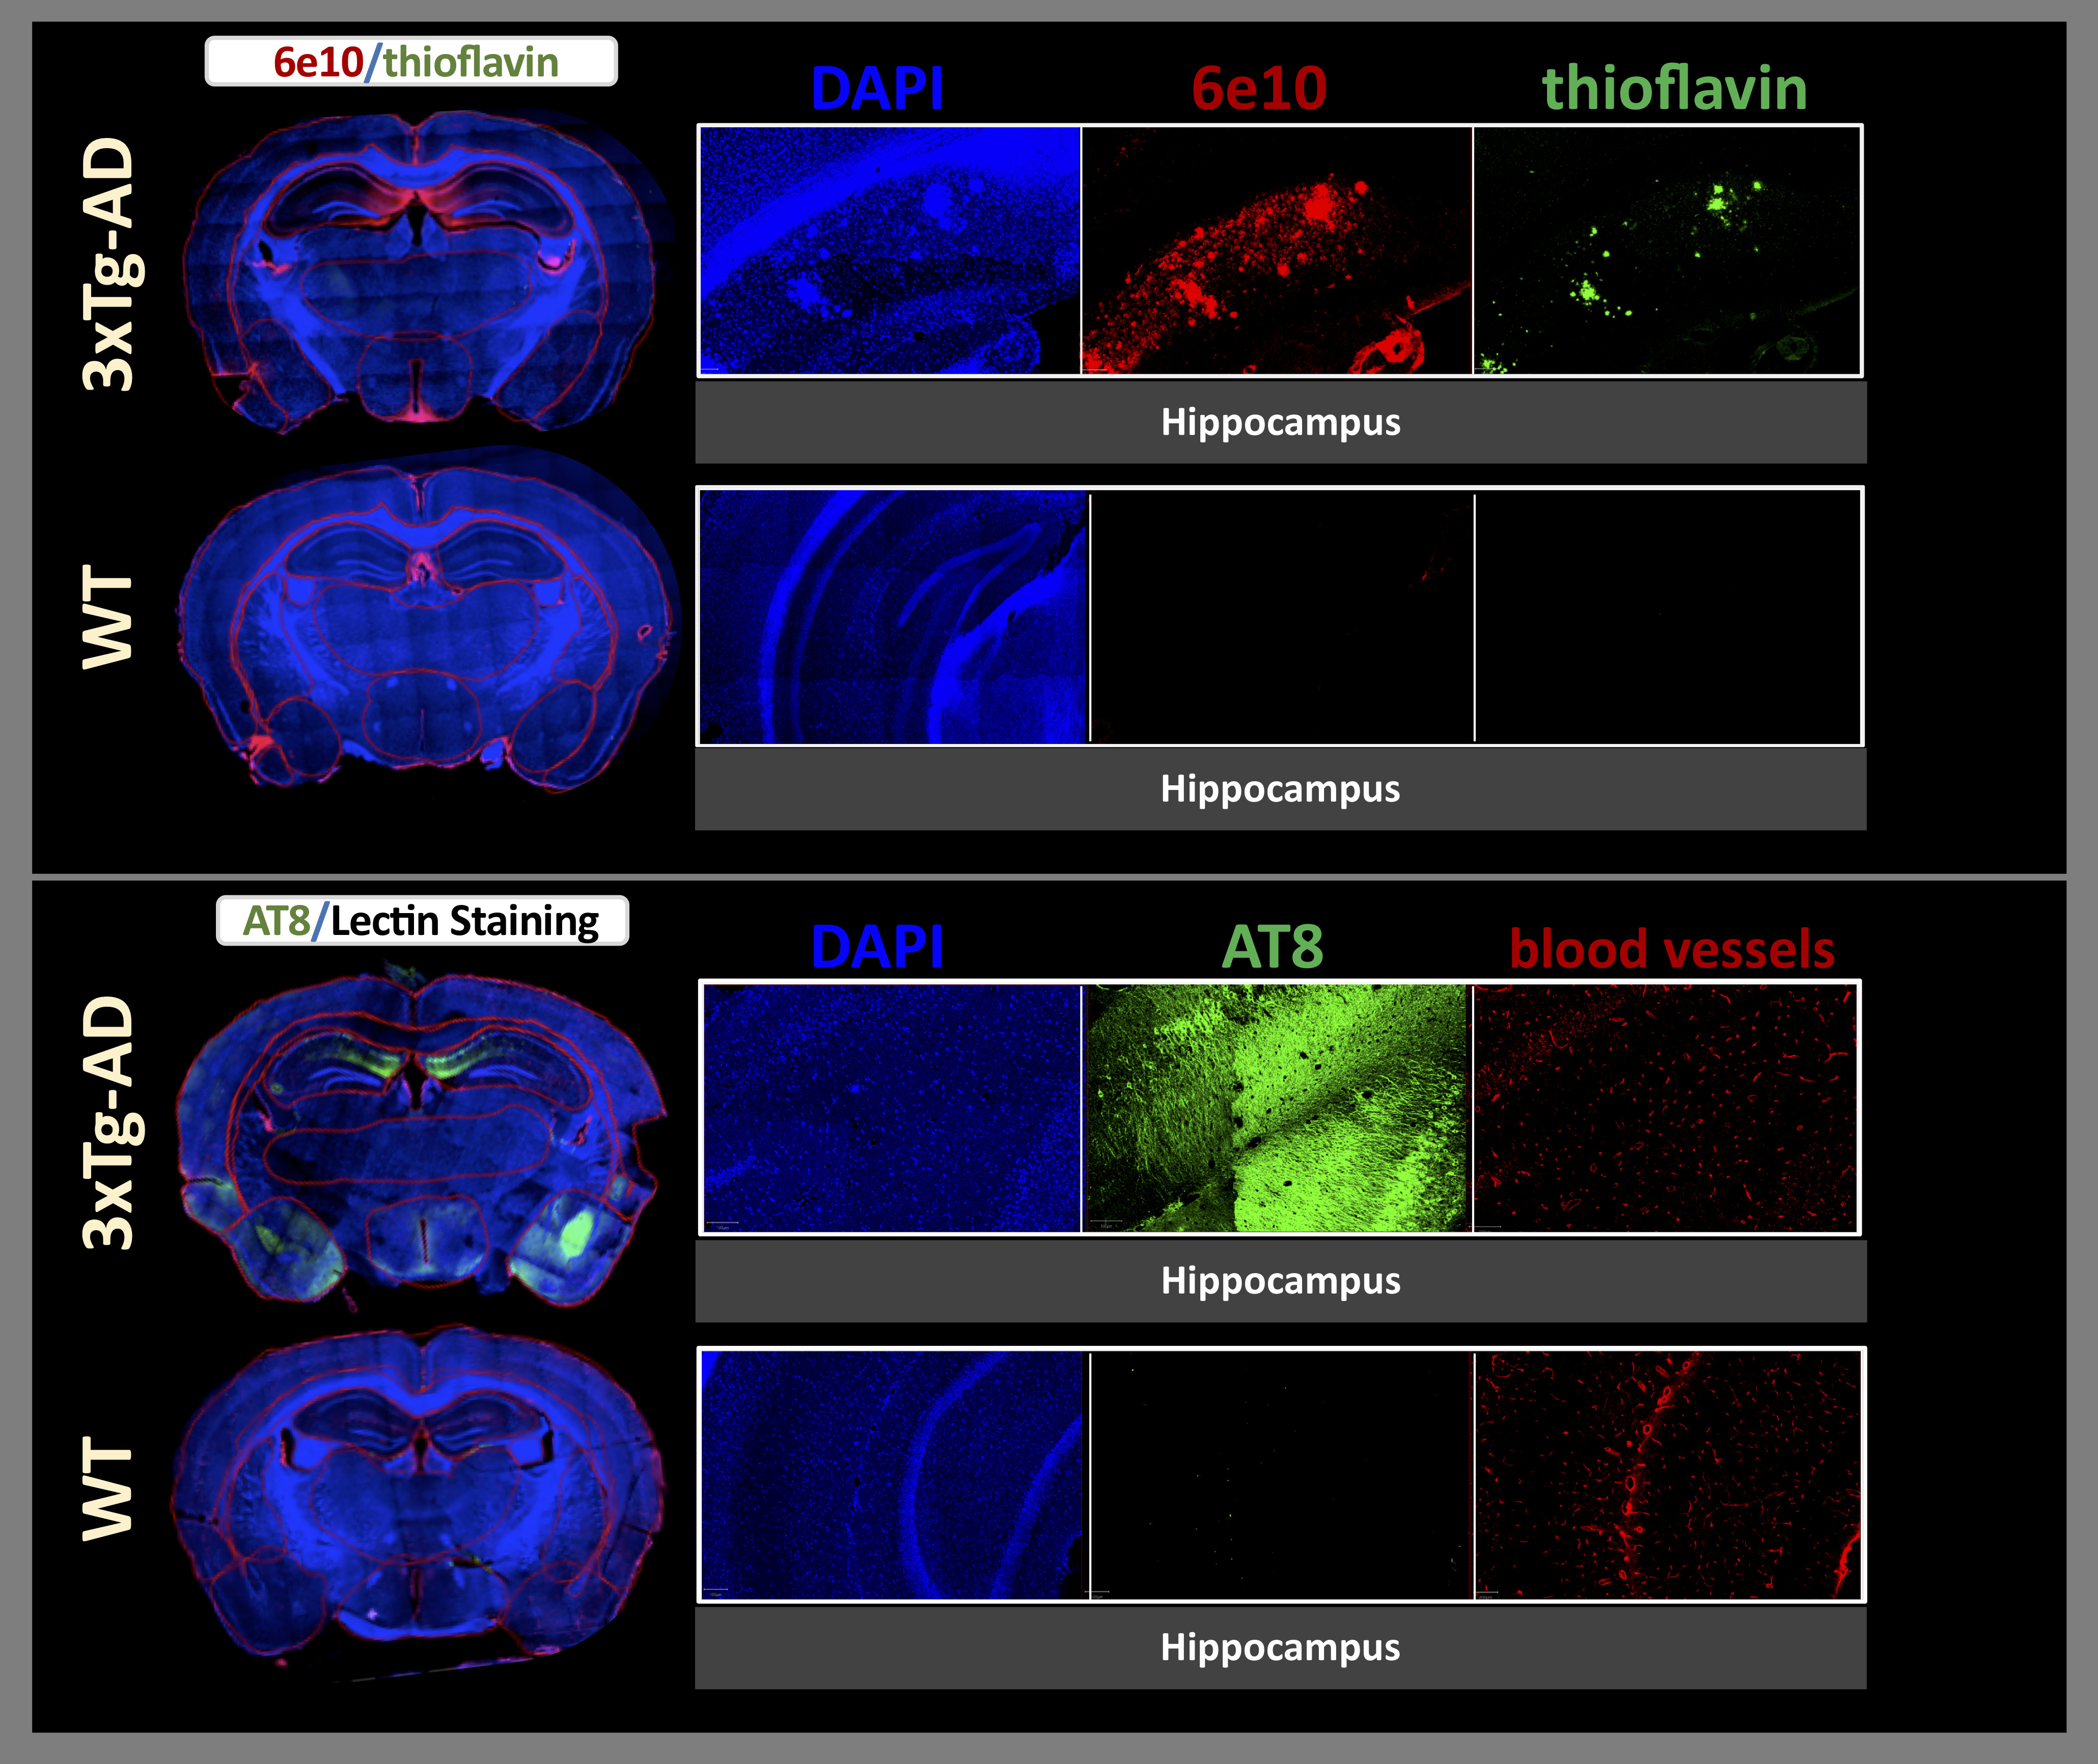
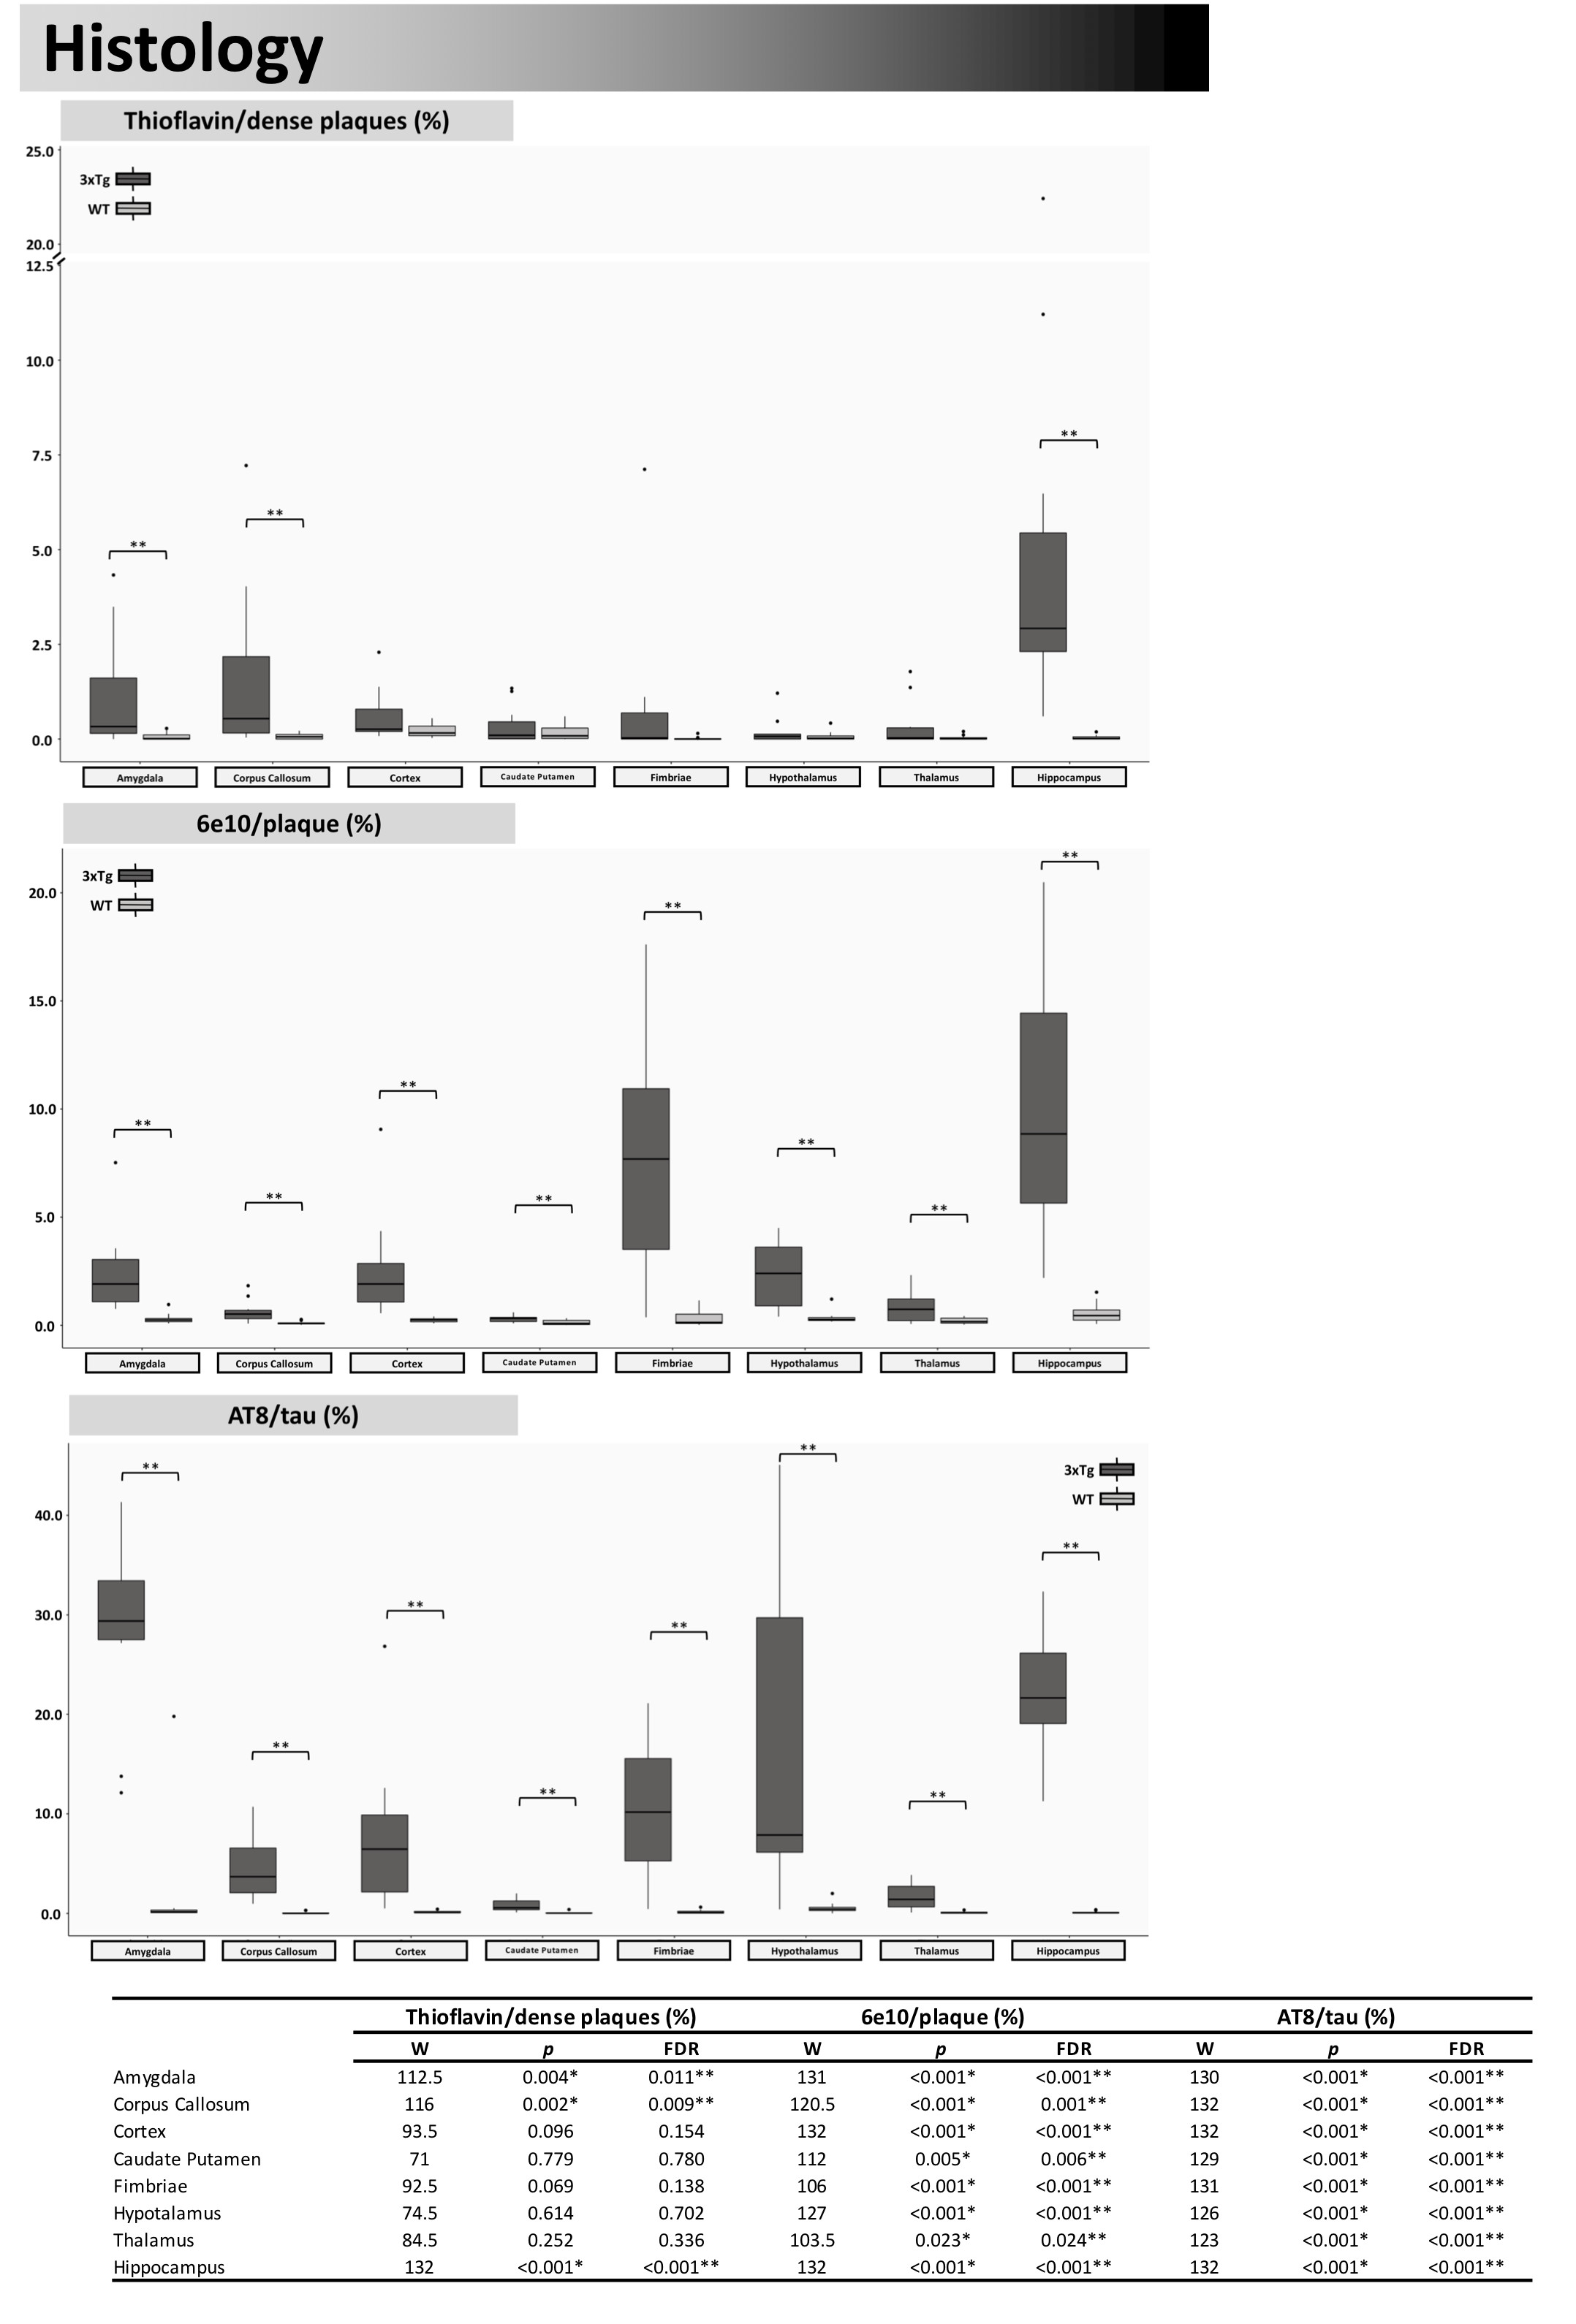
All animals were sacrificed after imaging, and histology was performed to visualize phosphorylated tau protein (AT8 staining)13 and both diffuse (6e10 staining) and dense (thioflavin staining) amyloid-beta plaques14. Microscopy images were imported to QuPath (V0.3.0)15 for analysis. Differences between groups were analyzed by the Mann-Whitney-Wilcoxon Test with FDR corrections for multiple comparisons.
Results
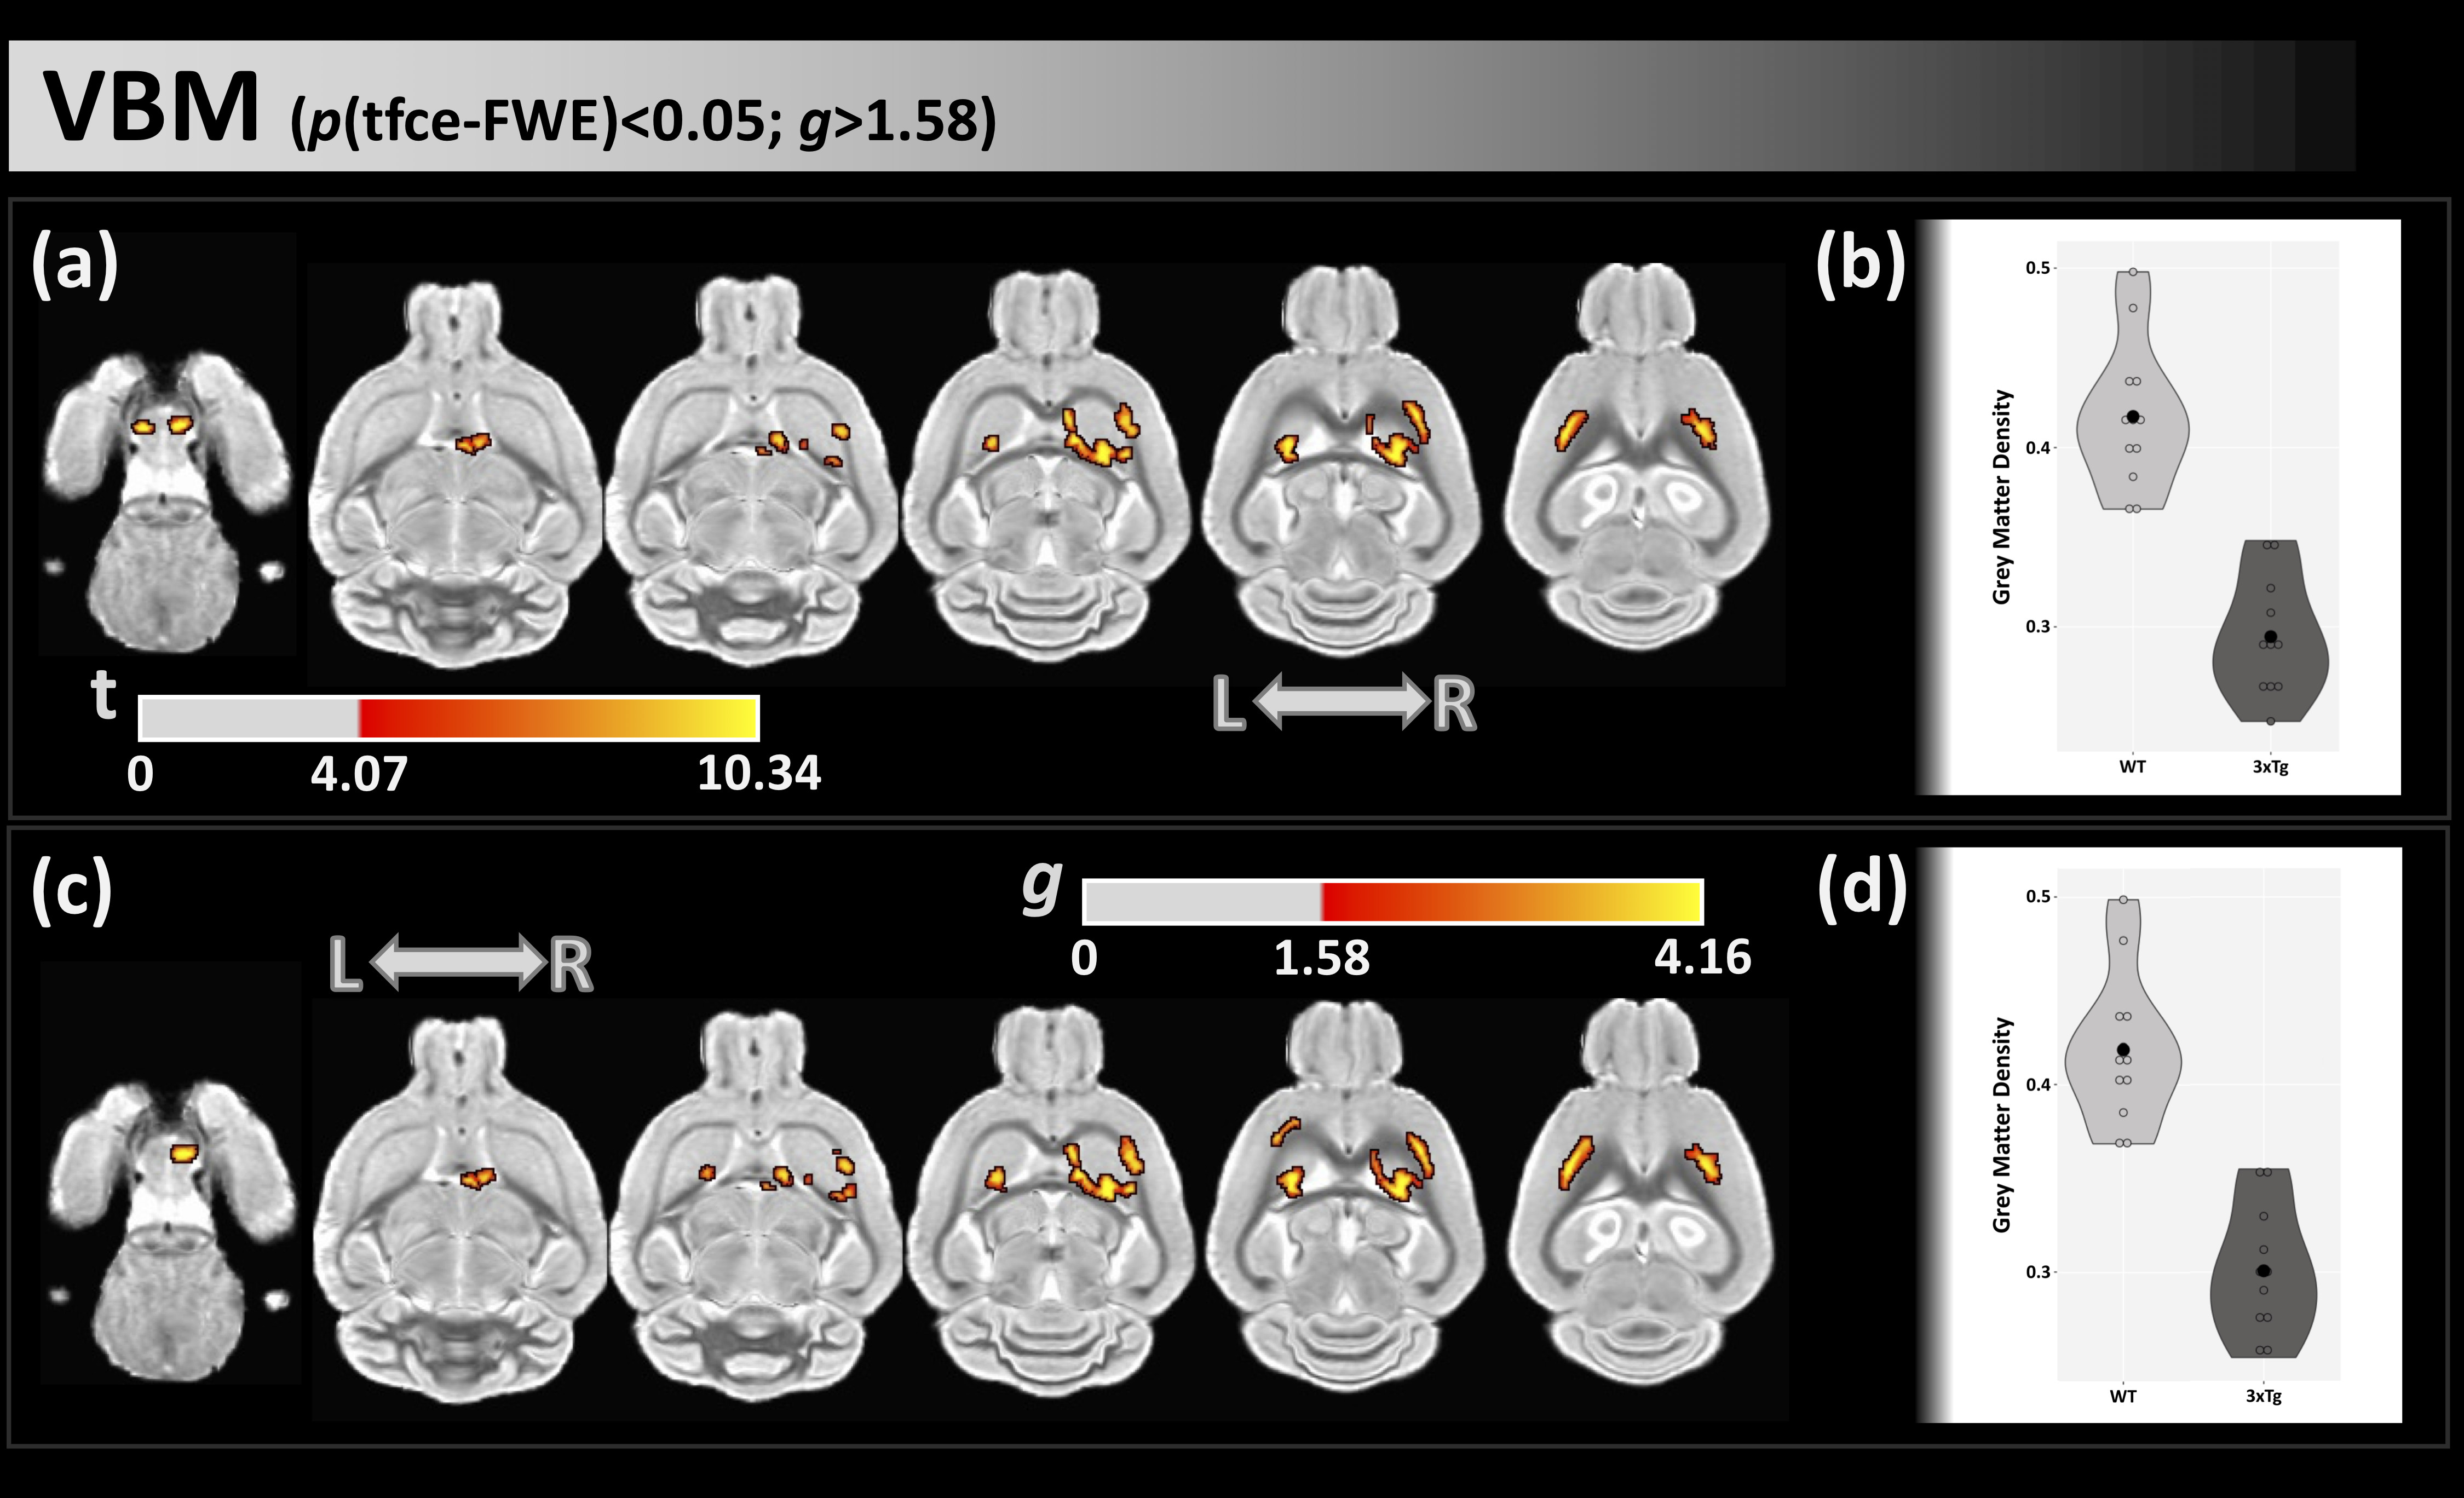
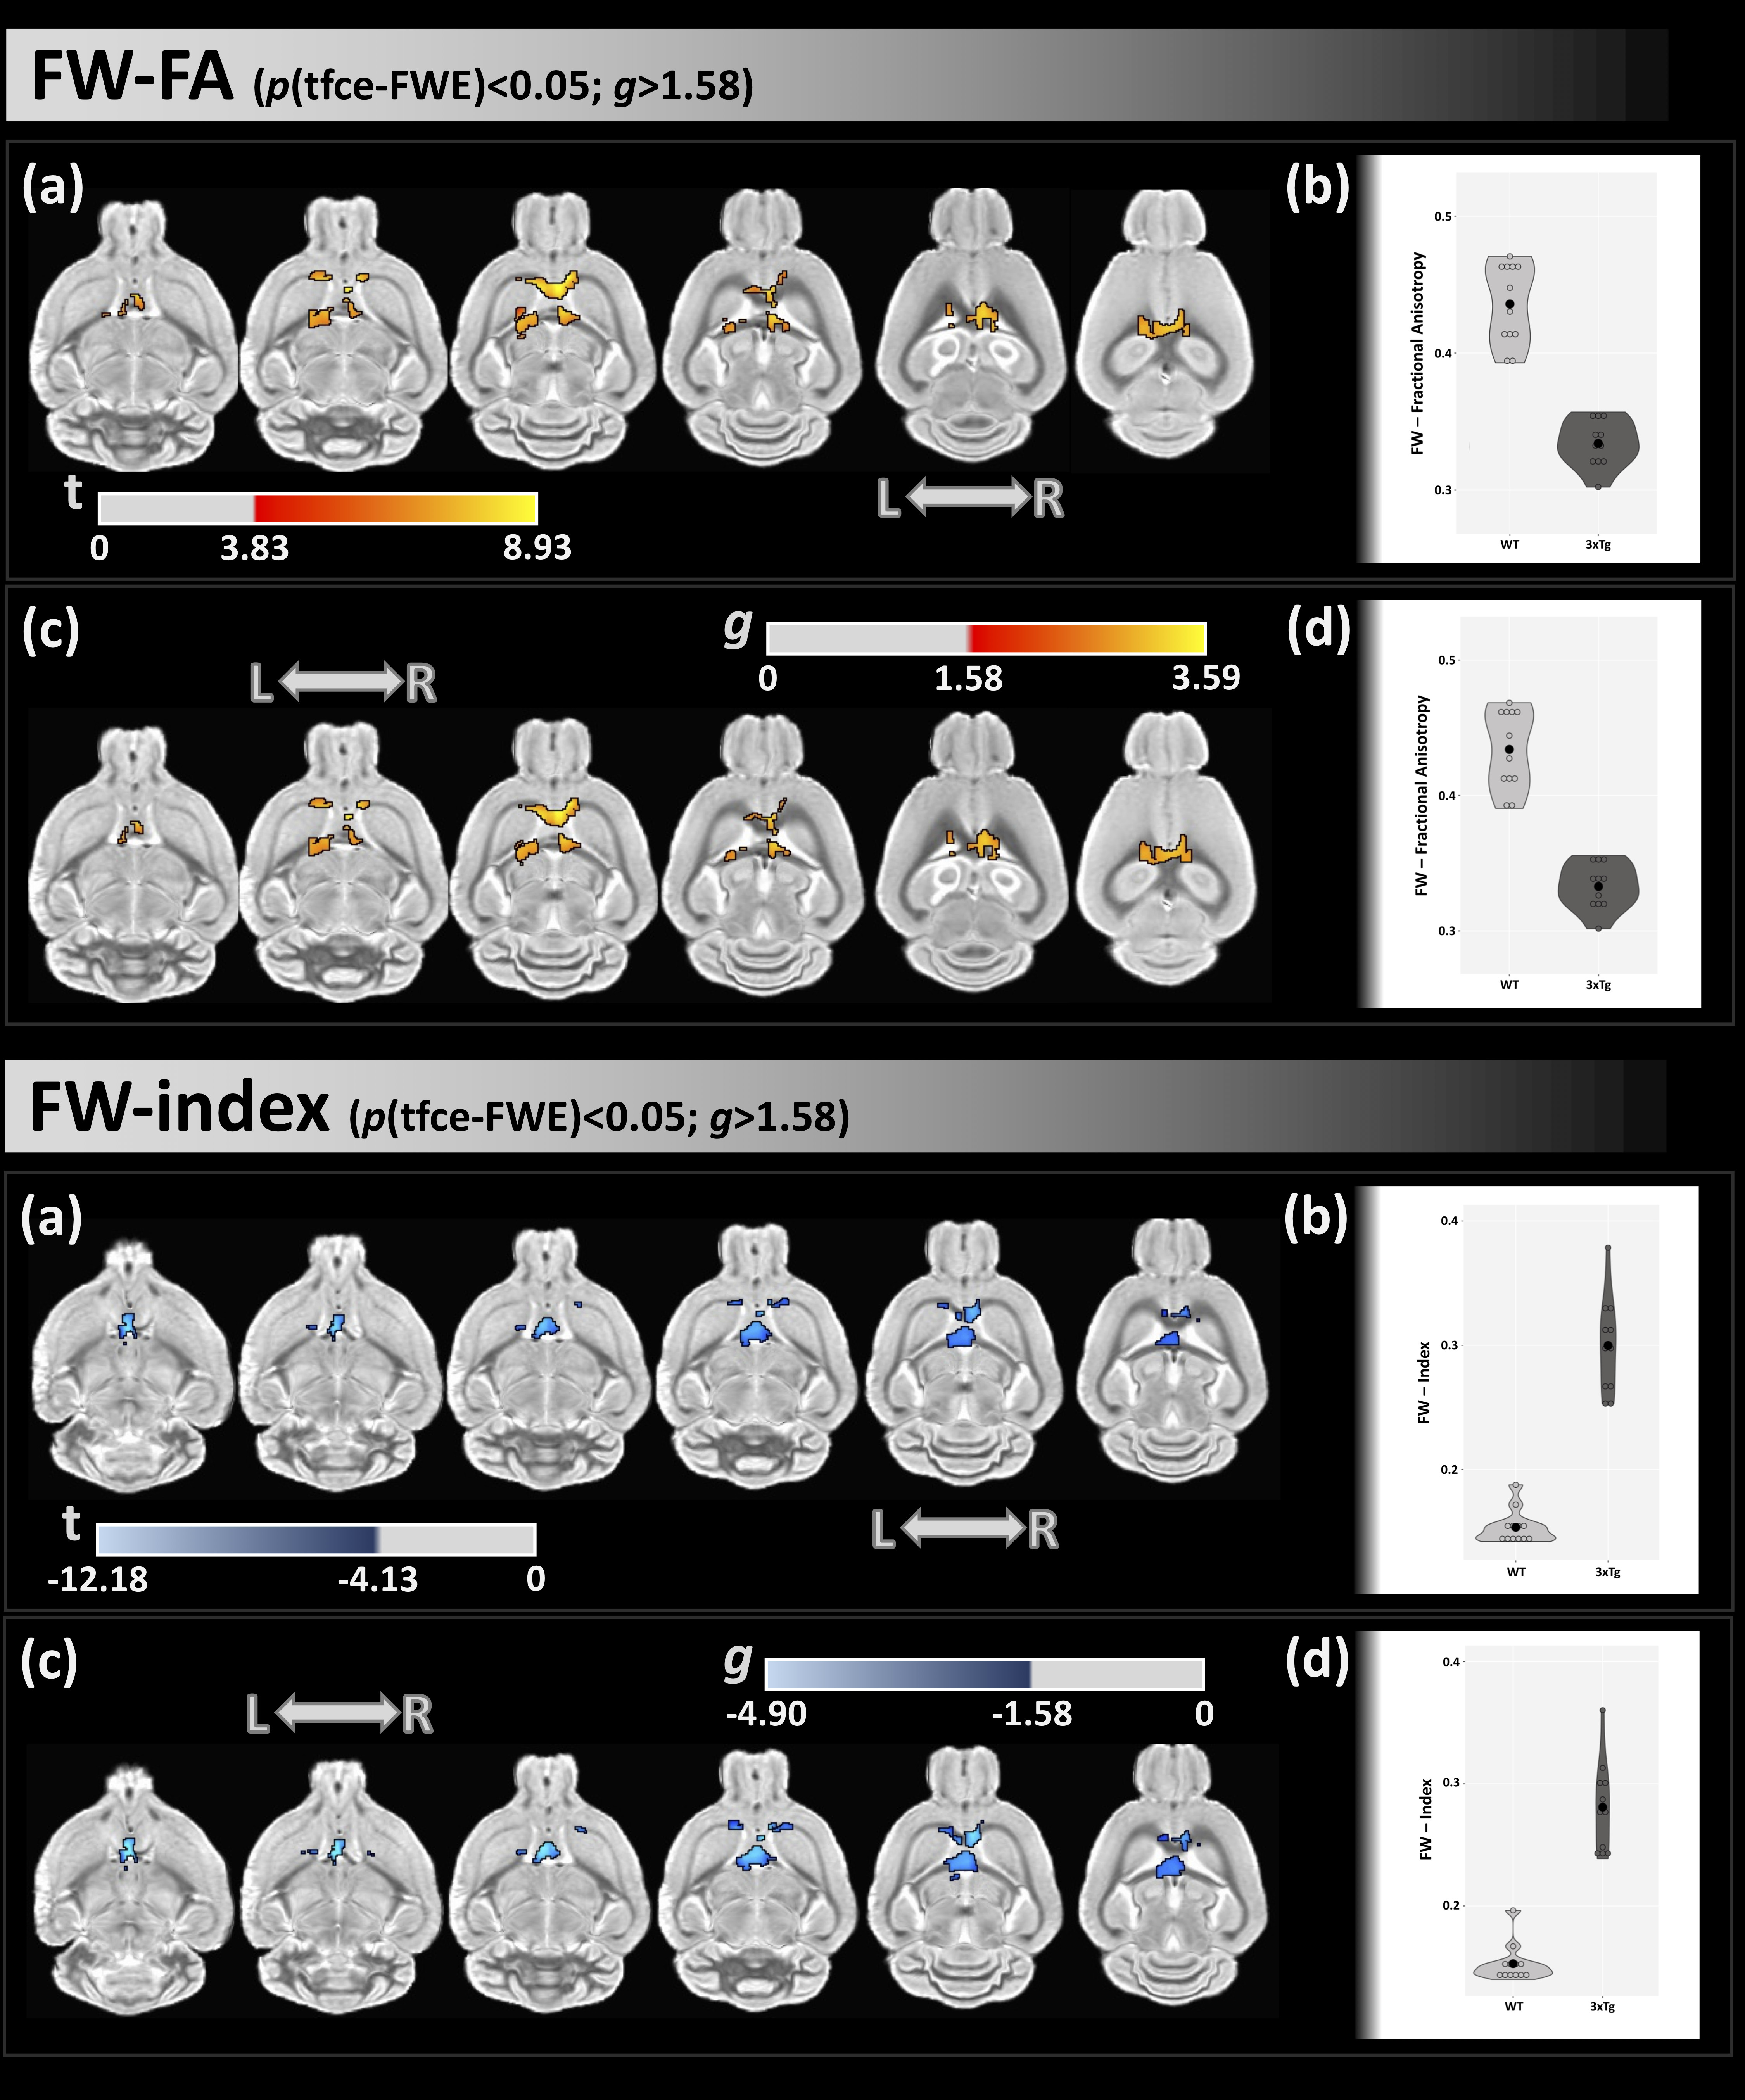
From VBM with both FWE and effect-size analyses, we found lower GM density in 3xTg-AD mice than WT in the caudate-putamen, cortex, and hypothalamus (Figure 1).From FW-DTI, compared with WT group, 3xTg-AD mice displayed lower FW-FA and higher FW index in several WM areas, included the corpus callosum, fimbria, and forebrain septum (Figure 2).
On histopathology, the 3xTg-AD mice were associated with higher AT8 and 6e10 in all regions, compared to WT mice. In the AD mice, significant increases in thioflavin were also found in the amygdala, corpus callosum, and hippocampus (Figures 3 and 4).
Discussion
In this study, microstructural differences were observed in several WM areas between the 3xTg-AD and WT groups. 3xTg-AD mice showed lower FW-FA values and higher FW index in WM locations that included the corpus callosum and fimbria, which is indicative of WM neurodegeneration in dementia16. Additionally, compared with WT group, 3xTg-AD exhibited lower GM density, indicative of GM atrophy, in several areas, such as the hypothalamus, caudate-putamen, and cortex17. These WM and GM regions have been found to be also associated with high levels of AD pathology inside the 3xTg-AD group (i.e., tau and amyloid).Conclusions
In conclusion, FW-DTI, which can overcome DTI limitations related to PVEs, and VBM, which can analyze GM density in the brain, detected WM microstructural and GM density differences between 3xTg-AD and WT groups. These findings suggest that microstructural dysfunction in AD may be associated with amyloid and tau pathology.Acknowledgements
Arizona Alzheimer’s consortium and Barrow neurological foundationReferences
1. Prince, M. J. & Jackson, L. [http://www.alz.co.uk/research/files/WorldAlzheimerReport.pdf.] . World Alzheimer Report (2009).
2. Wei, Z. et al. Brain metabolism in tau and amyloid mouse models of Alzheimer’s disease: An MRI study. NMR Biomed 34, e4568 (2021).
3. Chandra, A., Dervenoulas, G., Politis, M. & Alzheimer’s Disease Neuroimaging Initiative. Magnetic resonance imaging in Alzheimer’s disease and mild cognitive impairment. J Neurol 266, 1293–1302 (2019).
4. Pierpaoli, C., Jezzard, P., Basser, P. J., Barnett, A. & di Chiro, G. Diffusion tensor MR imaging of the human brain. Radiology 201, 637–48 (1996).
5. Pasternak, O., Sochen, N., Gur, Y., Intrator, N. & Assaf, Y. Free water elimination and mapping from diffusion MRI. Magn Reson Med 62, 717–30 (2009).
6. Ashburner, J. & Friston, K. J. Voxel-based morphometry--the methods. Neuroimage 11, 805–21 (2000).
7. Bergamino, M. et al. Preliminary Assessment of Intravoxel Incoherent Motion Diffusion-Weighted MRI (IVIM-DWI) Metrics in Alzheimer’s Disease. J Magn Reson Imaging 52, 1811–1826 (2020).
8. https://afni.nimh.nih.gov.
9. Jenkinson, M., Beckmann, C. F., Behrens, T. E., Woolrich, M. W. & Smith, S. M. FSL 1. Neuroimage 62, (2012).
10. http://stnava.github.io/ANTs/.
11. Lohmeier, J., Kaneko, T., Hamm, B., Makowski, M. R. & Okano, H. atlasBREX: Automated template-derived brain extraction in animal MRI. Sci Rep 9, 12219 (2019).
12. Zhang, Y., Brady, M. & Smith, S. Segmentation of brain MR images through a hidden Markov random field model and the expectation-maximization algorithm. IEEE Trans Med Imaging 20, 45–57 (2001).
13. Wegmann, S., Biernat, J. & Mandelkow, E. A current view on Tau protein phosphorylation in Alzheimer’s disease. Curr Opin Neurobiol 69, 131–138 (2021).
14. Shi, X.-Z., Wei, X., Sha, L.-Z. & Xu, Q. Comparison of β-Amyloid Plaque Labeling Methods: Antibody Staining, Gallyas Silver Staining, and Thioflavin-S Staining. Chin Med Sci J 33, 167–173 (2018).
15. https://github.com/qupath/qupath.
16. Preti, M. G. et al. Assessing corpus callosum changes in Alzheimer’s disease: comparison between tract-based spatial statistics and atlas-based tractography. PLoS One 7, e35856 (2012).
17. Whitwell, J. L. et al. Focal atrophy in dementia with Lewy bodies on MRI: a distinct pattern from Alzheimer’s disease. Brain 130, 708–19 (2007).
Figures