5368
Elevated blood flow and amide proton transfer weighted signal in diabetic foot: a novel clinical research using non-contrast imaging
Shan Lu1, Shiyu Zhao1, Xueyan Song1, Guangyang Ma1, Zhiwei Shen2, and Baocheng Chang*1
1Metabolic Diseases Hospital of Tianjin Medical University, Tianjin, China, 2Philips Healthcare, Beijing, China
1Metabolic Diseases Hospital of Tianjin Medical University, Tianjin, China, 2Philips Healthcare, Beijing, China
Synopsis
Keywords: Muscle, Infection
For the first time, DF infection was analyzed using ASL and APTw imaging, and high BF and MTRasym (3.5 ppm) may be used as a novel biomarker in DF course monitoring and treatment option evaluation. ASL and APTw imaging in DF may be a safe and convenient approach for individuals with renal insufficiency because to its non-contrast injection.Introduction
Diabetic foot (DF) is a lower extremity infection, ulceration, and/or deep tissue damage caused by neuropathy and varying degrees of vascular dysfunction in diabetic people. It is one of the most dangerous consequences of type 2 diabetes (DM). However, quantitative clinical approaches for evaluating blood flow and protein-weighted information with non-contrast injection in DF patients with renal insufficiency are lacking. The purpose of this study was to investigate the feasibility of ASL and APTw imaging in DF, as well as to quantify the possible abnormal blood flow rate and changes in tissue protein in DF foot lesions.Method
The DF group consisted of 43 patients (33 men and 10 females, aged 2774 years, with an average age of 58.14 11.99 years) diagnosed with DF. The control group consisted of 34 healthy volunteers (22 males and 12 females, ages 3167 years, with an average age of 53.79 8.71 years) who did not have diabetes or lower limb artery disease.All participants had their feet MRIs in a 3.0T MR scanner (Philips Ingenia CX, Best, Netherlands). Two ds Flex coils are placed in parallel and fixed on both sides of the foot after the patient lies supine with the feet advanced. First, sagittal and axial T1-weighted, sagittal T2-weighted, and coronal PD-weighted imaging with fat suppression, as well as coronal DWI, were conducted. The FFE-EPI sequence was then used to acquire Axial ASL images with two Post Label Delay (PLD) periods of 1450 ms and 1600 ms. Finally, a sagittal APTw sequence based on a 3D modified Dixon-TSE sequence with a saturation power of 1 ut and a saturation period of 1.8 s was performed.
Following the MR examination, all images were transmitted to a workstation for data post-processing (Intelli-SpacePortal Version 9.0, Philips Healthcare). ISP workstation automatically computed BF1450, BF1600, and MTRasym (3.5 ppm). Two radiologists with extensive diagnostic expertise (>5 years) measured and examined the data.
The region of interest (ROI) on the APT map was manually outlined using DWI images to include the lesion at the slice with the highest signal intensity in DWI images and to avoid the region with extremely high or low MTRasym (3.5 ppm) due to B0 or B1 inhomogeneity.To acquire a normalized MTRasym (3.5 ppm), a ROI of muscle adjacent to the lesion area was also drawn(Figure 1, 2). On ASL images, a circle-shaped ROI with an area of about 6 cm2 was manually drawn on the first toe metatarsal joint level of both planters. (Figure 3)
The ROI's BF and MTRasym mean values (3.5 ppm) were calculated. MTRasym (3.5 ppm) was determined using the following formulae on an MRI console: MTRasym(3.5 ppm) = Msat (3.5 ppm)/M0 - Msat (+3.5 ppm)/M0. To eliminate the influence from individual variations and B1 inhomogeneity, normalized MTRasym (3.5 ppm) was computed as the ratio of APTw signal intensity on the lesion to those on the muscle close to the lesion area.
Results
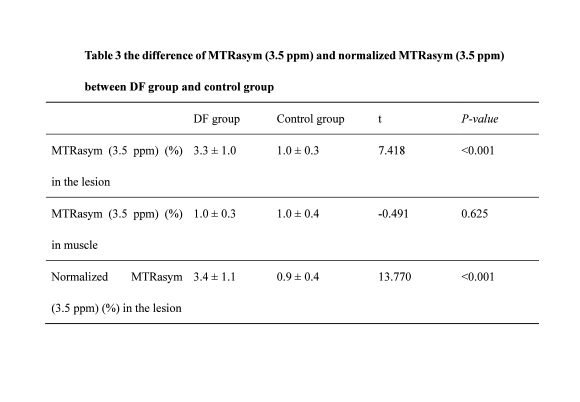
Significantly higher BF1450 and BF1600 values were found in the lesion of the affected foot in the DF group than in the healthy tissue in the DF group and the control group with statistical difference (Figure 4). Meanwhile, the BF1600 level of the healthy foot in the DF group was considerably greater than that of the control group, with no significant difference between the DF group and the control group in the BF1450 level of healthy feet.Higher MTRasym (3.5 ppm) and normalized MTRasym (3.5 ppm) in the lesion of the DF group were found. The MTRasym (3.5 ppm) changes of the DF group and the control group are shown in Table 1.
Conclusion
The feasibility of using ASL and APTw in DF is proven in this study, and higher blood flow and MTRasym (3.5 ppm) of the afflicted foot in the DF patient were seen when compared to the control group and the contralateral side foot in the DF patient.Acknowledgements
No acknowledgement found.References
No reference found.Figures
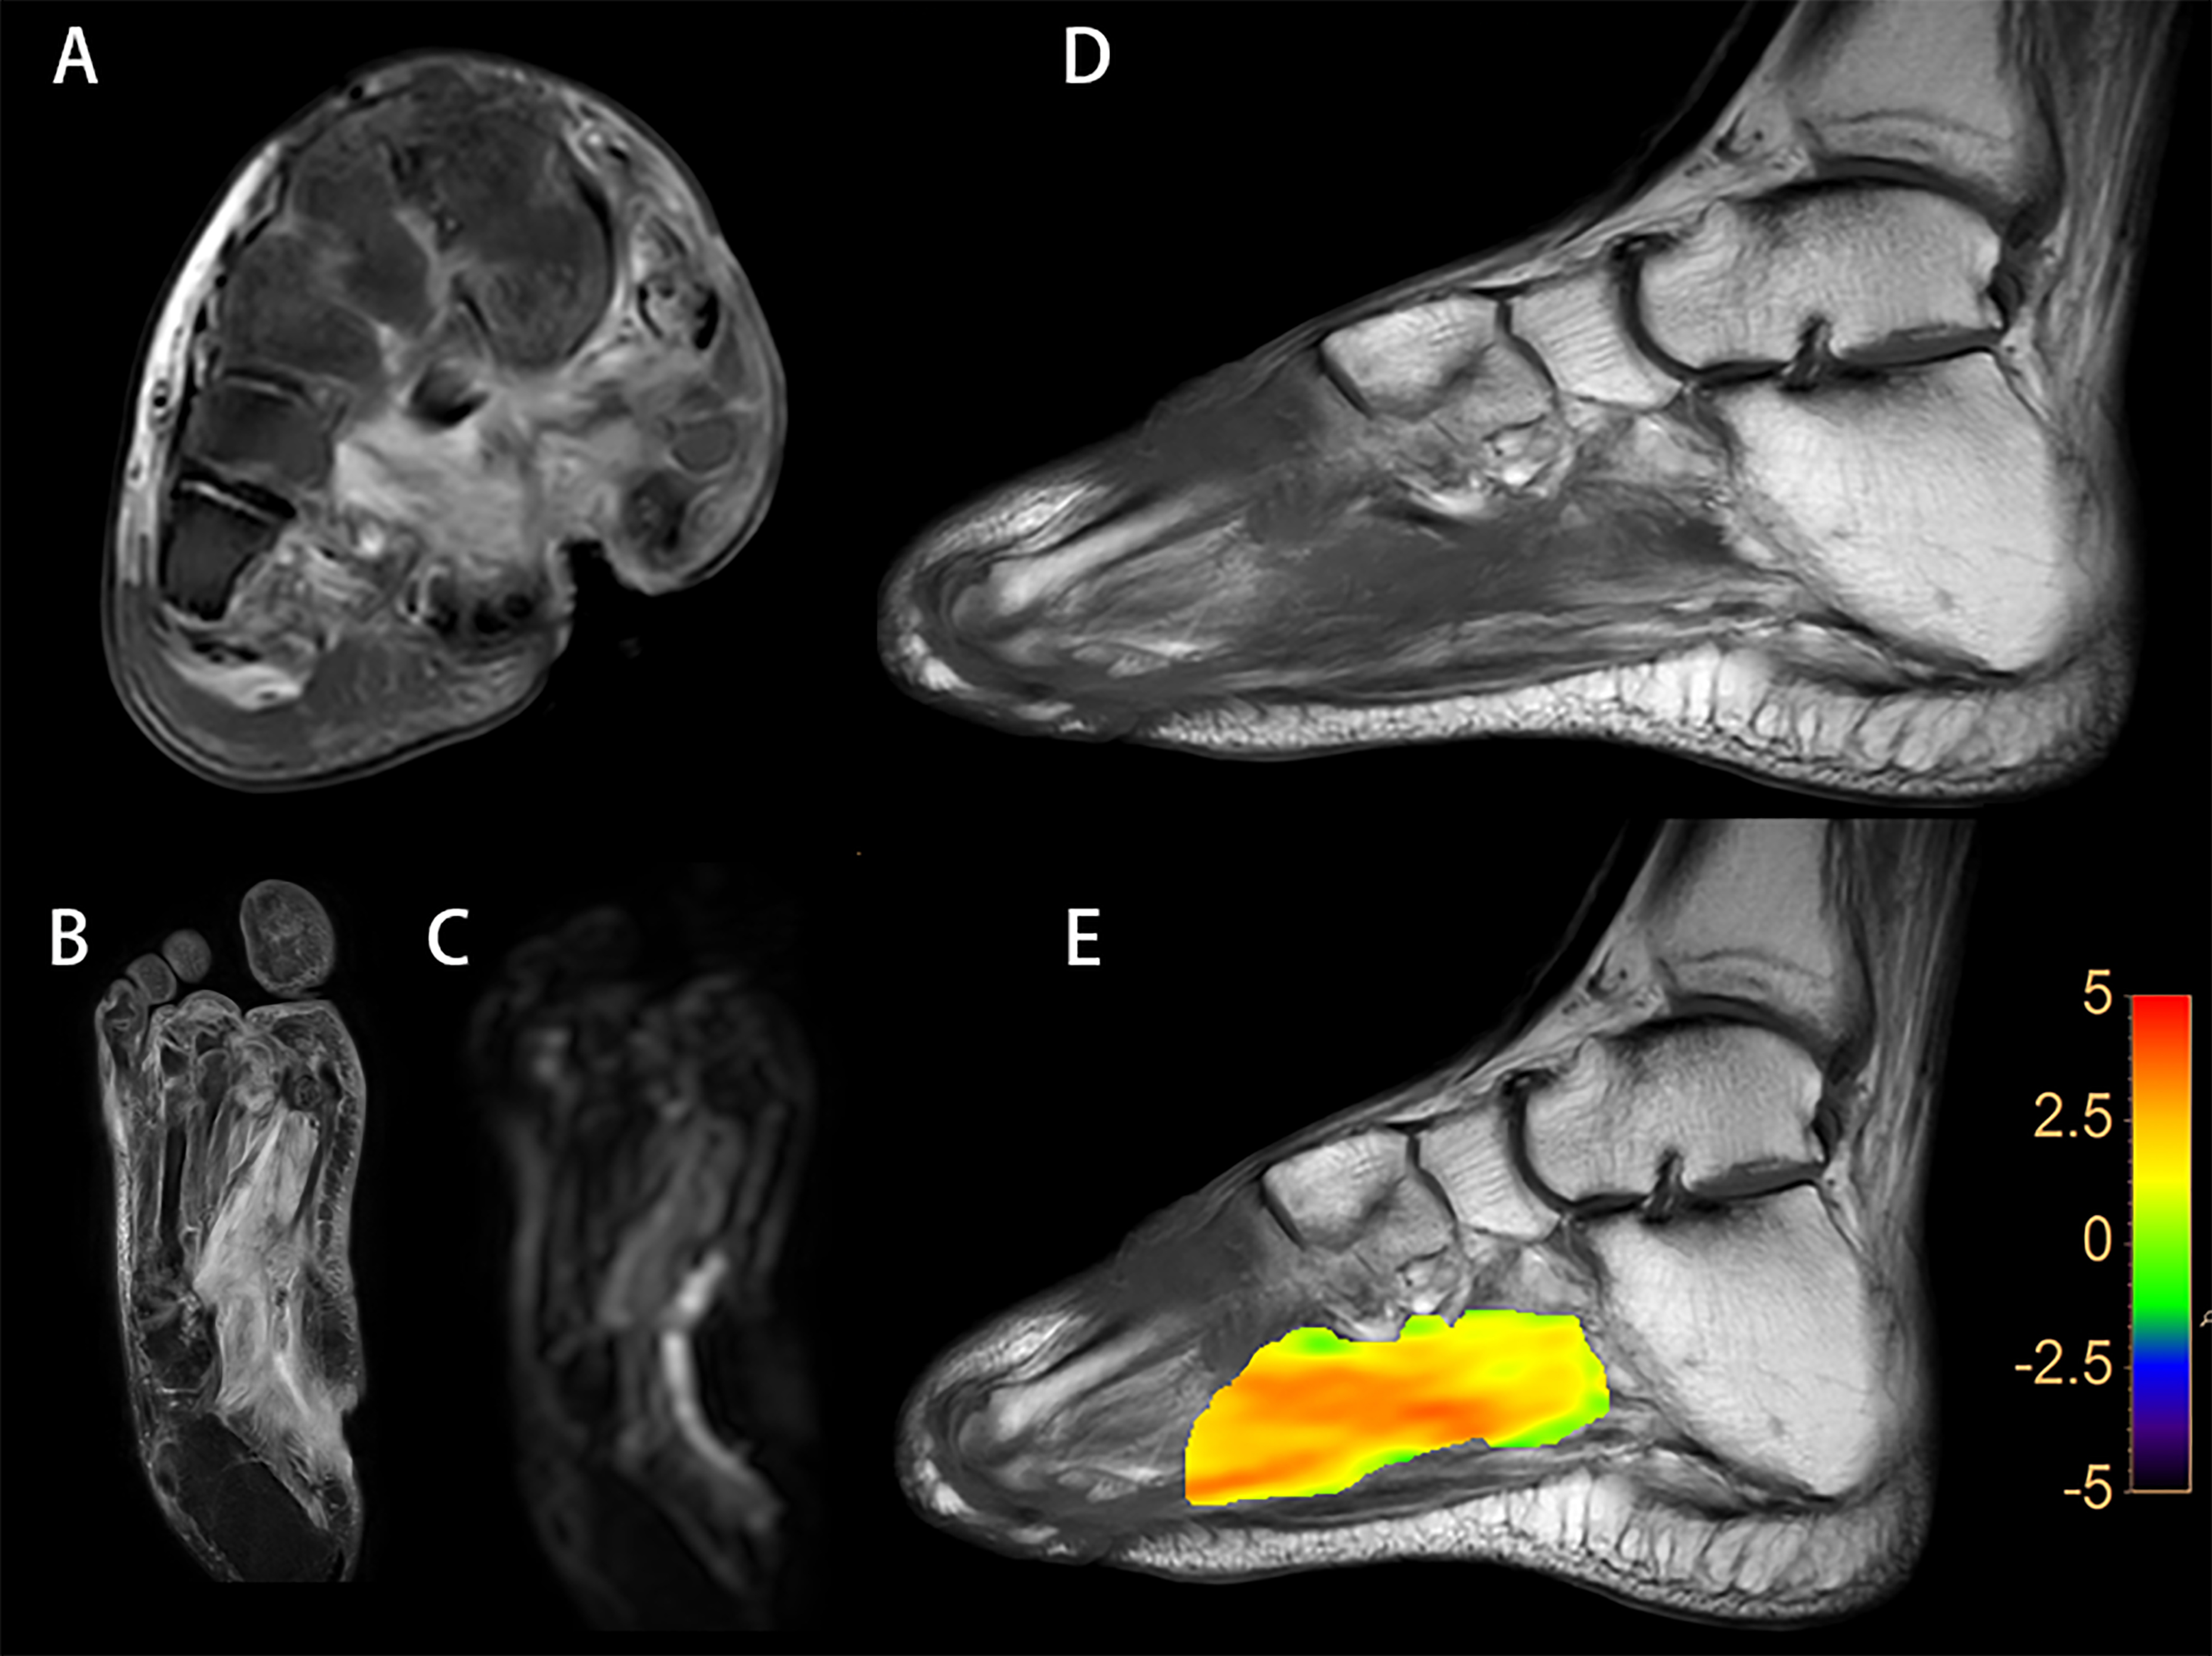
A diabetic foot patient is shown on Figure 1. A, an increased T2w signal indicates soft tissue edema in the plantar and dorsum, and a plantar sinus tract is formed; B, an elevated PDw signal indicates soft tissue edema; C, an increased DWI signal in soft tissue indicates that water diffusion is limited; D, a lower T1w signal of the metatarsal bones indicates osteomyelitis; E, a fused local APTw image and T1w image. MTRasym (3.5 ppm) represents for 3.8%.
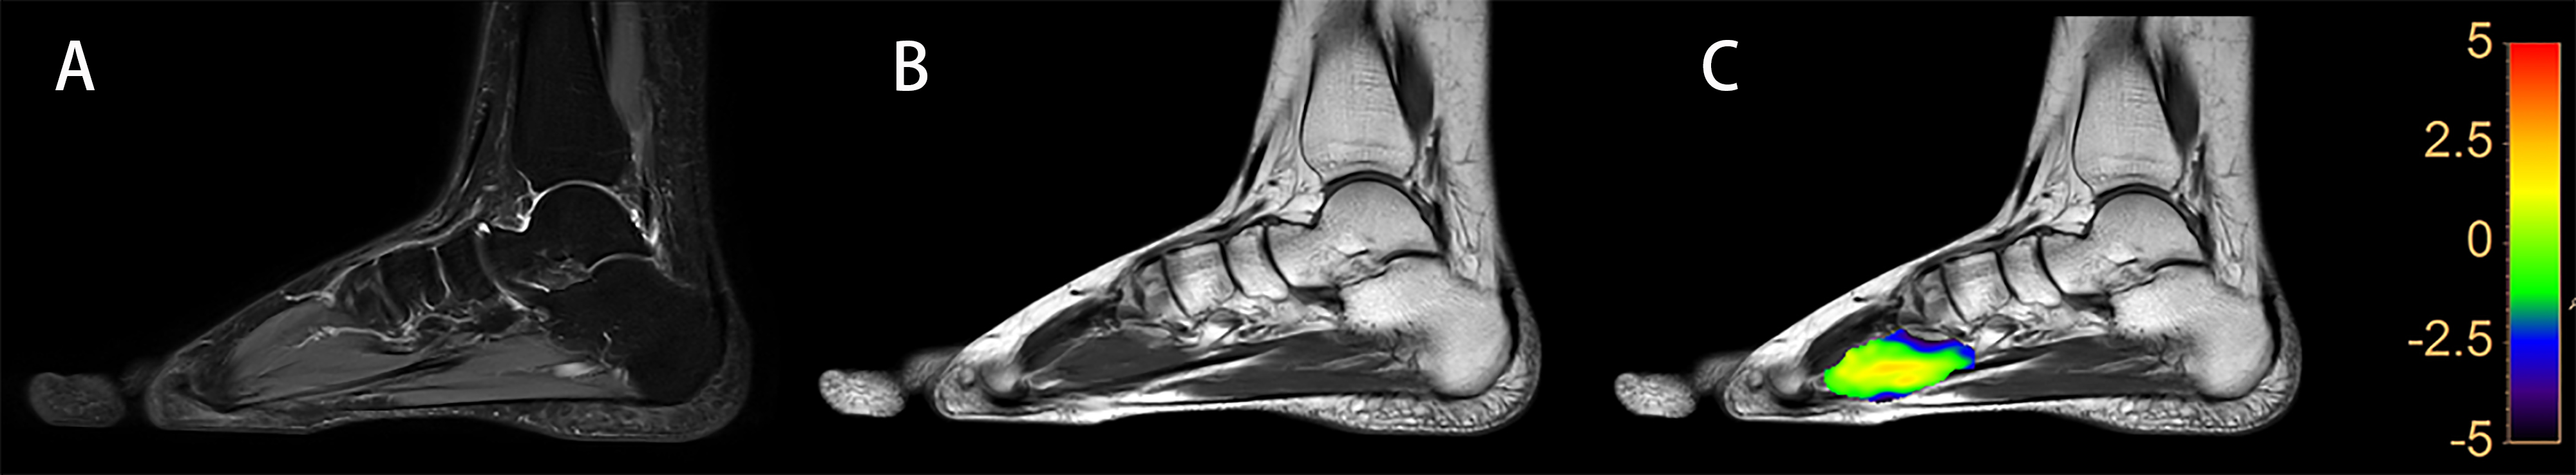
Figure 2 demonstrates a healthy volunteer. According to the PDw image (A) and T1w image (B), there are no abnormalities in the plantar soft tissue; C, a fused local APTw image and T1w image. MTRasym (3.5 ppm) accounts for 1.0% of the total.
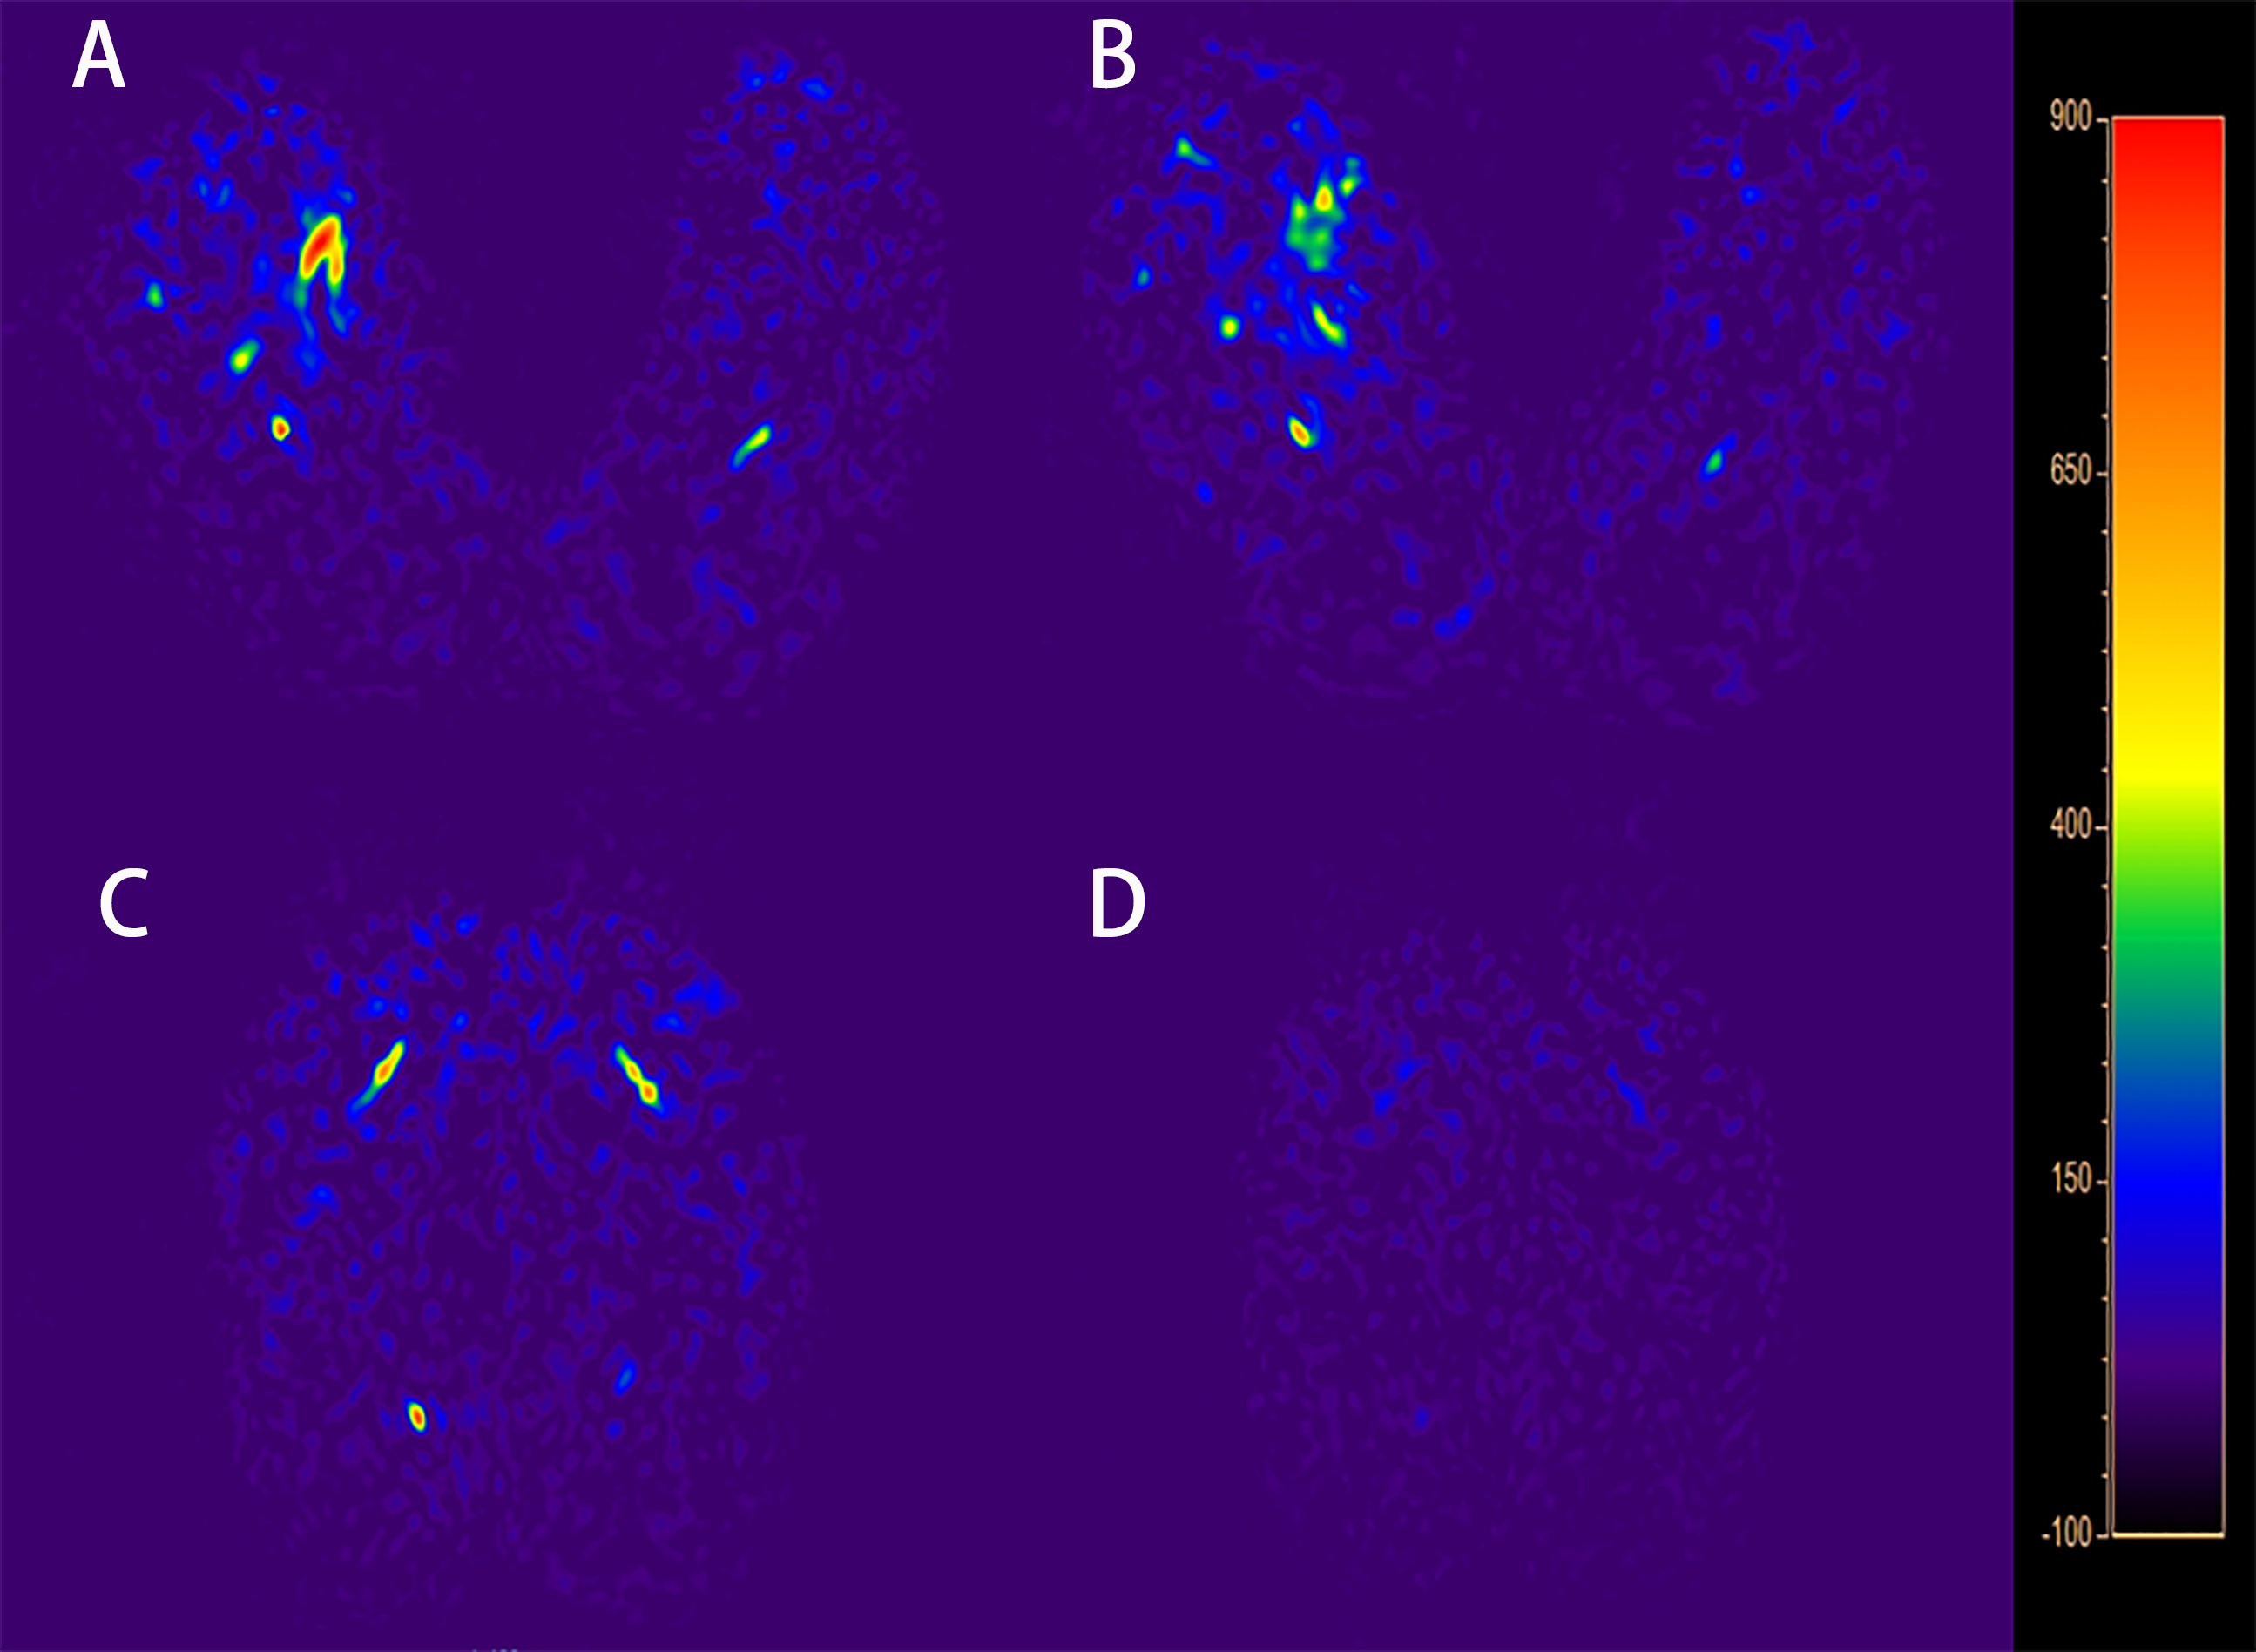
Figure 3: Blood flow mapping of a diabetic foot patient using an ASL image with PLDs of 1450 ms (A) and 1600 ms (B); blood flow mapping of a healthy volunteer using an ASL picture with PLDs of 1450 ms (C) and 1600 ms (D).
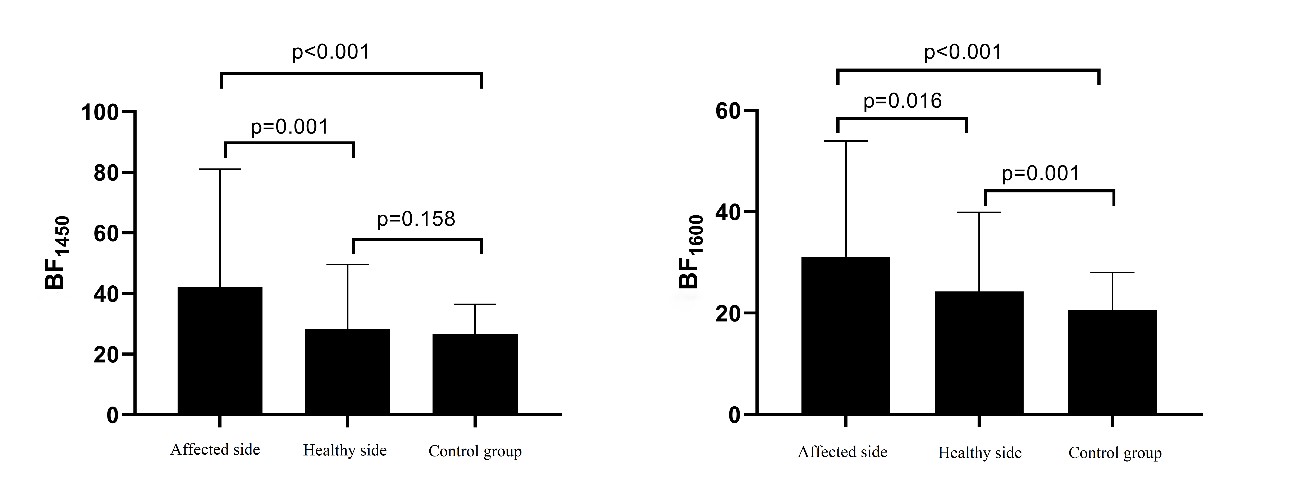
Figure 4. BF between the affected side and contralateral
side foot in DF group and those in the control group.
DOI: https://doi.org/10.58530/2023/5368