5367
Perturbation of calf-muscle stiffness with graded plantar flexions as measured by magnetic resonance elastography1Central Research Institute, United Imaging Healthcare, Shanghai, China, 2School of Biomedical Engineering, ShanghaiTech University, Shanghai, China, 3Institute of Arthritis Research in Integrative Medicine, Shanghai Academy of Traditional Chinese Medicine, Shanghai, China, 4Department of Radiology, Shanghai Guanghua Hospital of Integrative Medicine, Shanghai, China
Synopsis
Keywords: Skeletal, Elastography
Using magnetic resonance elastography (MRE), we investigated the potential changes in the stiffness of calf muscle with plantar flexion. Significant decreases in shear modulus were found when exercise was applied in a progressive way. Such decrease was possibly due to the increase muscle hyperemia in exercise, which was partially verified by increased T2-weighted signals in the same study. In conclusion, MRE is a promising method for measuring mechanical viscoelastic properties of skeletal muscles and thus for assessing muscle function or performance.
Introduction
It is widely known that skeletal muscle gets stiffer with exercise, one major factor being substantially increased muscle perfusion, or hyperemia. Magnetic resonance elastography (MRE) is capable of quantitatively evaluating the mechanical properties of tissues1, and showed much promise for in vivo applications of skeletal muscles2,3. In this study, we investigated the quantitative relationship between exercise intensity and the induced muscle stiffness. Specifically, an established protocol of exercise-and-imaging was used for calf muscles of healthy subjects that performed straight-leg plantar flexion, and MRE was performed after the exercise with multiple different loads.Methods
The study was approved by the local IRB. Three healthy subjects (three males, age 19.5±0.5 years) without neurological or musculoskeletal disease participated in this study, and signed written informed consent before the experiment. In a supine and head-first position inside a 3T MR scanner (uMR890, United Imaging Healthcare, Shanghai, China), each subject performed plantar flexion with one calf using a customized apparatus with adjustable load. The plantar flexion and MRE measurements were arranged in an interleaved manner, as shown in Fig. 1. Specifically, 3 sessions of plantar flexion were applied, with load of 4, 8 and 16 lbs, respectively. One subject failed to finish the exercise of 16 lbs due to fatigue. Each exercise session lasted for 3 minutes, with frequency of 1 push per sec. Before the exercise, the lower-leg muscle was rested as the baseline phase. The post-exercise measurements were performed immediately after exercise’s termination, and the recovery one was taken five minutes after the final exercise. For MRE, we used a MR-compatible transducer positioned under the calf, to apply vibration with frequency of 60 Hz throughout each scan. Within each vibration cycle, four phase offsets were used. For imaging, echo planar imaging (EPI) sequence was used with the following parameter values: field of view 420×420 mm2, matrix size 96×96, repetition time/echo time (TR/TE) 1000/45.5 ms, slice thickness 8 mm, and flip angle 90°. After each exercise, MRE acquisition was repeated three times and each acquisition took 39 sec.All the data were transferred to a personal computer and processed with custom-written programs in MATLAB (MathWorks, Natick, MA, USA). Phase unwrapping of the acquired phase images was performed with a fast 2D phase-unwrapping algorithm4. The unwrapped phase images were then filtered by a 2D high-pass Butterworth filter to reduce noise and a directional filter to eliminate interfering waves5, after which a local frequency estimation (LFE) method6 was used to compute shear modulus (unit: Pa). To estimate shear modulus of each muscle group, we manually drew region of interest (ROI) for medial gastrocnemius (MG), lateral gastrocnemius (LG) and soleus (S) in the corresponding magnitude image. Paired t-tests were used to compare the estimates of shear modulus between the muscle groups or after the various exercise intensities. Difference with P value of less than 0.05 was considered as significant. To verify the potential role of water content in the changes of shear modulus, we also estimated the averaged signal intensities of the T2-weighted magnitude images acquired after the exercises.
Results
Representative maps of shear modulus from one subject are shown in Fig. 2. In the shown maps, substantial decrease in shear modulus can be visually detected in the post-exercise measurements as compared to the baseline. Fig. 3 shows that the shear modulus decreased significantly in the gastrocnemius and soleus when the weight of load increased, and then recovered by some degree after exercise. Except for the soleus of one subject, all the muscles had significant lower shear modulus at their highest exercise intensity as compared to the baseline (P<0.05). For all the subjects, there was prominent trend of decrease in shear modulus as exercise intensity increased, and such decreases recovered partially after 5 minutes of rest. On average, T2-weighted signal intensity progressively increased from baseline to the increased exercise intensities, and recovered back to the baseline level after all the exercises (Fig. 4).Discussion
This study demonstrated that plantar flexion of 3 minutes could induce significant decrease in calf muscles, and that such decrease had a trend of correlation with the applied exercise intensity (within a range from 4 lbs to 16 lbs). These findings suggest that shear modulus as a metric of muscle stiffness is sensitive to the applied exercise protocol. It was noted that such decrease occurred to both gastrocnemius and soleus, with the former being the activated muscle and the latter receiving cardiac output passively in straight-leg plantar flexion. We believe that such decreases in muscle stiffness were mostly due to the increase of water content or muscle hyperemia in exercise. This is supported by the observed increases in T2-weighted signals, which corresponded to increases in T2 value and thus water content. Increased water content has already been found by previous studies7.Conclusion
MRE-measured shear modulus of calf muscle was found to be a sensitive parameter to exercise intensity. In future study, we will explore how this parameter could complement with other MRI methods such as perfusion and how it could advance the diagnosis and management of the various low-extremity diseases.Acknowledgements
No acknowledgement found.References
1. Mariappan YK, Glaser KJ, Ehman RL. Magnetic Resonance Elastography: A review. Clinical anatomy. 2010;23(5): 497-511.
2. Tan K, Jugé L, Hatt A, Cheng S, Bilston LE. Measurement of large strain properties in calf muscles in vivo using magnetic resonance elastography and spatial modulation of magnetization. NMR in Biomedicine. 2018;31(10): e3925.
3. Bilston LE, Tan K. Measurement of passive skeletal muscle mechanical properties in vivo: recent progress, clinical applications, and remaining challenges. Ann Biomed Eng. 2015;43(2):261-273.
4. Herráez MA, Burton DR, Lalor MJ, Gdeisat MA. Fast two-dimensional phase-unwrapping algorithm based on sorting by reliability following a noncontinuous path. Appl Opt. 2002;41(35):7437-7444.
5. Manduca A, Lake DS, Ehman RL. Spatio-temporal Directional Filtering for Improved Inversion of MR Elastography Images. Medical image analysis. 2003;7(4), 465–473.
6. Knutsson H, Westin CF, Granlund G. Local multiscale frequency and bandwidth estimation. Proceedings of 1st International Conference on Image Processing; 1994.
7. Mathur S, Vohra RS, Germain SA, Forbes S, Bryant ND, Vandenborne K, Walter GA. Changes in muscle T2 and tissue damage after downhill running in mdx Mice. Muscle & Nerve. 2011;43(6): 878-886.
Figures
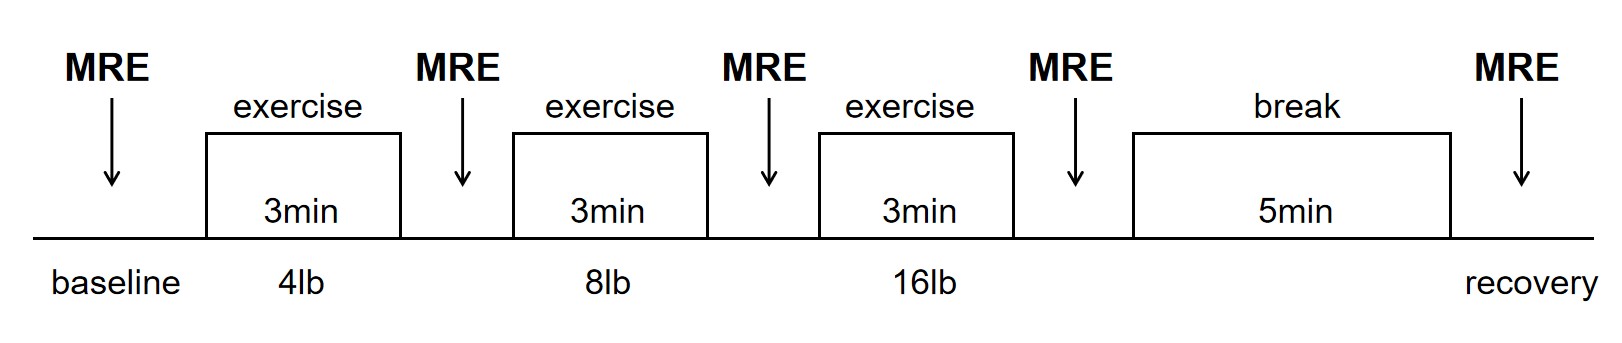
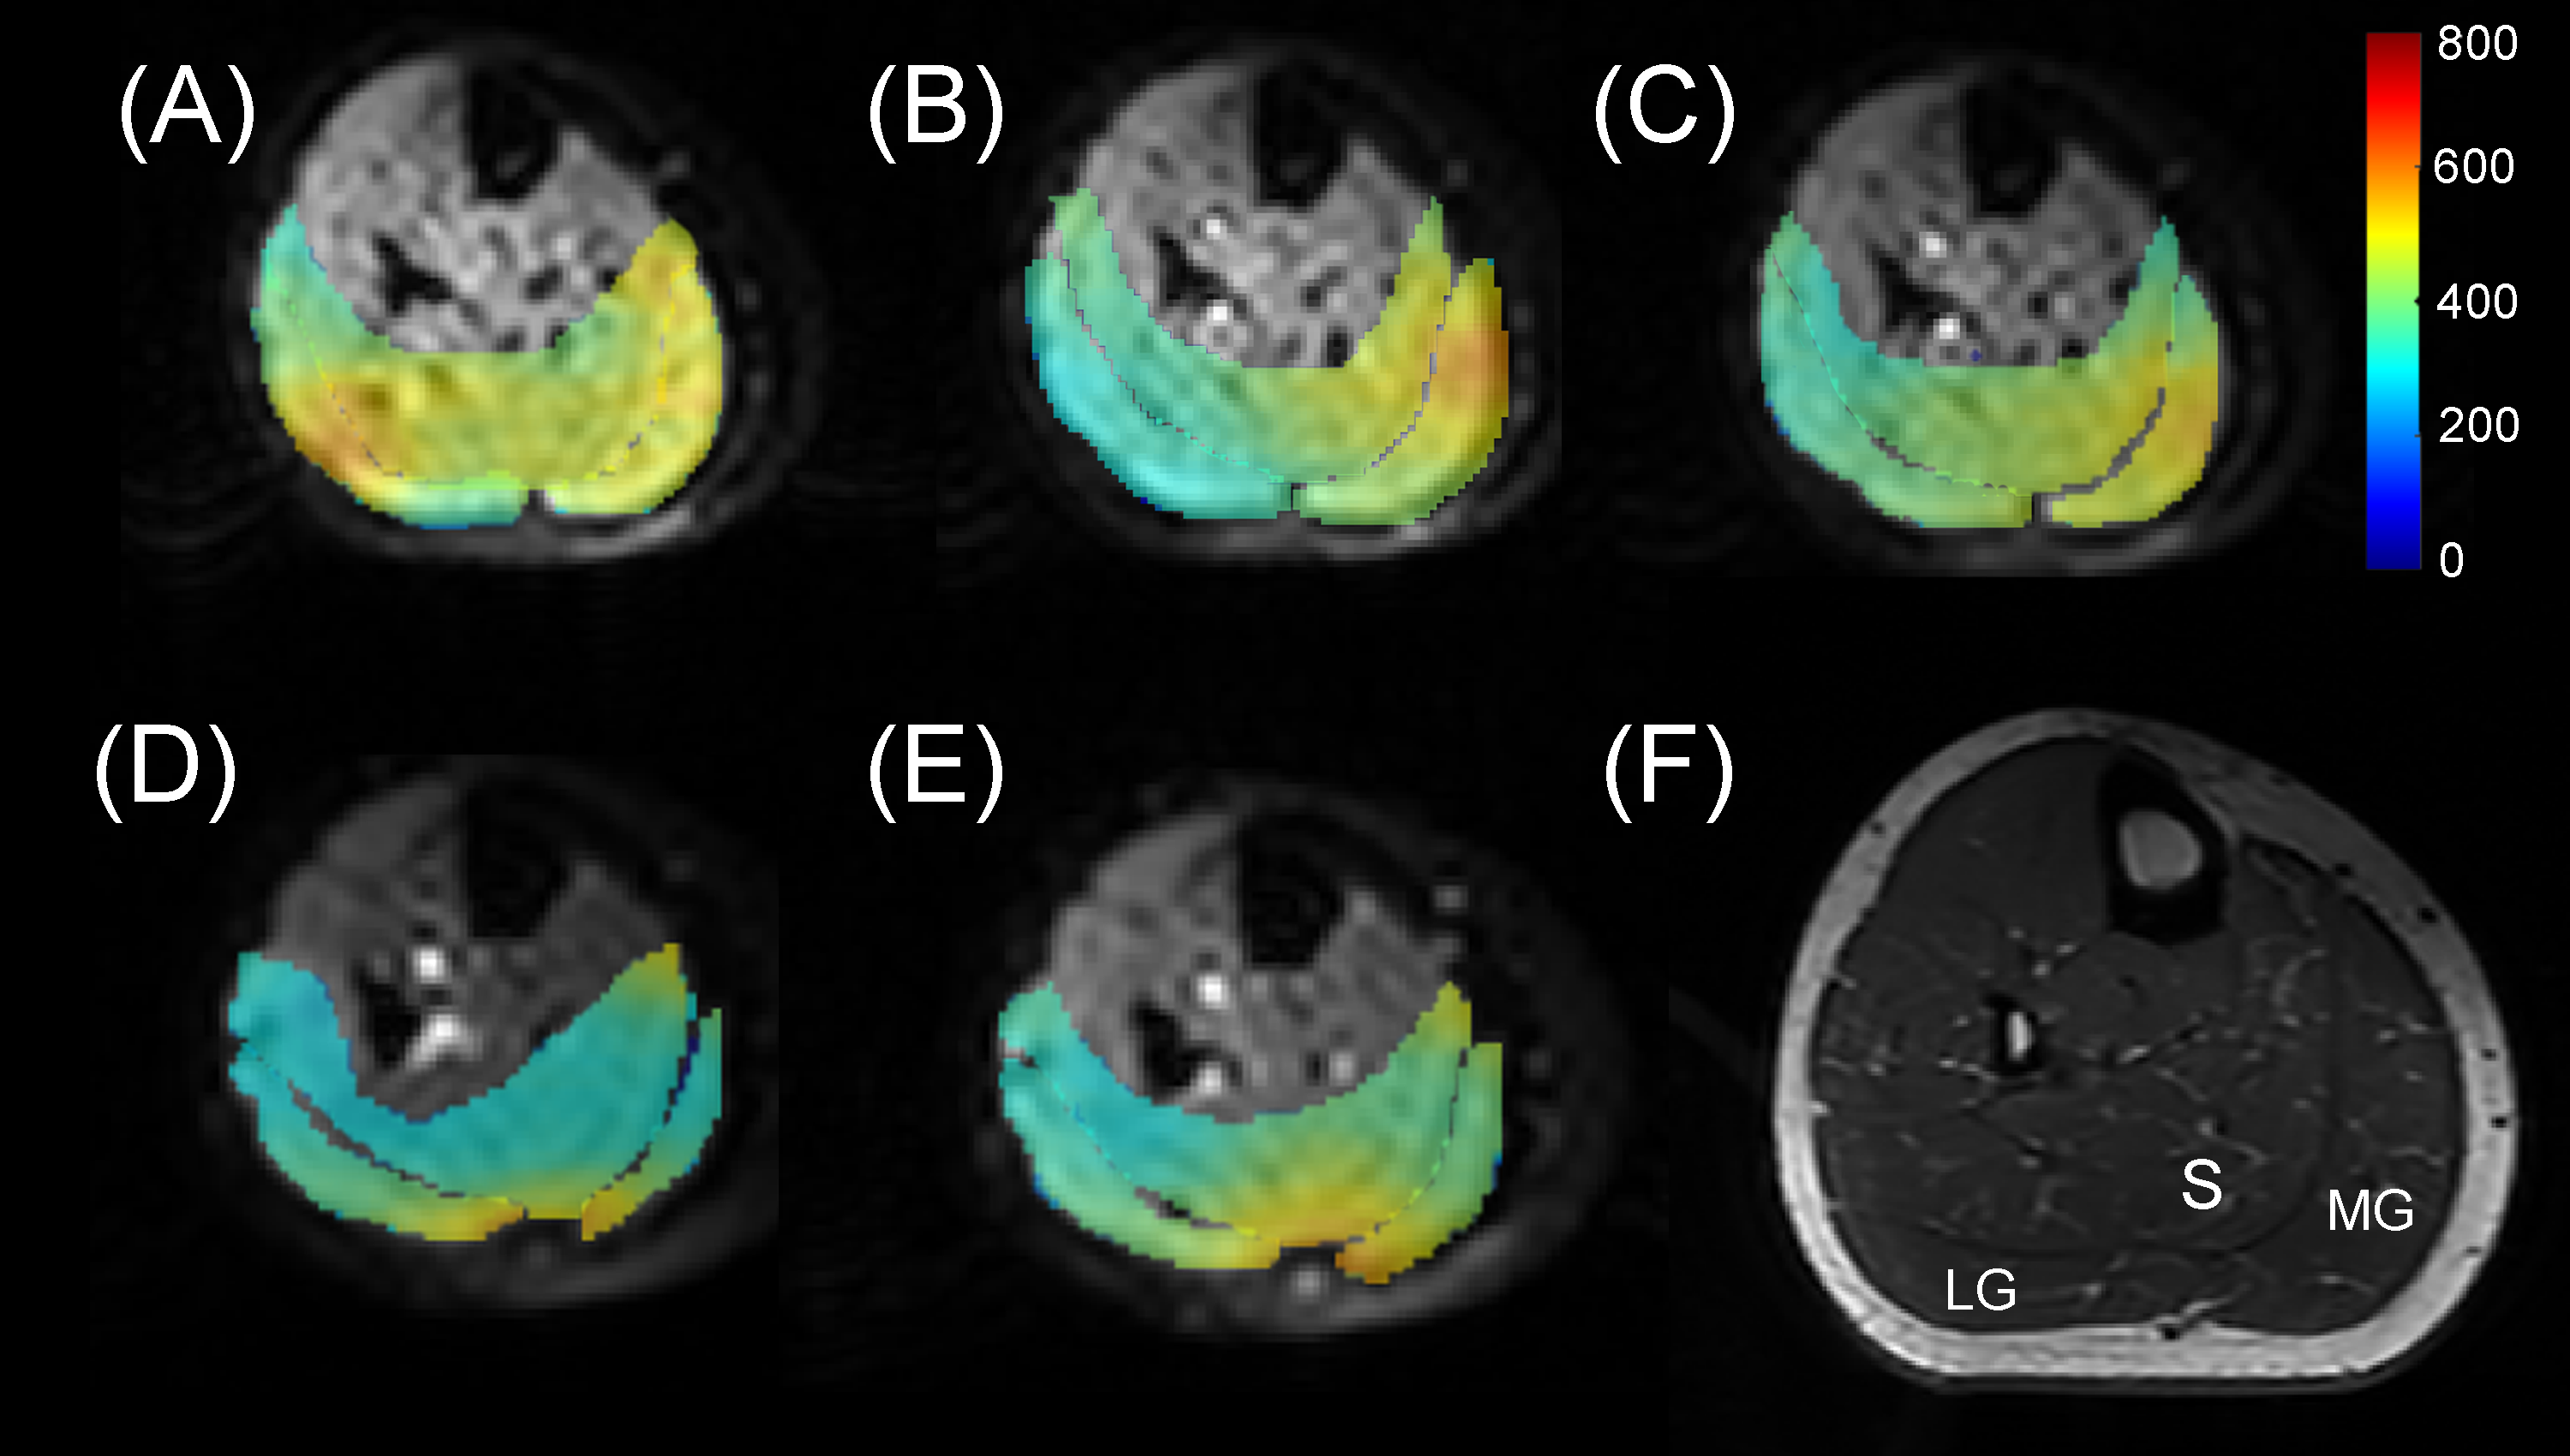
Fig. 2. Representative maps of shear modulus overlaid on the corresponding magnitude image: (A-E) baseline, exercises of 4, 8, 16 lbs, and recovery. (F) a high-resolution T1-weighted image shows the regions of interests: lateral gastrocnemius (LG), medial gastrocnemius (MG) and soleus (S).
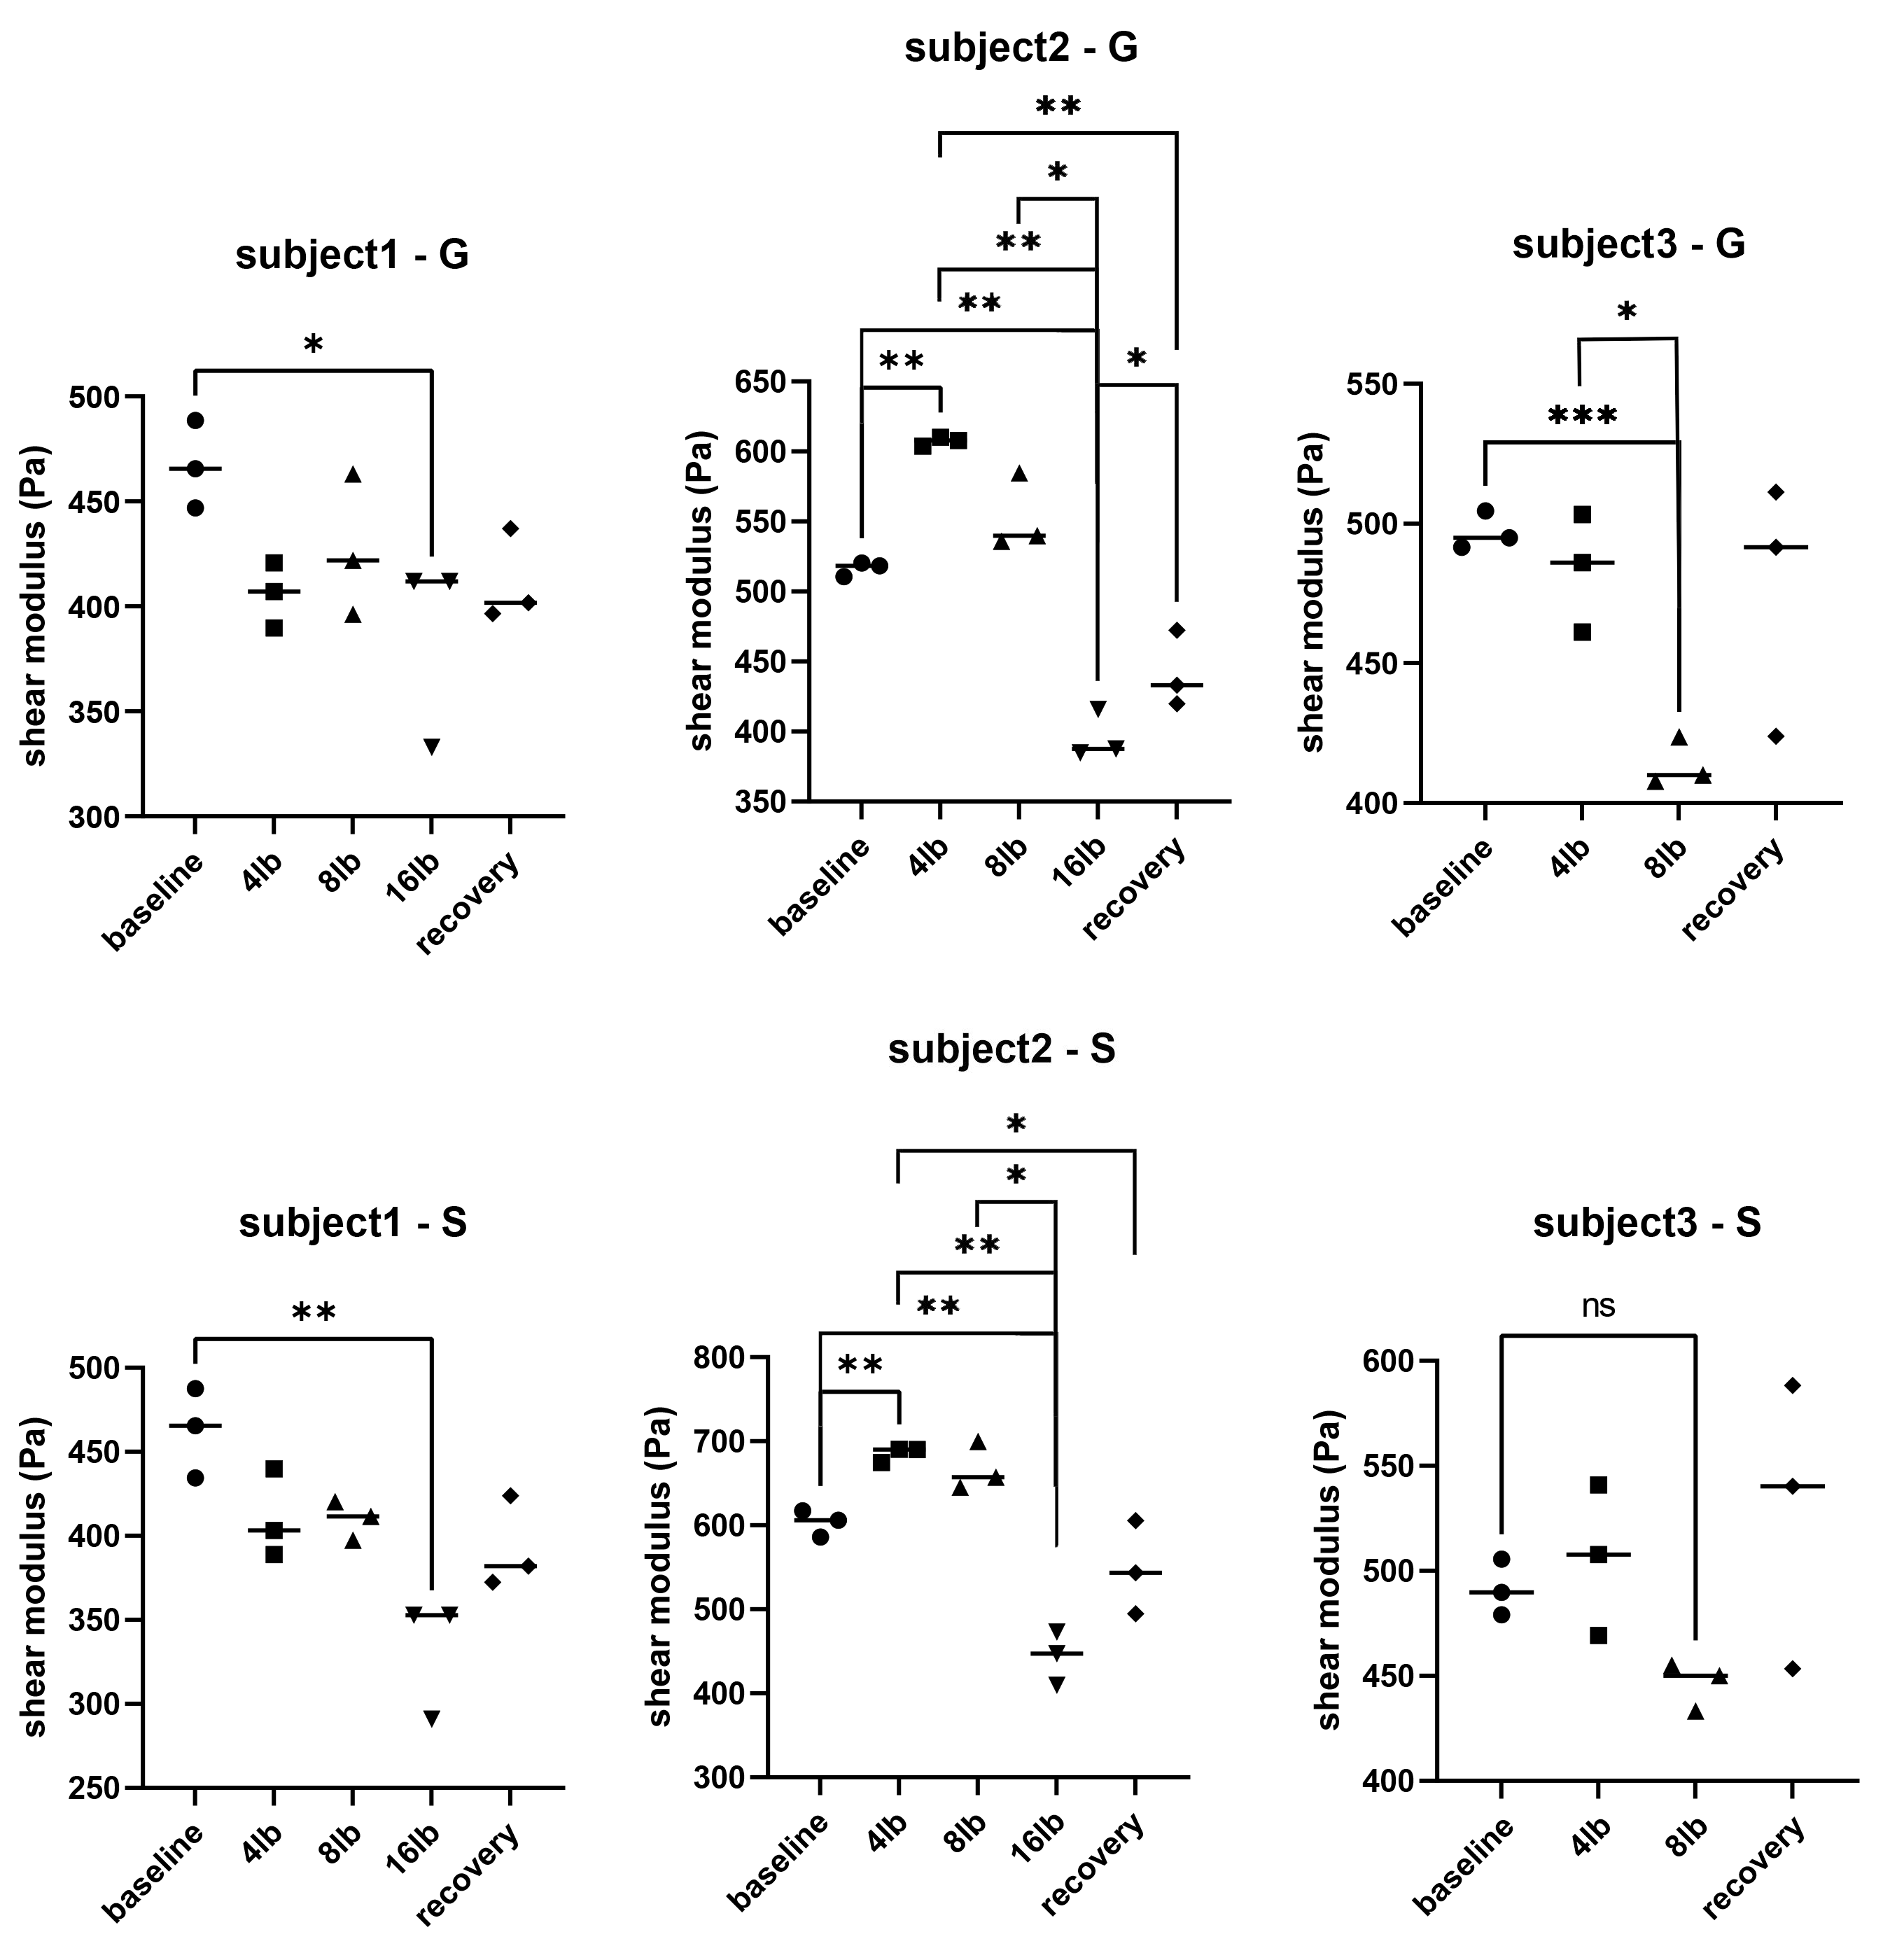
Fig. 3. The estimates of shear modulus of the gastrocnemius (G) and soleus (S) measured after plantar flexion of various loads (4, 8, 16 lbs), for three subjects. (*P < 0.05, **P < 0.01, ***P < 0.001, ns: not significant)
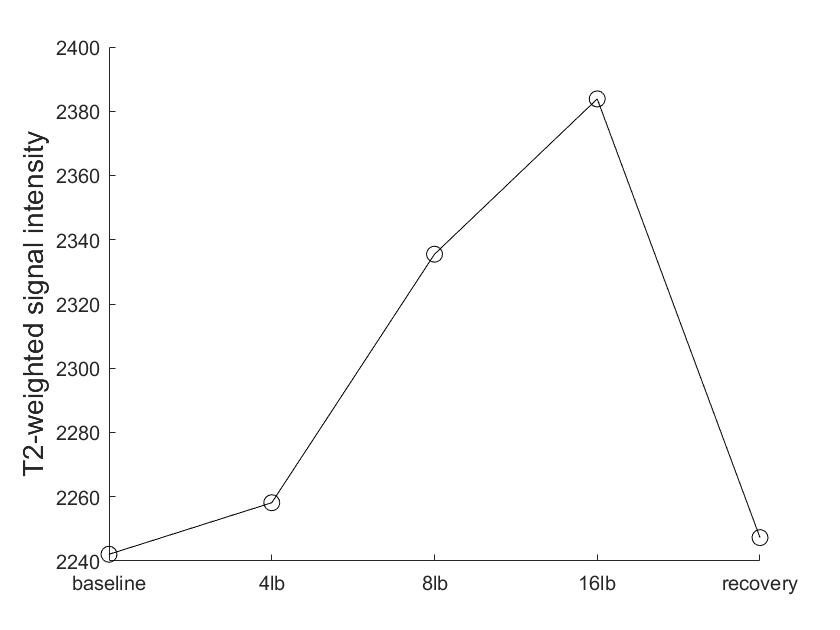
Fig. 4. T2-weighted signal intensity averaged over gastrocnemius and soleus of all the subjects increased with exercise intensity.