5366
Autophagic accumulations are related to diffusion parameters in non-fat infiltrated muscles of the Pompe mouse
Marlena Rohm1,2, Gabriele Russo3,4, Xavier Helluy3,5, Martijn Froeling6, Denise Manahan-Vaughan3, Matthias Vorgerd1,2, and Lara Schlaffke1
1Department of Neurology, BG-University Hospital Bergmannsheil gGmbH, Bochum, Germany, 2BG-University Hospital Bergmannsheil gGmbH, Heimer Institute for Muscle Research, Bochum, Germany, 3Department of Neurophysiology, Ruhr-University Bochum, Bochum, Germany, 4International Graduate School of Neuroscience, Ruhr-University Bochum, Bochum, Germany, 5Department of Biopsychology, Institute of Cognitive Neuroscience, Faculty of Psychology, Ruhr-University Bochum, Bochum, Germany, 6Department of Radiology, University Medical Centre Utrecht, Utrecht, Netherlands
1Department of Neurology, BG-University Hospital Bergmannsheil gGmbH, Bochum, Germany, 2BG-University Hospital Bergmannsheil gGmbH, Heimer Institute for Muscle Research, Bochum, Germany, 3Department of Neurophysiology, Ruhr-University Bochum, Bochum, Germany, 4International Graduate School of Neuroscience, Ruhr-University Bochum, Bochum, Germany, 5Department of Biopsychology, Institute of Cognitive Neuroscience, Faculty of Psychology, Ruhr-University Bochum, Bochum, Germany, 6Department of Radiology, University Medical Centre Utrecht, Utrecht, Netherlands
Synopsis
Keywords: Muscle, Translational Studies, Longitudinal Studies
In Pompe disease a mutation in the alpha-glucosidase gene leads to accumulation of glycogen and autophagosomes. Previously, we reported changes in diffusion in patient muscles. To identify histopathological correlations, the quantitative MRI protocol was translated to a mouse model, using DTI sequences in a monthly interval to scan the hind limb of pre-symptomatic mice. Subsequently, immunofluorescence stainings and glycogen assay were carried out to correlate glycogen accumulation and autophagic buildup with diffusion changes. No fat-infiltration was detected, while FA increases significantly compared to wildtype. Changes in diffusion parameters were correlated to autophagic buildup but did not correlate with glycogen accumulations.Introduction
Pompe disease (glycogen storage disease type II) is a rare genetic neuromuscular disease caused by a mutation in the lysosomal α-Glucosidase (GAA). The lack of GAA (IOPD; infantile/early onset of disease) or diminished presence of GAA (LOPD; late onset of disease) leads to progressive accumulation of lysosomal glycogen and autophagosomes in heart and skeletal muscle, causing patients to suffer from muscular weakness and subsequent fat infiltration. Quantitative MR imaging was able to show diffusion alterations in LOPD patients non-invasively, in muscles that are not yet fat-infiltrated (Rehmann et al., 2020). The Gaa6neo/6neo mouse is a model for IOPD, due to the knock-out of GAA, as well as LOPD, due to late onset of symptoms, which occur around the age of 8 months (Raben et al., 1998). Using this mouse model allows to analyze therapy-naïve or pre-symptomatic muscle, but also examine the progress in a longitudinal study. In this study, the left hind limb of young Pompe and wildtype mice were scanned in a monthly interval for seven months before the clinically described phenotype is fully developed. In addition, histological stainings were carried out to find out if progressive accumulations are correlated to structural changes revealed by alterations in diffusion in muscle.Methods
From the age of one month (timepoint 0, t0) three GAA6neo/6neo (Pompe) and three wildtype mice were scanned in monthly intervals until the clinical phase at the age of 8 month (timepoint 7, t7). For every timepoint, another group of three Pompe and three wildtype mice were scanned and sacrificed afterwards for histological analysis. The scanning protocol included a Multiple Gradient Echo (MGE) sequence (TE: 10 x Δ 1,904 ms), to allow a multi-Point Dixon for voxelwise quantification of fat and water and a diffusion weighted sequence (DTI) using a multishell Stejskal–Tanner sequence with single-shot EPI readouts. Diffusion data were analyzed analogous to human patient data (Rehmann et al., 2020), including correction for motion and eddy currents and considering the IVIM (De Luca, Bertoldo and Froeling, 2017). Data processing and calculation of fat fractions was performed using QMRITools (github.com/mfroeling/QMRITools). Exemplary images of the upper leg can be seen in Figure 1. Immunofluorescence and glycogen assay were done at three timepoints (three mice each group and each timepoint, t0, t1 and t7). As marker for autophagy LC3 and p62 were stained, while LAMP1 was stained as a lysosomal marker. Positive staining was automatically detected with cellpose (Stringer et al., 2020, version 2.0) and evaluated with Fiji (Schindelin et al., 2012, version 2.35). Multivariate analysis and t-tests on diffusion data was calculated with python package statsmodel (Seabold and Perktold, 2010, version 0.13.2).Results
qMRI results in the hind limb of the Pompe mouse show no fat infiltration, while diffusion in the quadriceps differs significantly from the age of 2 months (t1). The fractional anisotropy (FA) shows a significant increase, mean diffusion (MD) and radial diffusion (RD) show a significant decrease (see Figure 1) over the time period of 7 months as compared to the wildtype mice.Autophagic markers, p62 and LC3, show a buildup in accumulation comparing t0, t1 and t7 (see Figure 2). LAMP1, as a lysosomal marker, is vastly present in all three timepoints Glycogen is significantly higher in the Pompe mice compared to wildtype from the age of t0 and consistent over the disease progression. A preliminary counting of positive staining is shown in Figure 3.
Discussion
Diffusion changes in the hind limb of the Pompe mouse is obvious from the age of two months, previous to the evident onset of clinical symptoms (Raben et al., 1998). While those reduced diffusion was reported previously in adult patients, here we showed that these changes occur independent of fat infiltration, and therefore provide an early marker of disease progression (Rehmann et al.,2020). Autophagic build up is increasing over the course of disease, while glycogen and lysosomal accumulation are already prominent from the age of one month. The increase of LC3 and p62 present a possible explanation for changes in diffusion parameter by autophagosomes accumulating in the cell and therefore hindering diffusion. While there is no significant difference in diffusion parameter at the age of one month (t0) the already prominent glycogen and lysosomal accumulation does not influence diffusion.Conclusion
Even before the development of symptoms, there are architectural changes that correlate with progressive accumulation of autophagosomes. Non-invasive quantitative MRI could be a tool to not only show early disease progression but also monitor therapeutical trials.Acknowledgements
No acknowledgement found.References
De Luca, A., Bertoldo, A. and Froeling, M. (2017) ‘Effects of perfusion on DTI and DKI estimates in the skeletal muscle’, Magnetic Resonance in Medicine, 78(1), pp. 233–246. doi: 10.1002/mrm.26373. Raben, N. et al. (1998) ‘Targeted Disruption of the Acid α-Glucosidase Gene in Mice Causes an Illness with Critical Features of Both Infantile and Adult Human Glycogen Storage Disease Type II’, Journal of Biological Chemistry, 273(30), pp. 19086–19092. doi: 10.1074/JBC.273.30.19086. Rehmann, R. et al. (2020) ‘Diffusion tensor imaging reveals changes in non-fat infiltrated muscles in late onset Pompe disease’, Muscle and Nerve, 62(4), pp. 541–549. doi: 10.1002/mus.27021. Schindelin, J. et al. (2012) ‘Fiji: An open-source platform for biological-image analysis’, Nature Methods, 9(7), pp. 676–682. doi: 10.1038/NMETH.2019. Seabold, S. and Perktold, J. (2010) ‘Statsmodels: Econometric and Statistical Modeling with Python’, PROC. OF THE 9th PYTHON IN SCIENCE CONF. Available at: http://statsmodels.sourceforge.net/ (Accessed: 20 October 2022). Stringer, C. et al. (2020) ‘Cellpose: a generalist algorithm for cellular segmentation’, Nature Methods 2020 18:1, 18(1), pp. 100–106. doi: 10.1038/s41592-020-01018-x.Figures
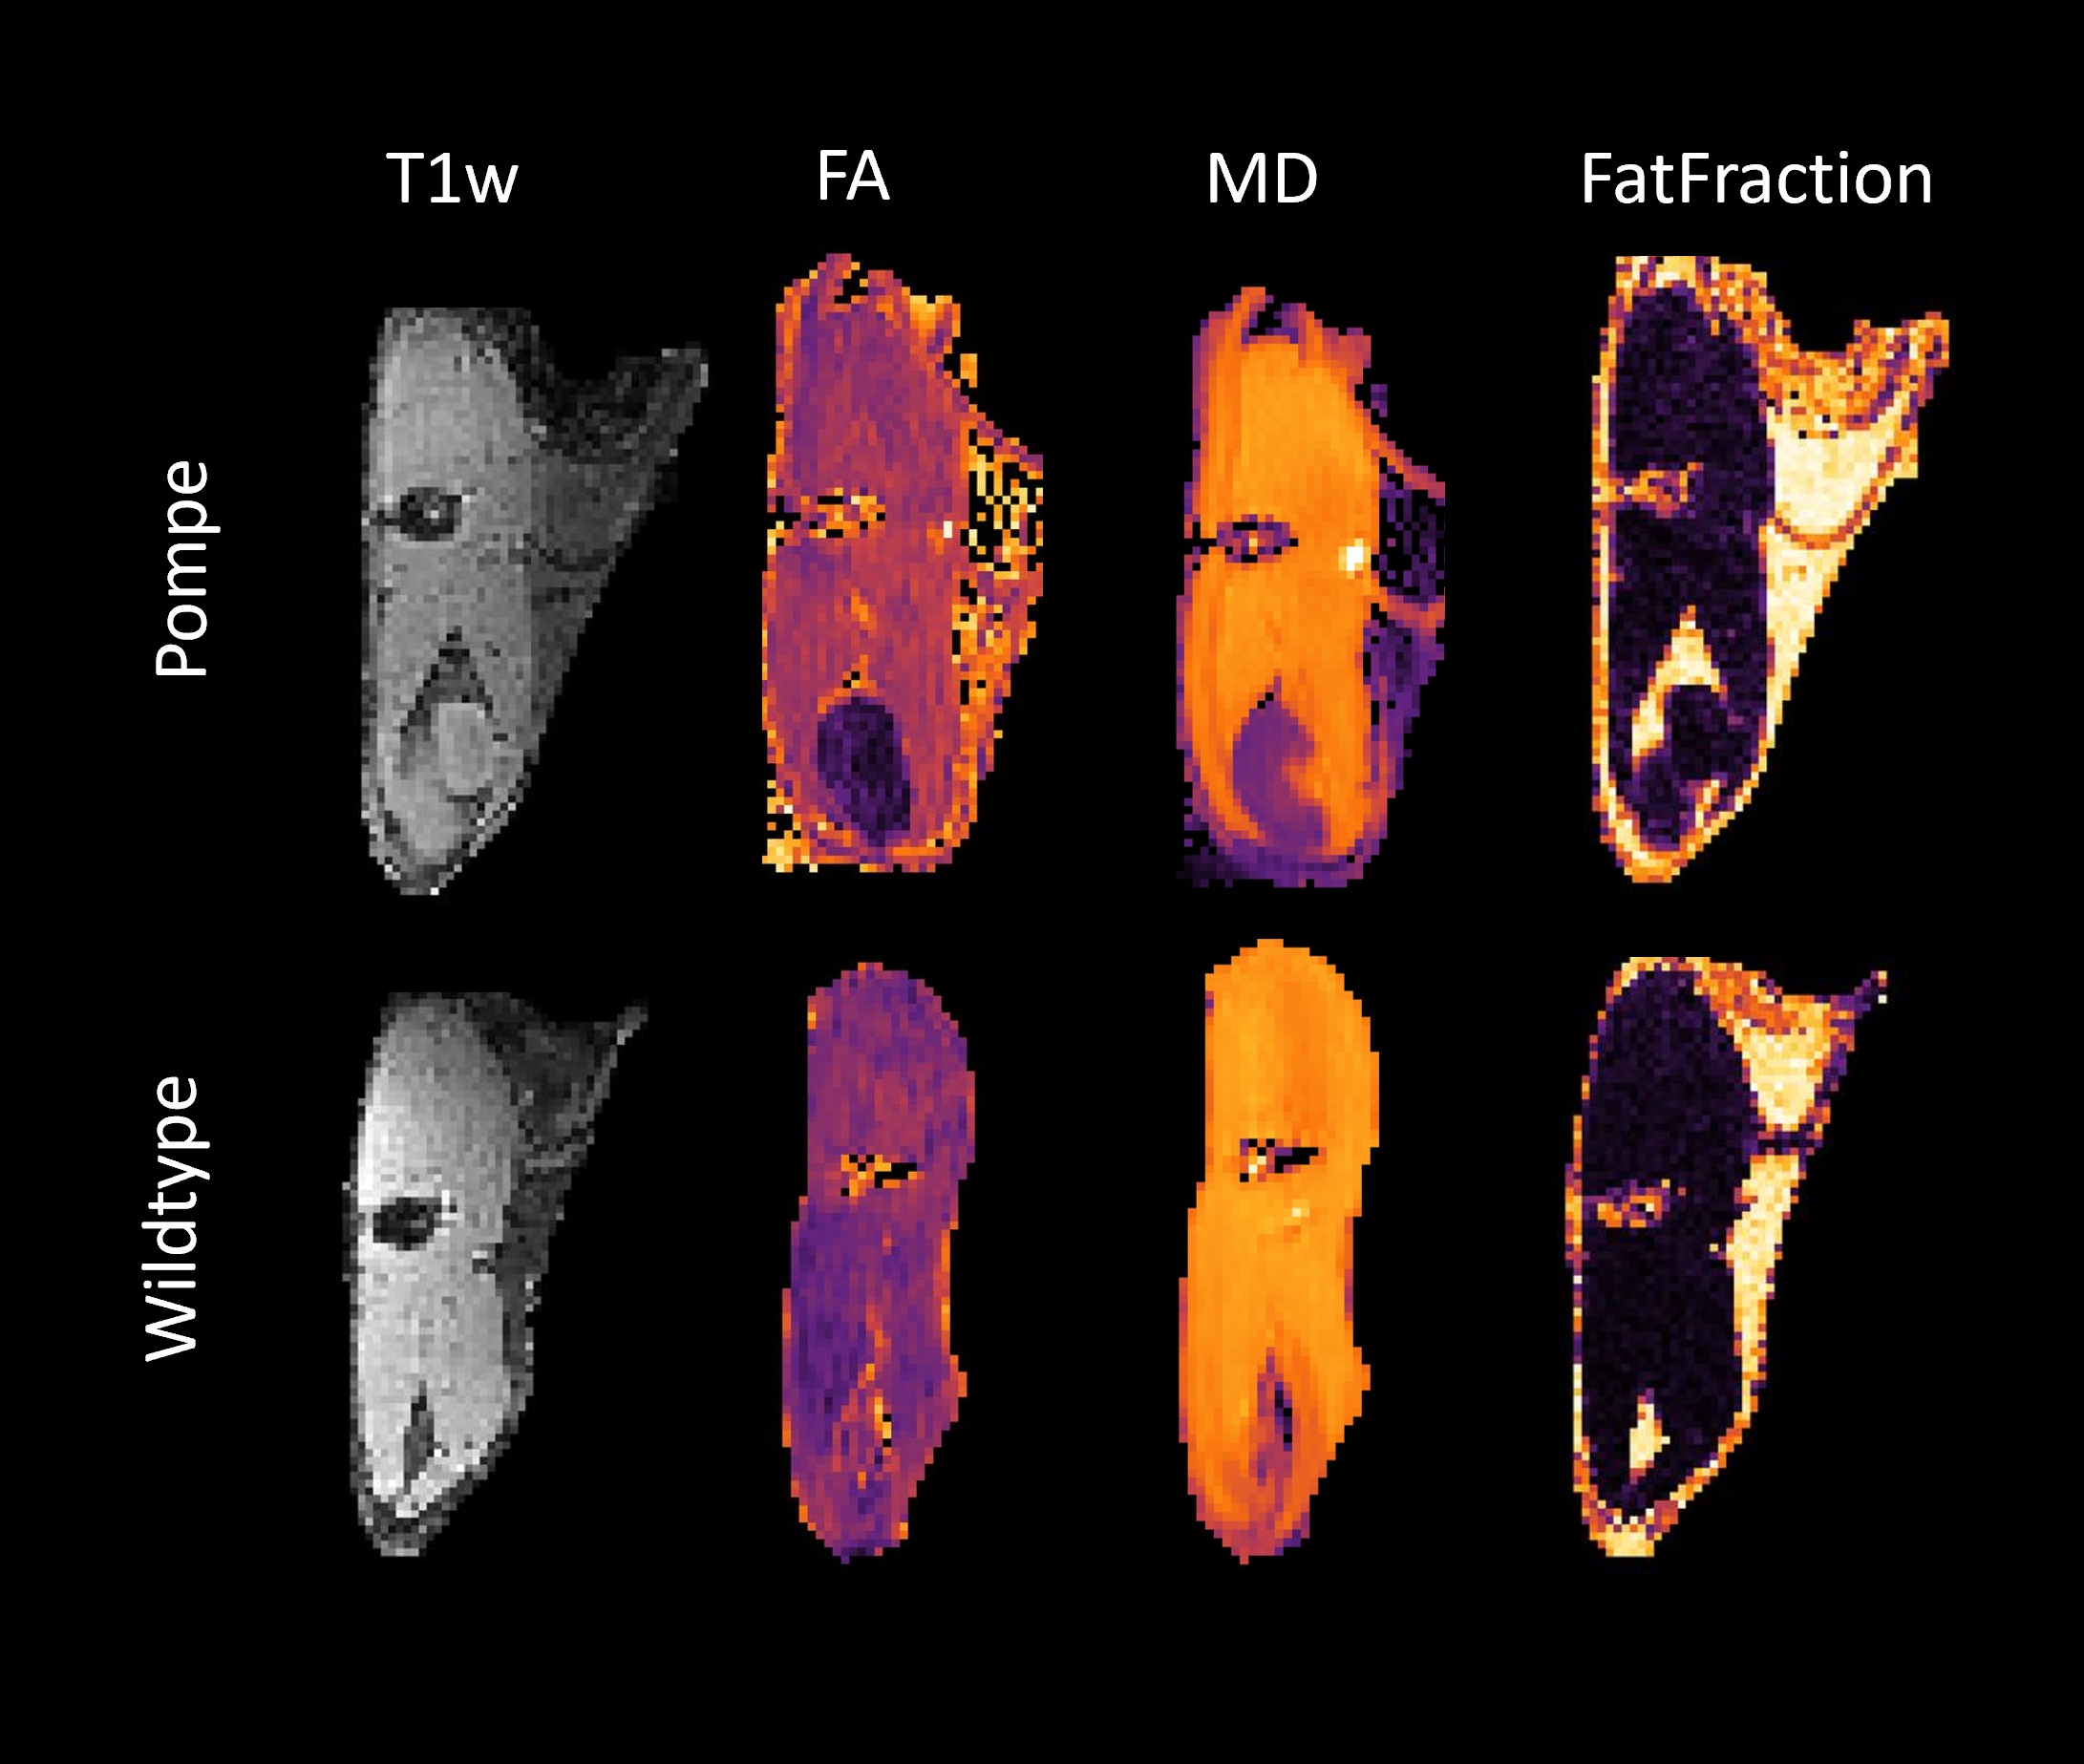
Figure 1: Example images of the upper leg after processing. MRI sequences from left to right: T1w, fractional anisotropy (FA), mean diffusivity (MD), mDixon fat-fraction.
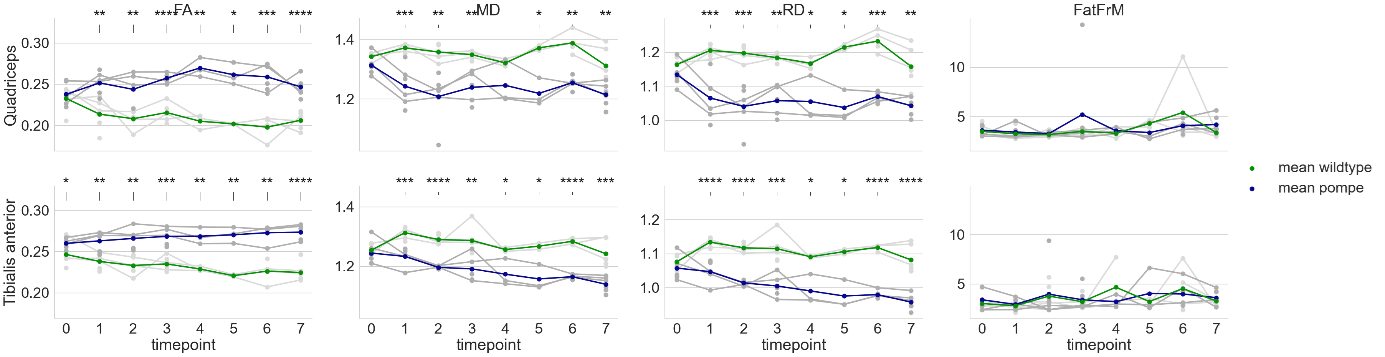
Figure 2: Quantitative parameters of upper and lower leg muscles in Pompe and wildtype mice from the age of 1 to 8 months. Data were tested for significance using t-test. Significant differences are indicated by *p<0.05, **p<0.01, ***p<0.001, ****p<0.0001, n = 3-6.
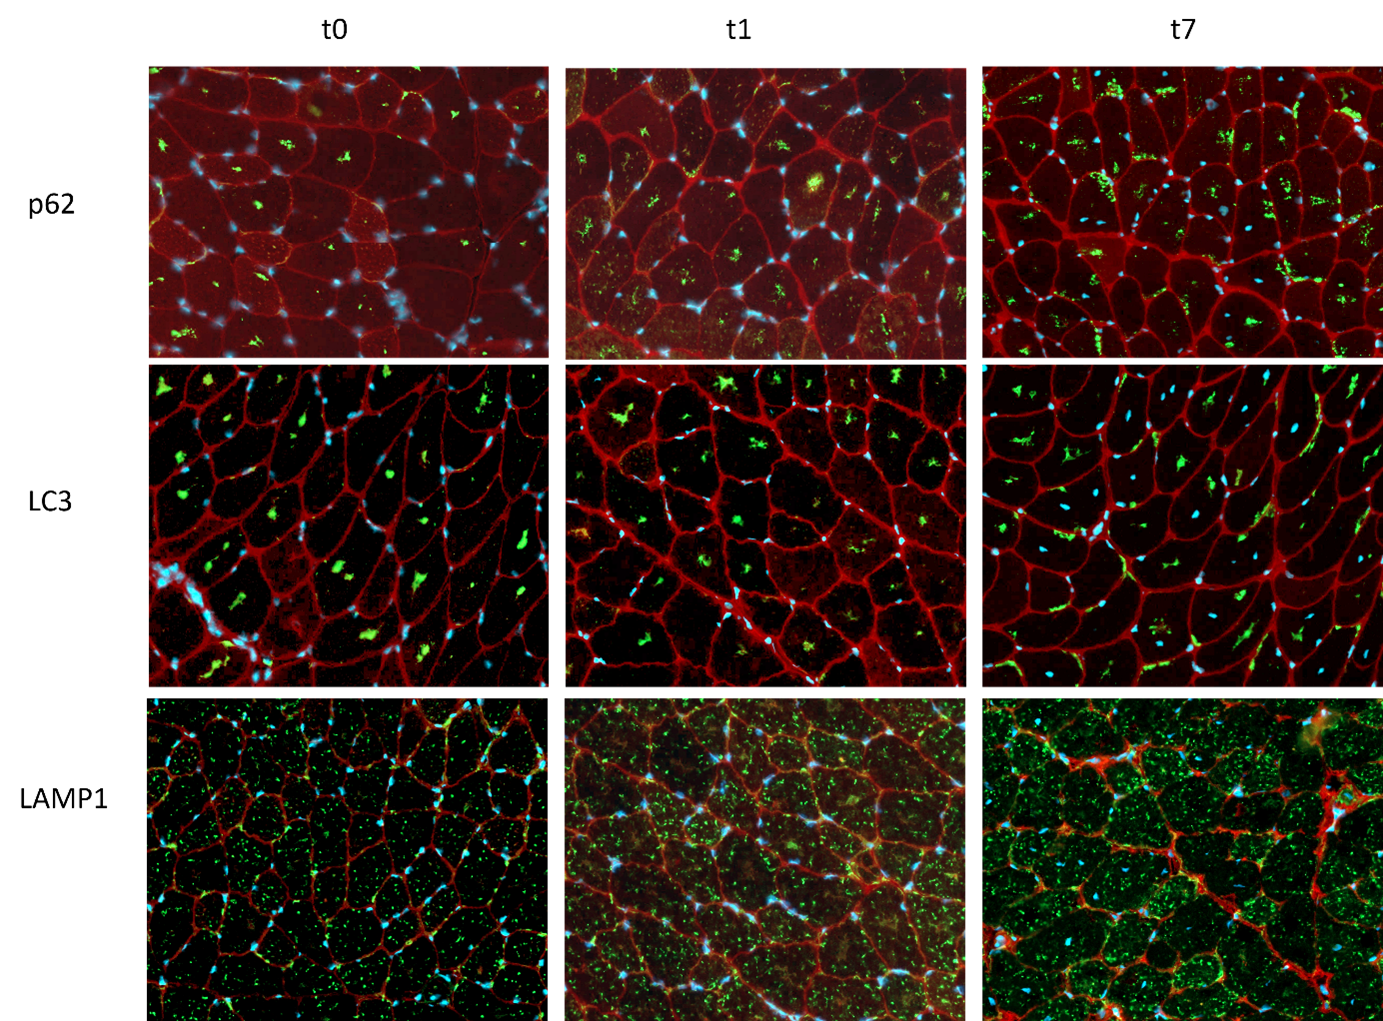
Figure 3: Immunofluorescence image of staining with p62, LC3 and LAMP1 at the timepoints t0,t1 and t7
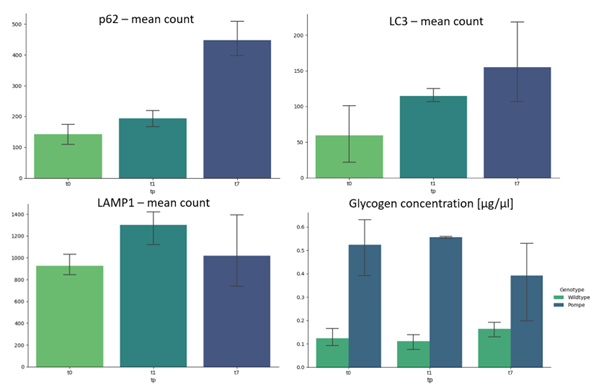
Figure 4: Preliminary counting of positive stainings with cellpose shows increase of p62 and LC3, while LAMP1 already shows a high presence at t0 in Pompe mice. Glycogen concentration is higher in Pompe compared to wildtype and consistent over the timepoints t0, t1 and t7. (n = 3)
DOI: https://doi.org/10.58530/2023/5366