5364
Modelling Whole-Lung and Regional Carbon Monoxide Transfer Factor with Hyperpolarized 129Xe MRI in Asthma and COPD Patients
Jemima H Pilgrim-Morris1, Laurie J Smith1, Joshua R Astley1,2, Laura C Saunders1, Guilhem J Collier1, Alberto M Biancardi1, Bilal A Tahir1,2,3, Helen Marshall1, Latife Hardaker4, Titti Fihn-Wikander5, Rod Hughes6, Roger Thompson1, Neil J Stewart1, and Jim M Wild1,3
1POLARIS, Department of Infection, Immunity and Cardiovascular Disease, University of Sheffield, Sheffield, United Kingdom, 2Department of Oncology and Metabolism, University of Sheffield, Sheffield, United Kingdom, 3Insigneo Institute for in silico Medicine, University of Sheffield, Sheffield, United Kingdom, 4Priory Medical Group, York, United Kingdom, 5Evidence Delivery, BioPharmaceuticals Medical, BioPharmaceuticals Business Unit, AstraZeneca, Gothenburg, Sweden, 6Clinical Development, Research and Early Development, Respiratory & Immunology, AstraZeneca, Cambridge, United Kingdom
1POLARIS, Department of Infection, Immunity and Cardiovascular Disease, University of Sheffield, Sheffield, United Kingdom, 2Department of Oncology and Metabolism, University of Sheffield, Sheffield, United Kingdom, 3Insigneo Institute for in silico Medicine, University of Sheffield, Sheffield, United Kingdom, 4Priory Medical Group, York, United Kingdom, 5Evidence Delivery, BioPharmaceuticals Medical, BioPharmaceuticals Business Unit, AstraZeneca, Gothenburg, Sweden, 6Clinical Development, Research and Early Development, Respiratory & Immunology, AstraZeneca, Cambridge, United Kingdom
Synopsis
Keywords: Hyperpolarized MR (Gas), Lung, Modelling
Hyperpolarized 129Xe ventilation and dissolved-phase MRI metrics were used to predict the carbon monoxide transfer factor (TLCO) in the lungs of patients with asthma and/or Chronic Obstructive Pulmonary Disease (COPD) using two linear regression models: (1) an existing analytical model based on physiology and (2) a machine learning model, which also included patient age and sex in the prediction. The machine learning model was further extended to create TLCO maps, providing a regional visualization of this gold standard measure of gas transfer.Background
Wang et al. recently proposed an analytical model which uses hyperpolarized 129Xe dissolved-phase and ventilation imaging metrics to predict whole-lung transfer factor for carbon monoxide (TLCO)1; the clinical gold standard metric of pulmonary gas exchange. The model was built on data from healthy volunteers and patients with a range of obstructive, restrictive and pulmonary-vascular lung diseases. Ventilated volume (VV) and relative membrane (M):Gas and red blood cell (RBC):Gas signal ratios (normalized by healthy reference values) derived from 129Xe MRI were used alongside the alveolar volume (VA) and transfer coefficient (KCO) from pulmonary function testing to calculate linear regression coefficients (kV, kM and kR) using the following relationships:$$ \mathrm{V_A} = \mathrm{k_V VV} \tag{1}$$
$$ \frac{1}{\mathrm{K_{CO}}} = \frac{1}{\mathrm{k_M} \mathrm{M:Gas_{rel}}} + \frac{1}{\mathrm{k_R RBC:Gas_{rel}}} \tag{2}$$
The product of Equations 1 and 2 yields TLCO:
$$ \mathrm{TL_{CO}} = \mathrm{V_A K_{CO}} \tag{3}$$
We applied this model to data from a large cohort of patients with asthma and/or Chronic Obstructive Pulmonary Disease (COPD), using a rigorous testing and training validation strategy to find the regression coefficients. In addition, an alternative linear regression model was developed using machine learning (ML), and was then applied to create parametric maps of TLCO .
Methods
VV from 3D SSFP 129Xe ventilation imaging2 and RBC:Gas and M:Gas from 3D dissolved-phase 129Xe IDEAL spectroscopic imaging3 were acquired at functional residual capacity (FRC) +1L (or less, depending on height) using a 1.5T whole-body clinical MRI scanner (GE HDx) and a 129Xe transmit-receive vest coil. Data acquired from 150 participants from the NOVELTY asthma and COPD study (NCT02760329)4 were retrospectively analyzed. These data were initially fitted to Equations 1-3 using the coefficients from Wang et al1 and then the model was refined by recalculating these on our dataset. The data were partitioned via stratified five-fold cross-validation (Figure 1a) and the coefficients were found by fitting Equations 1 and 2 to each training group with a least-squares solver to minimize the mean squared error (MSE).Features for the ML model (Figure 1b) were chosen based on Equations 1 and 2, with the addition of age and sex. M:Gas was removed from the model due to its correlation with RBC:Gas. VA and KCO were predicted using separate linear regression algorithms using the scikit-learn toolbox in Python5. 23 patients post hospitalization with COVID-19 pneumonia6 were used as an external validation group. To estimate patient-specific maps of TLCO, the ML prediction equations (Figure 1c) were used with the RBC:Gas map and a ventilation map determined from the IDEAL gas images (Figure 1d).
Results
Patient demographics are shown in Table 1 and linear regression and Bland-Altman plots are shown in Figure 2. The coefficients from Wang et al1 did not fit our data well, likely due to differences in MRI acquisition strategies and patient disease aetiologies (Figure 2a). The average coefficients recalculated for our dataset across the five test folds were: kV=1.21±0.01, kR=2.64±0.16 mmol min-1kPa-1L-1 and kM=3.80±0.23 mmol min-1kPa-1L-1. These significantly improved the model fitting accuracy (Figure 2b). Further improvement was made using ML and adding age and sex as independent variables in the linear regression (Figure 2c). Using this approach to estimate TLCO for the patients post-COVID-19 hospitalization resulted in a good fit (Figure 2d). Representative TLCO map slices are shown in Figure 3.Discussion
Both the physiological and ML models were able to estimate TLCO from 129Xe imaging metrics for patients with asthma and/or COPD. The linear regression coefficients differed from those in 1 (kV=1.47, kR=4.55 mmol min-1kPa-1L-1 and kM=3.55 mmol min-1kPa-1L-1), likely due to differences in the patient cohorts, and we found kM > kR, which suggests a greater contribution to the total impedance from the membrane than the capillary blood or ventilation-perfusion mismatch. kV > 1, i.e. VA > VV, is expected because VA and VV were measured at different lung volumes (TLC and FRC+1L, respectively). Equation 1 may not be appropriate in obstructive lung disease due to complicated lung volume-dependent pathophysiology, which may explain the high limits of agreement in Figure 2b. The ML model performed better at predicting VA; MSE=0.315±0.113 compared to 0.91±0.08. The best results were found when VV values acquired at TLC were used (MSE=0.188±0.064, n=134); however, these were not available for IDEAL imaging.The addition of age and sex in the ML model reduced the MSE compared to the physiological model. The effect of age on 129Xe gas exchange measures is well-known, and sex was recently shown to significantly affect gas exchange metrics7,8. The ML model allows TLCO to be visualized regionally, which may provide a way for respiratory physicians to easily interpret 129Xe gas exchange MRI. However, these maps currently underestimate TLCO, because pixels with very low RBC:Gas would return negative values; this is a limitation of our approach.
Conclusion
Using a previously proposed analytical framework and a linear regression ML algorithm, TLCO was modelled from the 129Xe MRI-derived VV, RBC:Gas, M:Gas, patient age and sex. The ML model was then used to map TLCO across the lung, providing a regional representation of this lung function metric. Future work will focus on improving prediction accuracy, e.g. by using more advanced ML algorithms.Acknowledgements
J.H.P-M is supported by a studentship from the MRC Discovery Medicine North (DiMeN) Doctoral Training Partnership. The work was supported by AstraZeneca and the MRC.References
1. Z.Y. Wang et al., Using hyperpolarized Xe-129 gas-exchange MRI to model the regional airspace, membrane, and capillary contributions to diffusing capacity. Journal of Applied Physiology, 130(5):1398–1409, 2021.2. N.J. Stewart et al., Feasibility of human lung ventilation imaging using highly polarized naturally abundant xenon and optimized three-dimensional steady-state free precession. Magn Reson Med, 2015. 74(2): p. 346-52.
3. G.J. Collier et al., Dissolved (129) Xe lung MRI with four-echo 3D radial spectroscopic imaging: Quantification of regional gas transfer in idiopathic pulmonary fibrosis. Magn Reson Med, 2021. 85(5): p. 2622-2633.
4. H.K. Reddel et al., Prospective observational study in patients with obstructive lung disease: Novelty design. ERJ Open Research, 5(1):00036–2018, 2019
5. F. Pedregosa et al.,. Scikit-learn: Machine learning in Python. Journal of Machine Learning Research, 12:2825–2830, 2011
6. L.C. Saunders et al.,. Longitudinal lung function assessment of patients hospitalised with COVID-19 using 1H and 129Xe lung MRI. medRxiv, page 2022.04.06.22272747, 2022.
7. G.J. Collier et al., Age and lung volume dependence of dissolved xenon-129 imaging parameters. In Proceedings of the 31st Annual Meeting of ISMRM, page 1174, London, UK, 2022
8. D. Mummy et al., Hyperpolarized 129Xe MRI and spectroscopy in healthy control subjects reveals age-related changes in measurements of pulmonary gas exchange. In Proceedings of the 31st Annual Meeting of ISMRM, page 1168, London, UK, 2022
Figures
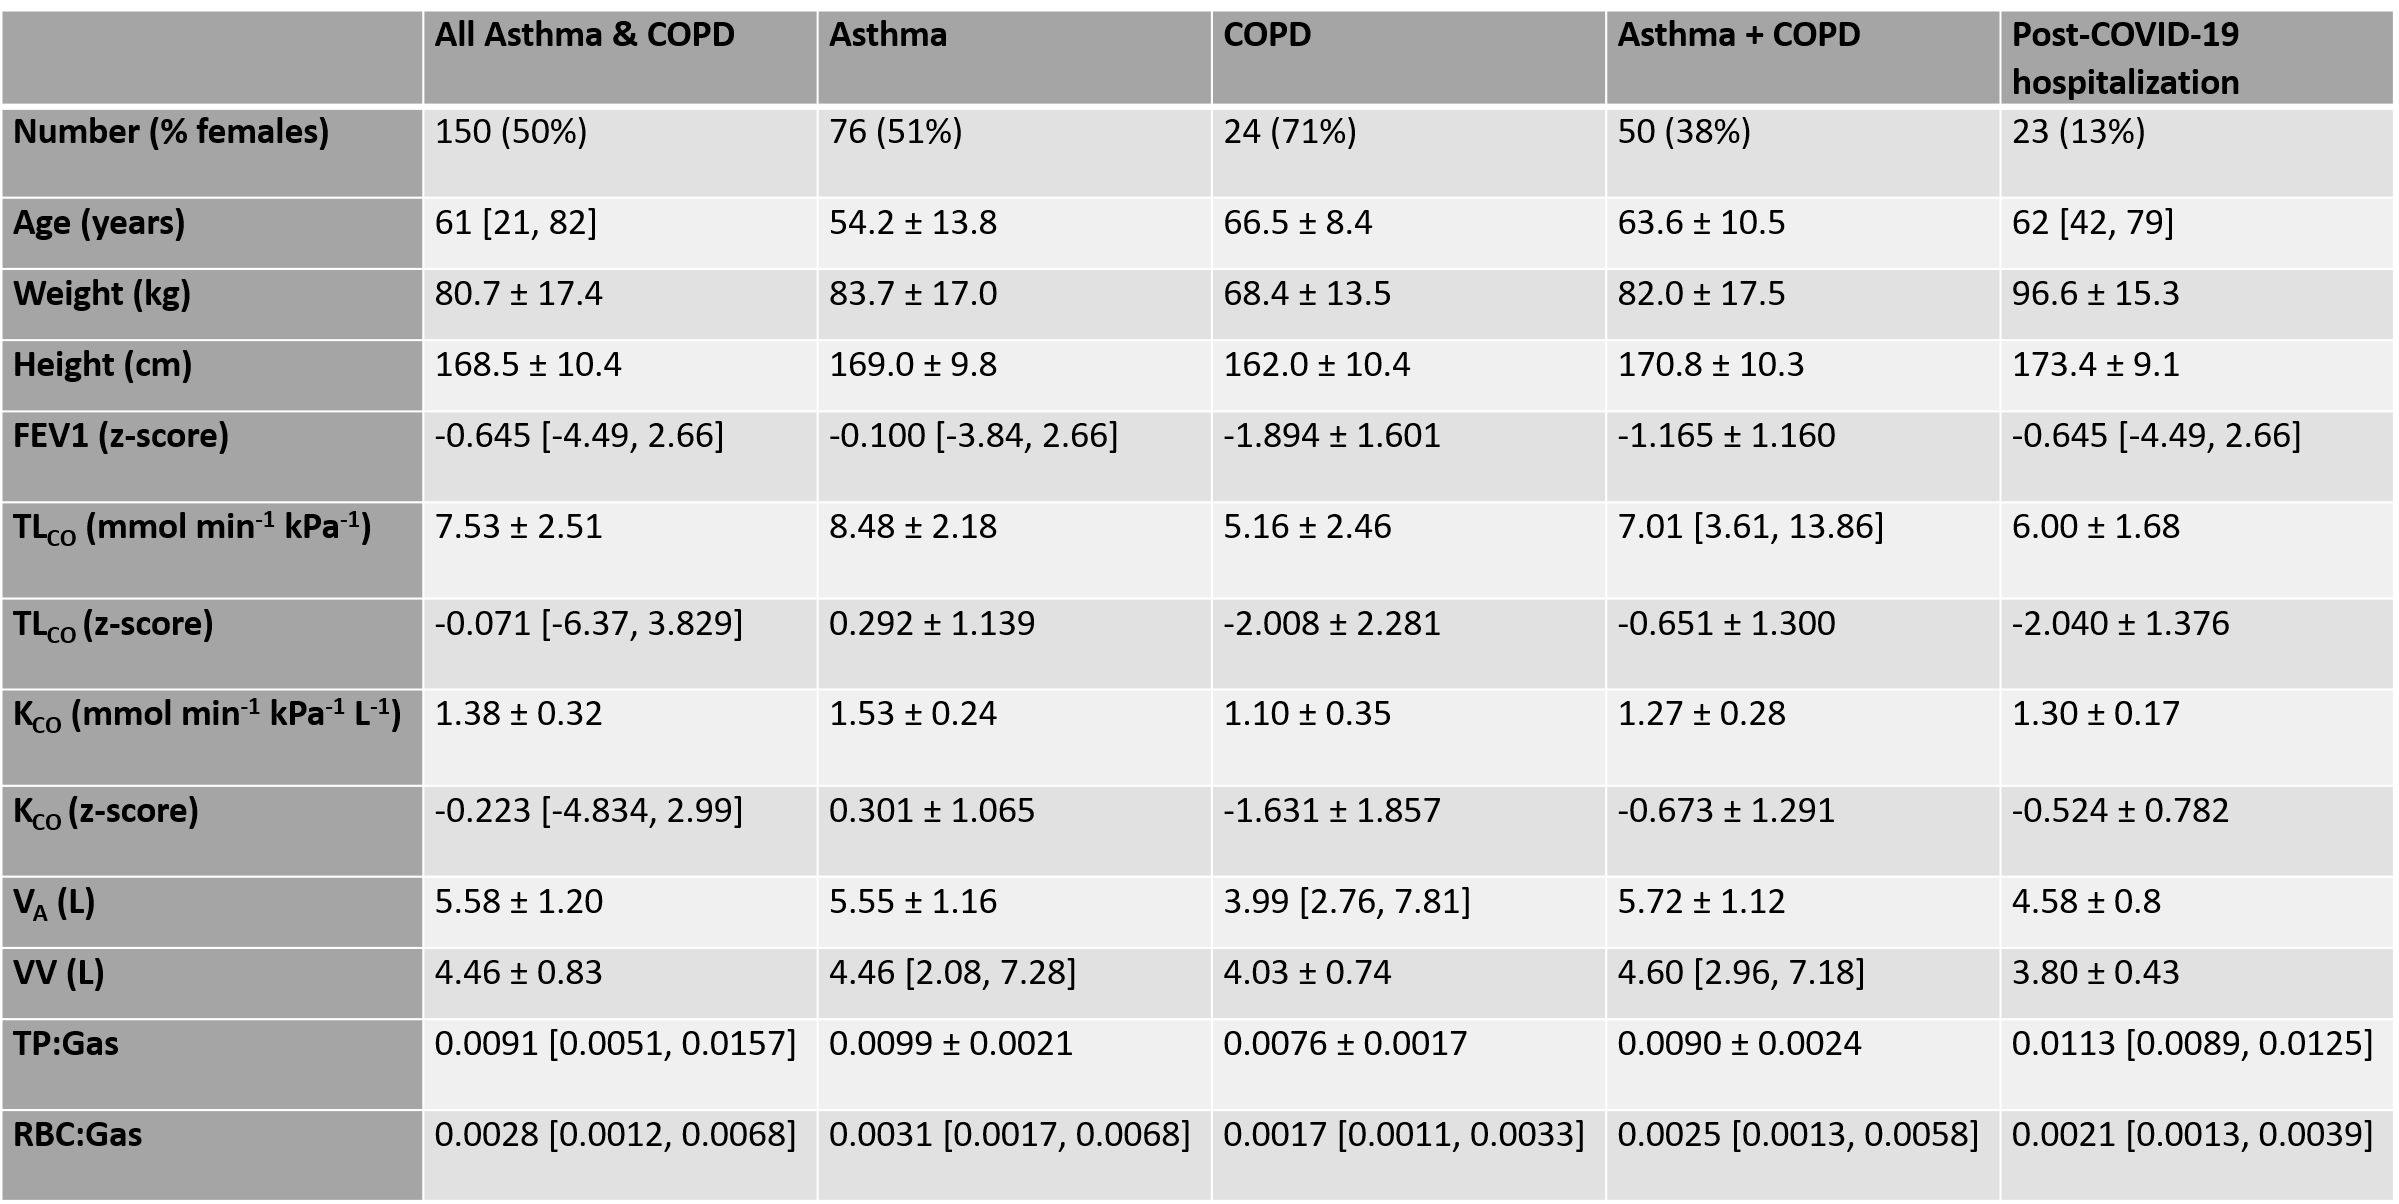
Table 1: Demographics, pulmonary function test and 129Xe MRI results for the different subject cohorts. Normally distributed variables are given as mean ± standard deviation, non-normal variables are given as median [min, max]. Normality was tested for with a Shapiro-Wilk test. FEV1 = forced expiratory volume in one second.
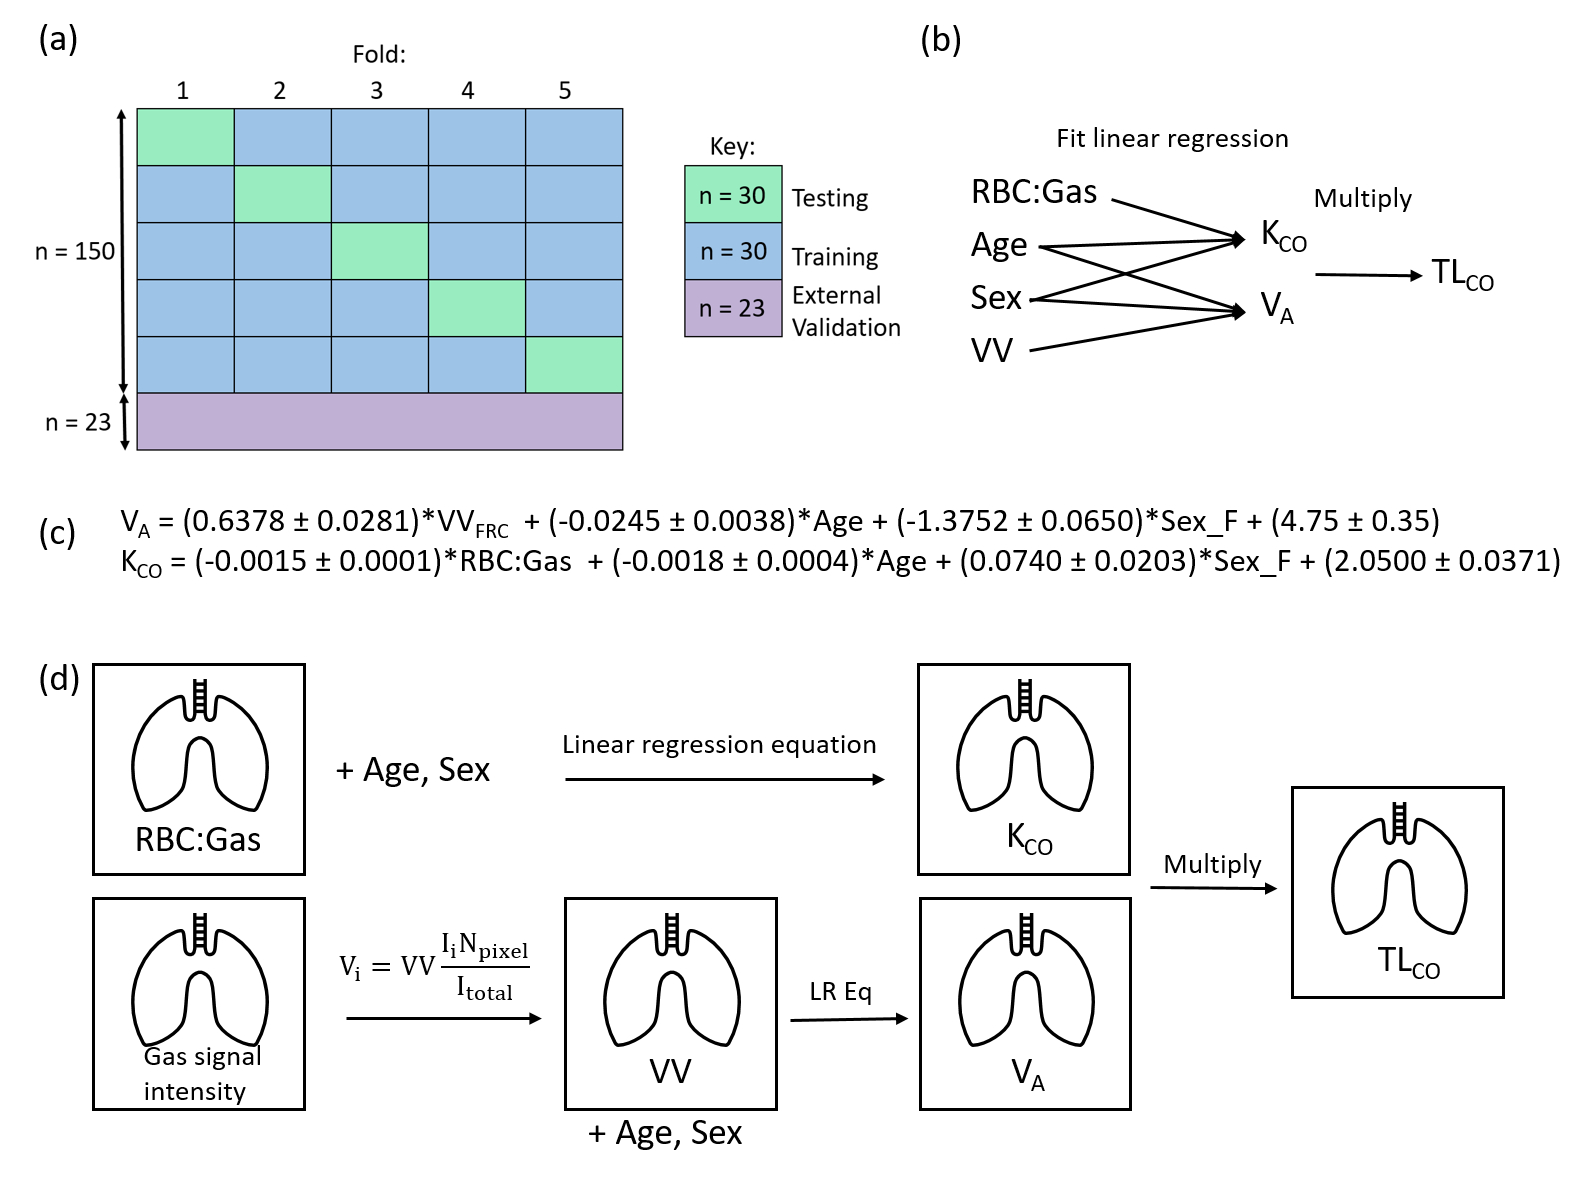
Figure 1: Schematic of our methodological approach (a) stratified five-fold cross-validation (b) structure of the ML linear regression (c) ML-derived predictive linear regression equations (d) TLCO mapping workflow. For VA, the gas signal intensity map was converted to a map of effective VV; gas signal at each pixel was divided by the mean signal and multiplied by VV from ventilation imaging to transform the data into suitable units (L). The VA and KCO maps were then multiplied pixel-wise to map TLCO.
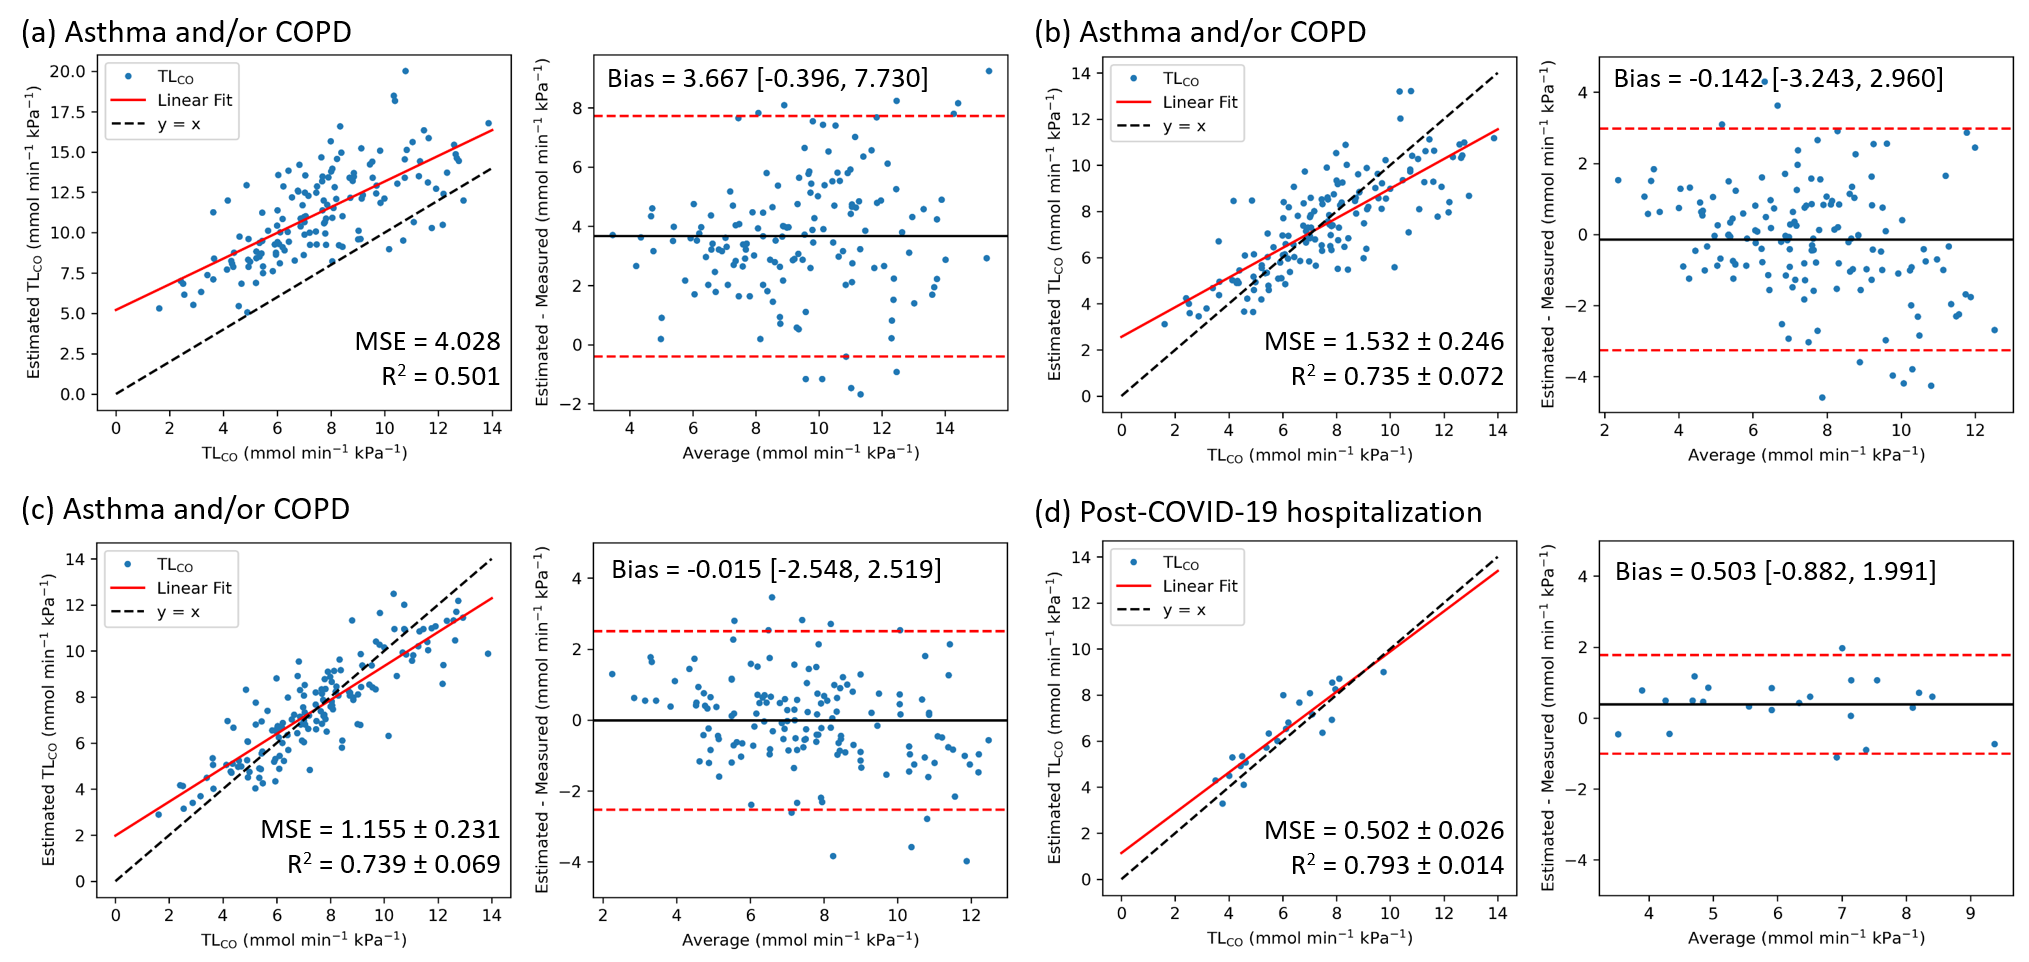
Figure 2: Linear regression and Bland-Altman plots for TLCO estimated using (a) Wang et al.’s model (b) Wang et al.’s model, with coefficients refitted for our patients, (c-d) the ML linear regression algorithm where (d) shows the external validation group. MSE = mean squared error, R2 = coefficient of determination, Bias = mean difference between estimated and measured TLCO [lower limit of agreement, upper limit of agreement], (b-d) shown as the mean values across the five folds.
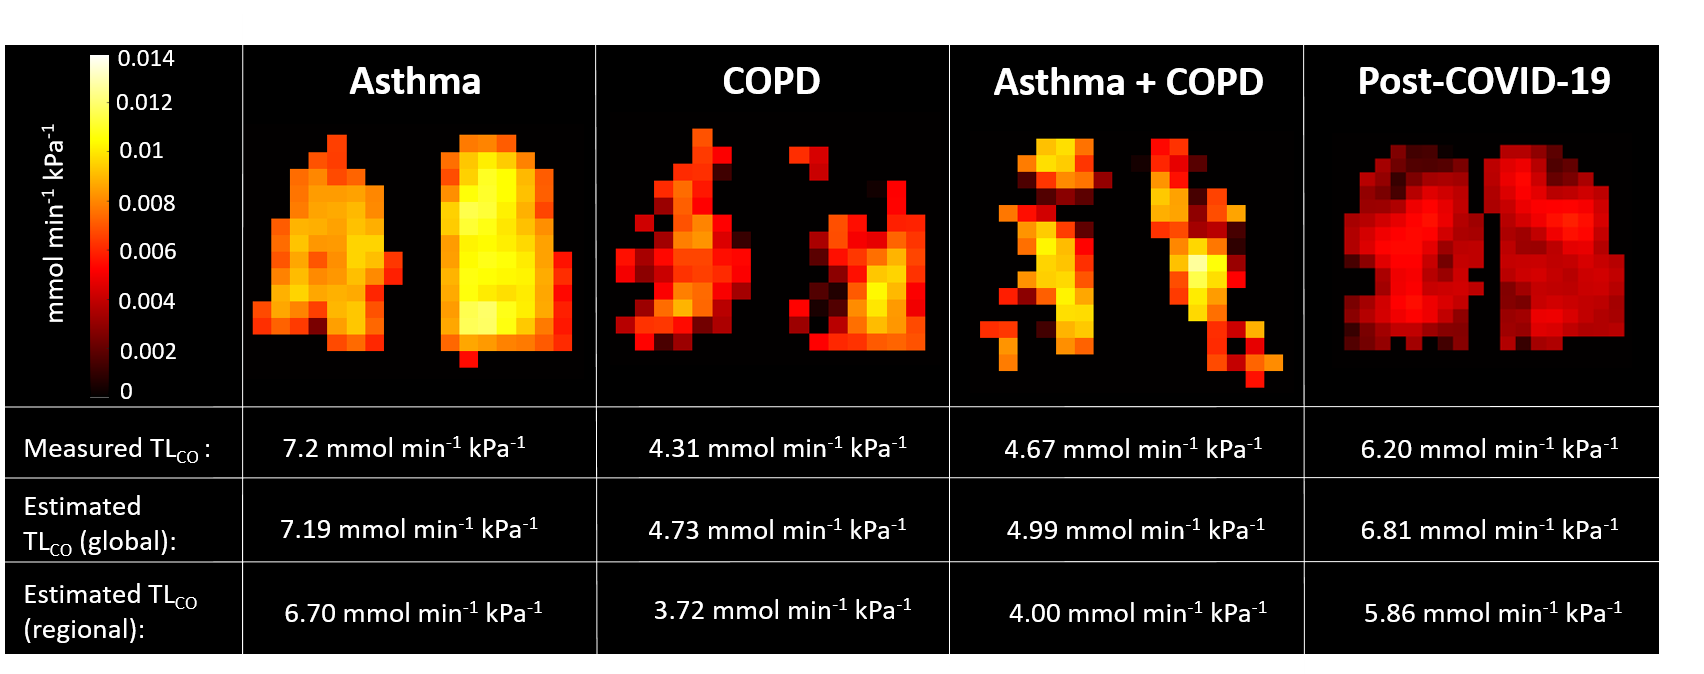
Figure 3: Representative slices from the TLCO maps generated using the ML model for four subjects from different disease groups. The measured and estimated TLCO values for each patient are given, where the regional estimate is the sum of the TLCO values over each pixel.
DOI: https://doi.org/10.58530/2023/5364