5361
Validation of Intravoxel Incoherent Motion (IVIM) as a surrogate marker of vascular density in a rat model of co-morbidities1Department of Cardiovascular Sciences, University of Leuven, Leuven, Belgium, 2Department of Imaging and Pathology, University of Leuven, Leuven, Belgium, 3Department of Cardiology, Maastricht University, Maastricht, Netherlands
Synopsis
Keywords: Vessels, Blood vessels
We assessed whether Intravoxel Incoherent Motion (IVIM) MRI measurements can detect differences in cerebral vascular density obtained by quantitative immunohistochemistry. In vivo IVIM measurements were correlated with invasive measurements of the microvascular density in a rat model of vascular comorbidities. Our results indicate that IVIM can be used to indirectly measure difference in the vascular density of different brain regionsIntroduction:
Decreases in the cerebral microvascular density, called microvascular rarefaction, is a key component in several neurodegenerative disorders linked to the presence of vascular comorbidities such as hypertension, Type 2 Diabetes Mellitus, obesity and aging. Direct non-invasive measurements of the brain microvascular density remain challenging. Microvascular alterations can be measured indirectly using perfusion MRI techniques1. Intravoxel Incoherent Motion (IVIM)², is a diffusion weighted MRI technique that may provide complementary information to the classical perfusion MRI techniques. However, more research is needed to better understand the physiological meaning of the IVIM read-outs. The aim of this study is to validate IVIM measurement with invasive immunohistochemical measurements of the microvascular density in a rat model of vascular comorbidities.Methods:
AnimalsMale lean and obese Zucker diabetic fatty/Spontaneously hypertensive F1 hybrid (ZSF1) rats were obtained from Charles River. ZSF1 Obese rats are hypertensive and have Type 2 Diabetes Mellitus, whereas ZSF1 Lean rats are only hypertensive. The experiments were conducted at 14 weeks (lean N=3, obese N=3), 20 weeks (lean N=5, obese N=5) and 30 weeks of age (lean N=7, obese N=6). Animal experiments were approved by the local animal ethics committee and performed according to national and European legislation.
MRI experiments
MRI data was acquired using a horizontally 9.4 Tesla preclinical MRI scanner (Biospec, Bruker Biospin) equipped with a 600mT/m actively shielded gradient coil system, a volume coil (72 mm inner diameter) for transmission and a decoupled 1H receive-only 2x2 rat brain surface array coil.
A Stejskal-Tanner Single-shot Diffusion weighted segmented Spin-echo Echo Planer Imaging pulse sequence was used for the IVIM measurements using the following parameters: TR/TE = 2000/19.9 ms; 14 coronal slices; FOV 35x35mm²; 0.273x0.273mm isotropic voxel resolution; 1mm slice thickness; gradient duration = 2ms; gradient separation = 11.3ms; 4 averages; 6 uniformly distributed diffusion directions; 18 b-values (10, 20, 30, 40, 50, 60,70, 80,90, 100, 150, 200, 300, 500,600, 700, 800, 1000 s/mm²); acquisition time 58min 8sec.
MRI data analysis was performed using Matlab. Parametric maps were calculated by fitting the diffusion weighted signal attenuation for each voxel using a two-step fitting approach. First, the diffusion component of the signal is fitted for the diffusion coefficient (D) using a mono-exponential diffusion model (Fig. 1A). Next, the signal attenuation from all b-values is fitted for the pseudo-diffusion coefficient (D*) and flowing blood fraction (fIVIM) using a bi-exponential model (Fig. 1B).
Validation by immunohistochemistry
In order to label perfused vessels, the animals received an intravenous injection of Biotinylated Tomato Lectin. After 5 minutes of circulation, the animals were euthanized and the brain was removed. The brain tissue was fixed in 4% paraformaldehyde for 24h. The brain samples were cut into 40µm coronal sections using a vibratome. Free-floating sections were incubated overnight with Alexa Fluor 647 Streptavidin. The samples were imaged using a Nikon-Märzhäuser Slide Express. The brain sections were acquired as a z-stack with 5 planes at 5 µm separation. The Z-stacks were projected along the Z-axis using a maximum intensity projection. Quantification of the cerebral vasculature was performed using an inhouse developed ImageJ macro (Fig. 2).
Results:
Regions of interest (ROIs) of the Cortex, Corpus Callosum and Hippocampus were manually delineated on the MR images and the slide scanner images. Average values of the IVIM parameters and vascular density were calculated for all ROIs. No significant age effect, nor group effect, was observed when comparing animals of 14, 20 and 30 weeks of age between the ZSF1 lean and ZSF1 obese animals (two-way ANOVA, Tukey’s HSD test). Furthermore, no significant differences between the ZSF1 lean (N=14) and ZSF1 obese (N=15) animals were observed when pooling the different timepoints for each group (Table 1). However, significant differences were observed between the different ROIs (two-way ANOVA, Tukey’s HSD test). Pearson correlation between the IVIM parameters and the vascular density were calculated for all animals and ROIs (Fig. 3). The vascular density significantly correlated with IVIM parameters D* (r = 0.4734; p<0.0001) and fIVIM (r = -0.5030; p<0.001), while no significant correlation was observed with D.Discussion & Conclusion
Our results showed no difference in both cerebral vascular density and IVIM parameters between lean and obese ZSF1 rats at any of the stages investigated. Though these animals did not show a difference in cerebral vascular density or IVIM parameters based on age or genotype, they did based on different brain regions. We took advantage of this to assess whether IVIM can detect differences in cerebral vascular density obtained by quantitative immunohistochemistry. Despite not being able to show difference between the two groups, our findings demonstrate that IVIM can be used to indirectly measure difference in vascular density in the brain. We found that cerebral vascular density positively correlated with D* and negatively correlated with fIVIM in the pooled data of the ZSF1 rat model. That no significant correlation was observed with D was expected as D is related to diffusion in the extracellular space.Acknowledgements
This research was funded by the European Union’s Horizon 2020 project ‘CRUCIAL’, (grant number 848109) and the European Union’s Horizon 2020 project ‘PANA’, (grant number 686009).References
[1] van Dinther M., Voorter PH., Jansen JF., Jones EA., van Oostenbrugge RJ., Staals J., Backes WH. Assessment of microvascular rarefaction in human brain disorders using physiological magnetic resonance imaging. J Cereb Blood Flow Metab. 2022 May;42(5):718-737. doi: 10.1177/0271678X221076557.
[2] Le Bihan D., Breton E., Lallemand D., Aubin M.L., Vignaud J., Laval-Jeantet M. Separation of diffusion and perfusion in intravoxel incoherent motion MR imaging. Radiology. 1988; 168:497–505. doi: 10.1148/radiology.168.2.3393671
Figures
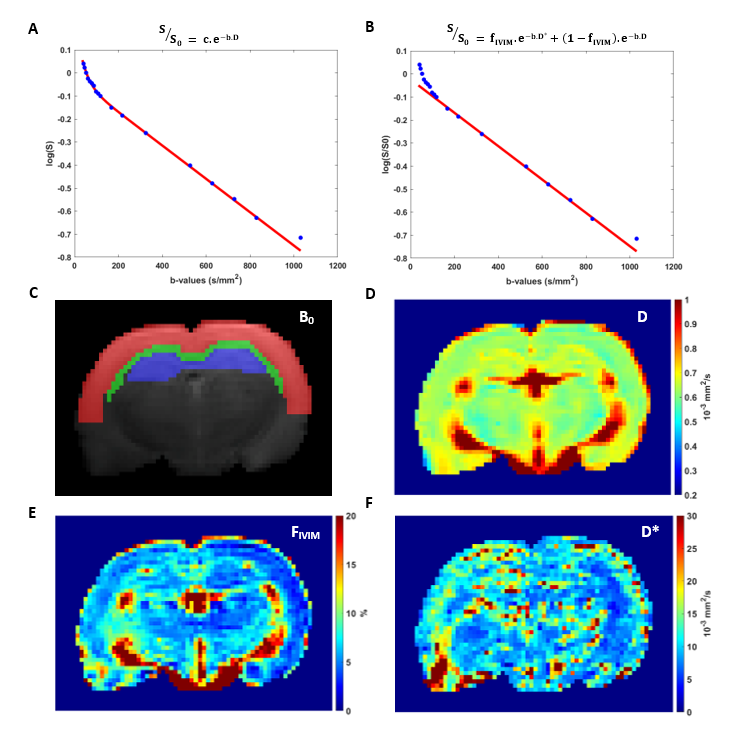
Figure 1: Estimation of the IVIM parameters using a two-step bi-exponential fitting approach. (A) Example of the mono-exponential fitting for the diffusion coefficient(D); (B) bi-exponential fitting of the signal attenuation for all b-values for the pseudo-diffusion coefficient (D*) and flowing blood fraction (fIVIM). (C) Manually delineated ROIs of the Cortex (red), Corpus Callosum (green), Hippocampus (blue) on top of the B0 image. (D-F) Voxel-wise parametric maps of the IVIM parameters.
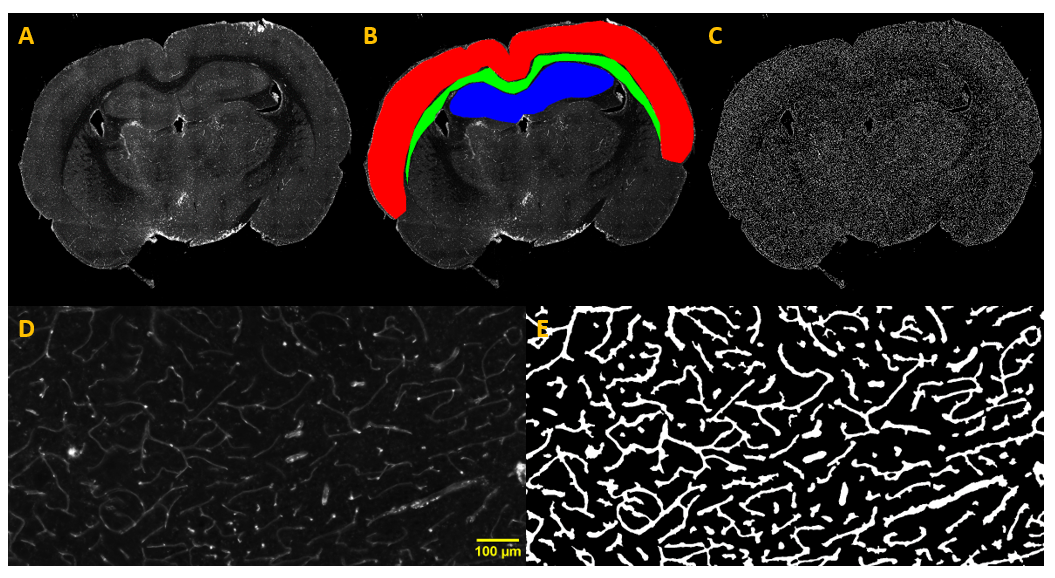
Figure 2: Example of the immunohistochemical visualization and quantification of the cerebral vasculature in a coronal rat brain section. (A) Representative coronal section; (B) Manually delineated ROIs of the Cortex (red), Corpus Callosum (green), Hippocampus (blue) on top of the representative coronal section; (C) Segmented of the vasculature of an entire coronal section; (D) High-magnification view of a region in the Cortex; (E) High-magnification view of the segmented vasculature in same region in the Cortex.
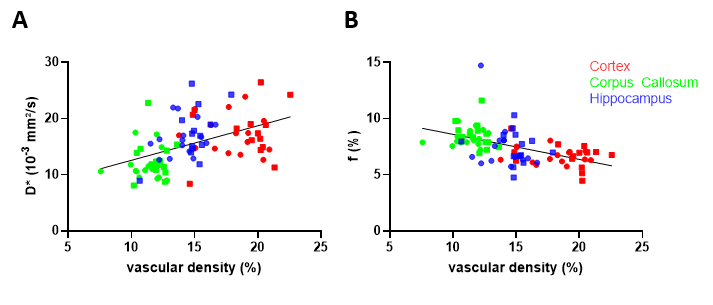
Figure 3: Pearson correlation between the mean IVIM parameters and average vascular density in three manually delineated ROIS (Cortex – blue, Corpus Callosum – green, Hippocampus, purple) including both ZSF1 lean rats (dots) and ZSF1 obese rats. (A) correlation between the pseudo-diffusion coefficient (D*) and the vascular density (r = 0.4734; p<0.0001); (B) correlation between the flowing blood fraction (fIVIM) and the vascular density (r = -0.5030; p<0.001).
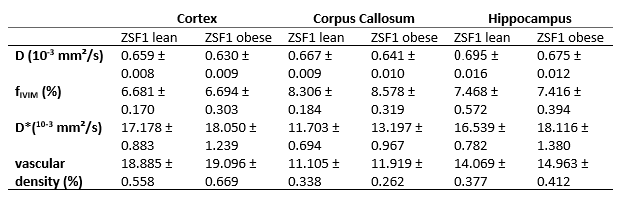
Table 1: Comparison of IVIM parameters and vascular density between ZSF1 lean rats and ZSF1 obese rats in three manually delineated ROIS (Cortex, Corpus Callosum, Hippocampus).