5357
Evaluation of renal injury in chronic kidney disease by Look-Locker T1 mapping1Zhongshan Hospital, Fudan University, Shanghai, China, 2MR Application Development, Siemens Shenzhen Magnetic Resonance Ltd., Shenzhen, China, 3MR Application Predevelopment, Siemens Healthcare GmbH, Erlangen, Germany
Synopsis
Keywords: Kidney, fMRI, chronic kidney disease;T1 mapping magnetic resonance imaging;renal injury
Accurate assessment of renal injury in chronic kidney disease (CKD) is significant for delaying the progression of CKD to end-stage renal disease. Previous studies have demonstrated the feasibility of Look-Locker T1 mapping in the assessment of renal function in healthy adults, but its application in the assessment of renal injury in CKD is still in the exploratory stage. Therefore, the purpose of this study was to investigate the value of T1 mapping in evaluating renal injury in CKD.
Summary of Main Findings
Look-Locker T1 mapping was feasible for assessing renal injury in CKD. Furthermore, Look-Locker T1 mapping had the potential for the noninvasive monitoring of the long-term changes in CKD.Introduction
Chronic kidney disease (CKD) is a global public health problem, and it is defined as abnormal renal function for at least 3 months [1]. The global prevalence of CKD is estimated to be 13.4%, and the number of patients with end-stage renal disease (ESRD) requiring renal replacement therapy ranges from 4.9 million to 7.08 million [2]. The early diagnosis of CKD and accurate assessment of renal injury are significant for delaying the progression of CKD to ESRD. Currently, the estimated glomerular filtration rate (eGFR) is calculated by detecting serum creatinine to evaluate renal function of CKD. However, eGFR has limited value for the assessment of left and right unilateral renal function, and it is also affected by age, sex, weight and other factors. We believe that if the function of left and right unilateral kidney can be accurately evaluated, it can make up for the deficiency of eGFR, which is important for evaluating therapeutic effect and long-term follow-up of CKD. T1 mapping is a noninvasive technique for quantitative measurement of tissue T1 value, which is widely used in the evaluation of myocardial fibrosis and hepatic fibrosis [3, 4]. A previous study confirmed the feasibility of T1 mapping in the assessment of renal function in healthy adults [5], but its application in the assessment of renal injury in CKD is still in an exploratory stage. Therefore, the purpose of this study was to investigate the value of Look-Locker T1 mapping in evaluating renal injury in CKD.Methods
This prospective study included 80 subjects (60 CKD patients and 20 healthy volunteers). A 3T MRI system (MAGNETOM Prisma; Siemens Healthcare, Erlangen, Germany) was used for MRI examinations. T1 mapping was acquired using the Look-Locker scheme, with a prototypic 2D inversion recovery snapshot FLASH sequence that generates T1 maps as part of the image reconstruction. The waiting time between subsequently acquired slices was set to 1000 ms, and the number of inversion contrast images was set to 32. The applied scan parameters were as follows: TR/TE = 3 ms/1.32 ms; slice thickness = 5 mm; slice gap = 1 mm; number of slices = 3; voxel size = 2.0 × 2.0 × 8.0 mm3; field of view = 380 × 308 mm2; matrix = 192 × 153; acceleration factor = 2. A breath-hold acquisition with 17 seconds scan time was performed. The T1 values of the right renal cortex and medulla were measured from the fitted maps. The serum creatinine (Scr) values of CKD patients were detected before the MRI examinations, and the eGFR of CKD patients was calculated according to the Chronic Kidney Disease Epidemiology Collaboration (CKD-EPI) formula [6]. All CKD patients were divided into two groups based on the eGFR, a mild renal injury group (eGFR≥60 ml/min/1.73m2) and a moderate-severe (m-s) renal injury group (eGFR<60 ml/min/1.73m2). Paired sample t test was used to compare T1 values between renal cortex and medulla in all participants. The differences in the renal parenchymal T1 values among the three groups were compared using a one-way analysis of variance (ANOVA). The diagnostic performance of the renal parenchymal T1 values in assessing renal injury degree in CKD was evaluated using receiver operating characteristic (ROC) curves. The Spearman correlation analysis was applied to assess the relationship between eGFR and renal parenchymal T1 values. All data were analyzed using SPSS (Version 22, IBM, Armonk, NY, USA) and MedCalc for Windows (version 15.8, Ostend, Belgium) software. Differences with p values < 0.05 were regarded statistically significant.Results
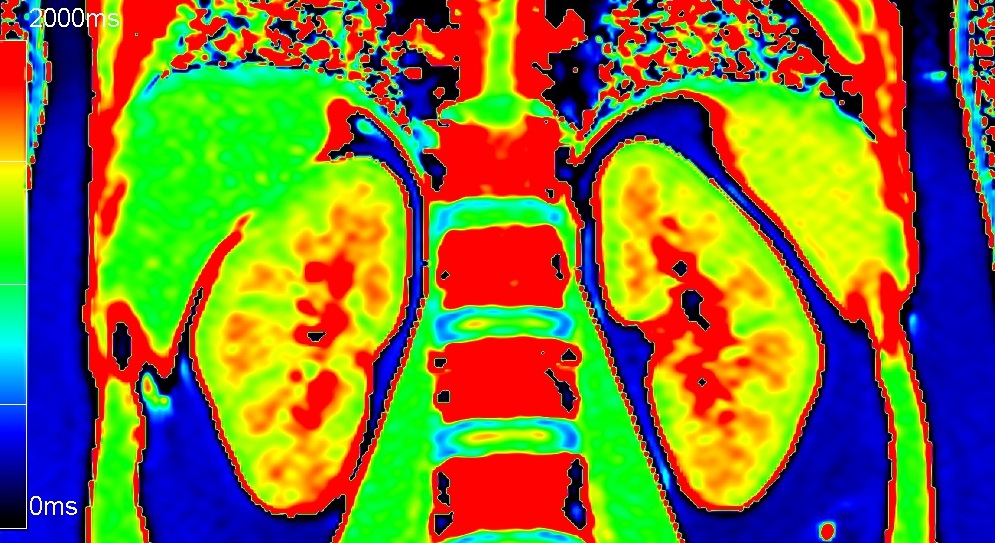
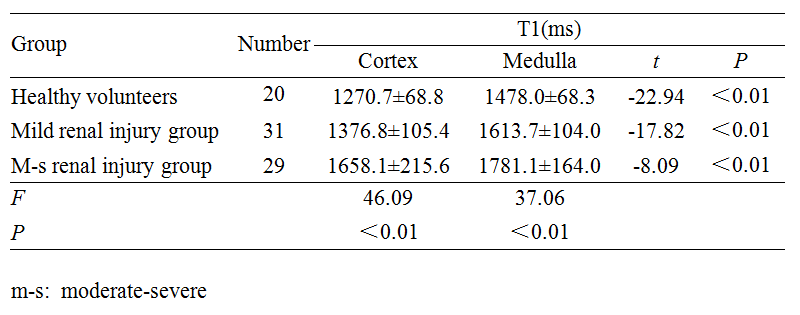
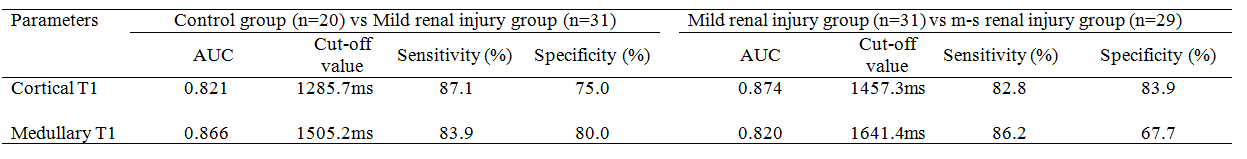
Figure 1 shows a representative example of T1 map. Table 1 displays renal parenchymal T1 values of the three groups. The renal medullary T1 value was remarkably higher than the renal cortical T1 value in all participants (P < 0.01). A significant difference was found for renal parenchymal T1 values among the three groups (P< 0.01). Renal parenchymal T1 values of the control and mild renal injury groups were significantly lower than those in the m-s renal injury group (P < 0.05). The results of the ROC curve analysis for renal parenchymal T1 values in evaluating renal injury degree are summarized in Table 2. There was a negative correlation between renal parenchymal T1 values (cortex, r = -0.773; medulla, r = -0.689, P < 0.01) and eGFR.Discussion and conclusion
In this study, the renal parenchymal T1 values had strong correlation with eGFR in CKD patients. The ROC curve analysis indicated that renal parenchymal T1 values had good diagnostic efficiency for distinguishing the mild and m-s renal injury groups and the control and mild renal injury groups. Therefore, our study results revealed that Look-Locker T1 mapping was feasible for assessing renal injury in CKD. Furthermore, Look-Locker T1 mapping had the potential for the noninvasive monitoring of the long-term changes in CKD.Acknowledgements
None
References
1. Levey A S, Coresh J. Chronic kidney disease[J]. Lancet, 2012,379(9811):165-180.
2. Lv J C, Zhang L X. Prevalence and Disease Burden of Chronic Kidney Disease[J]. Adv Exp Med Biol, 2019,1165:3-15.
3. Tunnicliffe E M, Banerjee R, Pavlides M, et al. A model for hepatic fibrosis: the competing effects of cell loss and iron on shortened modified Look-Locker inversion recovery T1 (shMOLLI-T1 ) in the liver[J]. J Magn Reson Imaging, 2017,45(2): 450 -462.
4. Bull S, White S K, Piechnik S K, et al. Human non-contrast T1 values and correlation with histology in diffuse fibrosis[J]. Heart, 2013,99(13):932-937.
5. Hu F B, Tang F, Che M J, et al. Quantitative study of kidney by T1 mapping magnetic resonance Imaging in normal adults [J]. Academic journal of Chengdu Medical University, 2015,10(6):661-664.
6. Levey A. S., Stevens L. A. and Schmid C. H. et al (2009) A new equation to estimate glomerular filtration rate. Ann Intern Med 150: 604-612.
Figures