5355
Standardized QC procedure for vendor-implemented ADC correction of gradient nonlinearity bias in multi-center clinical trials1Radiology, University of Michigan Health System, Ann Arbor, MI, United States, 2Radiology, University of Washington, Seattle, WA, United States, 3Medical Physics, Memorial Sloan Kettering Cancer Center, New York, NY, United States, 4Radiology and Biomedical Imaging, University of California San Francisco, San Francisco, CA, United States, 5GE Research Center, Niskayuna, NY, United States, 6Clinical Science, Philips Healthcare, Highland Heights, OH, United States, 7Philips Healthcare, Bothell, WA, United States, 8Clinical Science, Philips, Best, Netherlands, 9Radiology, Memorial Sloan Kettering Cancer Center, New York, NY, United States
Synopsis
Keywords: Cancer, Diffusion/other diffusion imaging techniques, ADC measurement accuracy, system gradient nonlinearity correction, multi-center oncology imaging trials
Gradient nonlinearity (GNL) induces spatial bias in diffusion b-value that confounds apparent diffusion coefficient (ADC) measurements for anatomy offset from MRI scanner isocenter. For emerging vendor-provided GNL correction (GNC) a standardized quality control (QC) procedure is desired to streamline GNC application for multi-site imaging trials that utilize ADC for tumor monitoring and therapy response assessment. This QC procedure was developed and tested on four MRI scanner systems with vendor-provided on-line ADC GNC for trial-specific phantoms and patient scans for head-and-neck, breast, and myelofibrosis cancers.Introduction
Ongoing clinical trials evaluate apparent diffusion coefficient (ADC) for tumor treatment response assessment and monitoring disease progression1,2. Gradient nonlinearity (GNL) bias in b-value confounds ADC measurements for anatomy offset from scanner isocenter3,4. Previous work has demonstrated the stability of system GNL characteristics5 that warrants on-scanner GNL correction (GNC) for ADC based on vendor specific gradient design parameters6. Recently emerging on-scanner ADC GNC implementations require quality control (QC) procedures practical in clinical trial settings for timely performance evaluation. This work demonstrates the implementation of a standardized QC procedure for ADC GNC on clinical MRI scanners across four cancer imaging trials (in breast, bone marrow and head & neck) that use anatomy-specific DWI QC phantoms.Methods
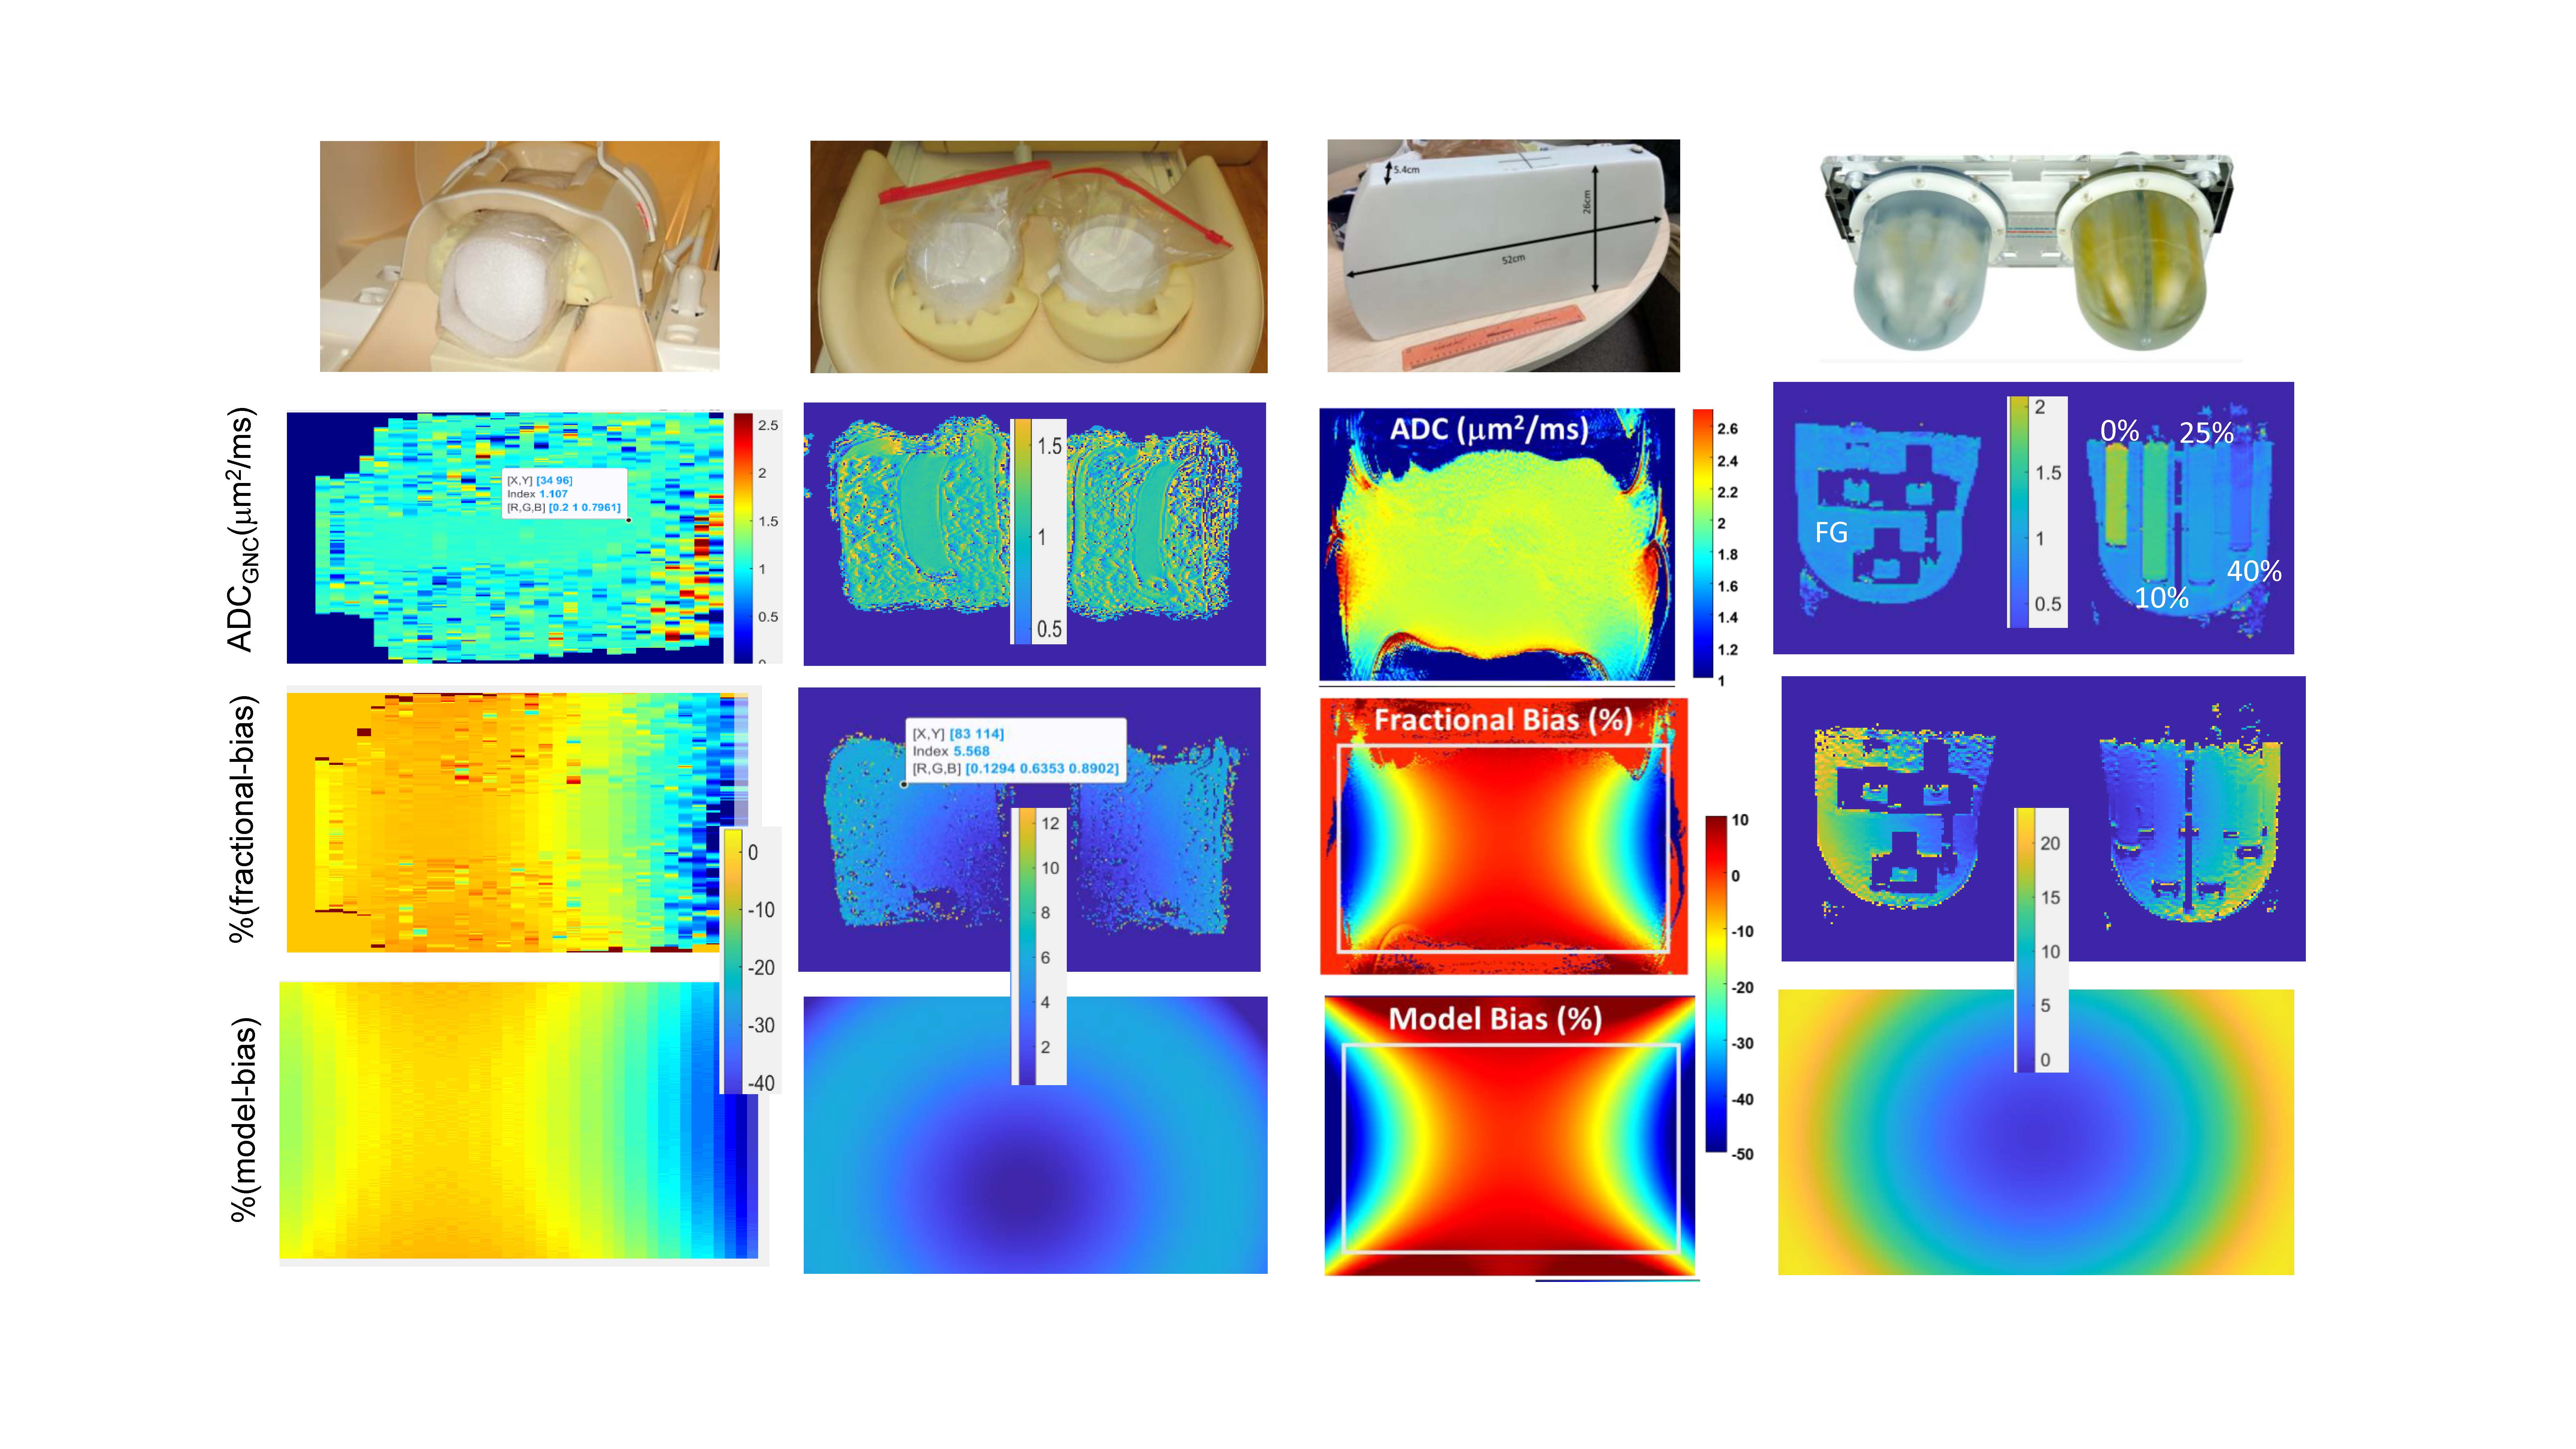
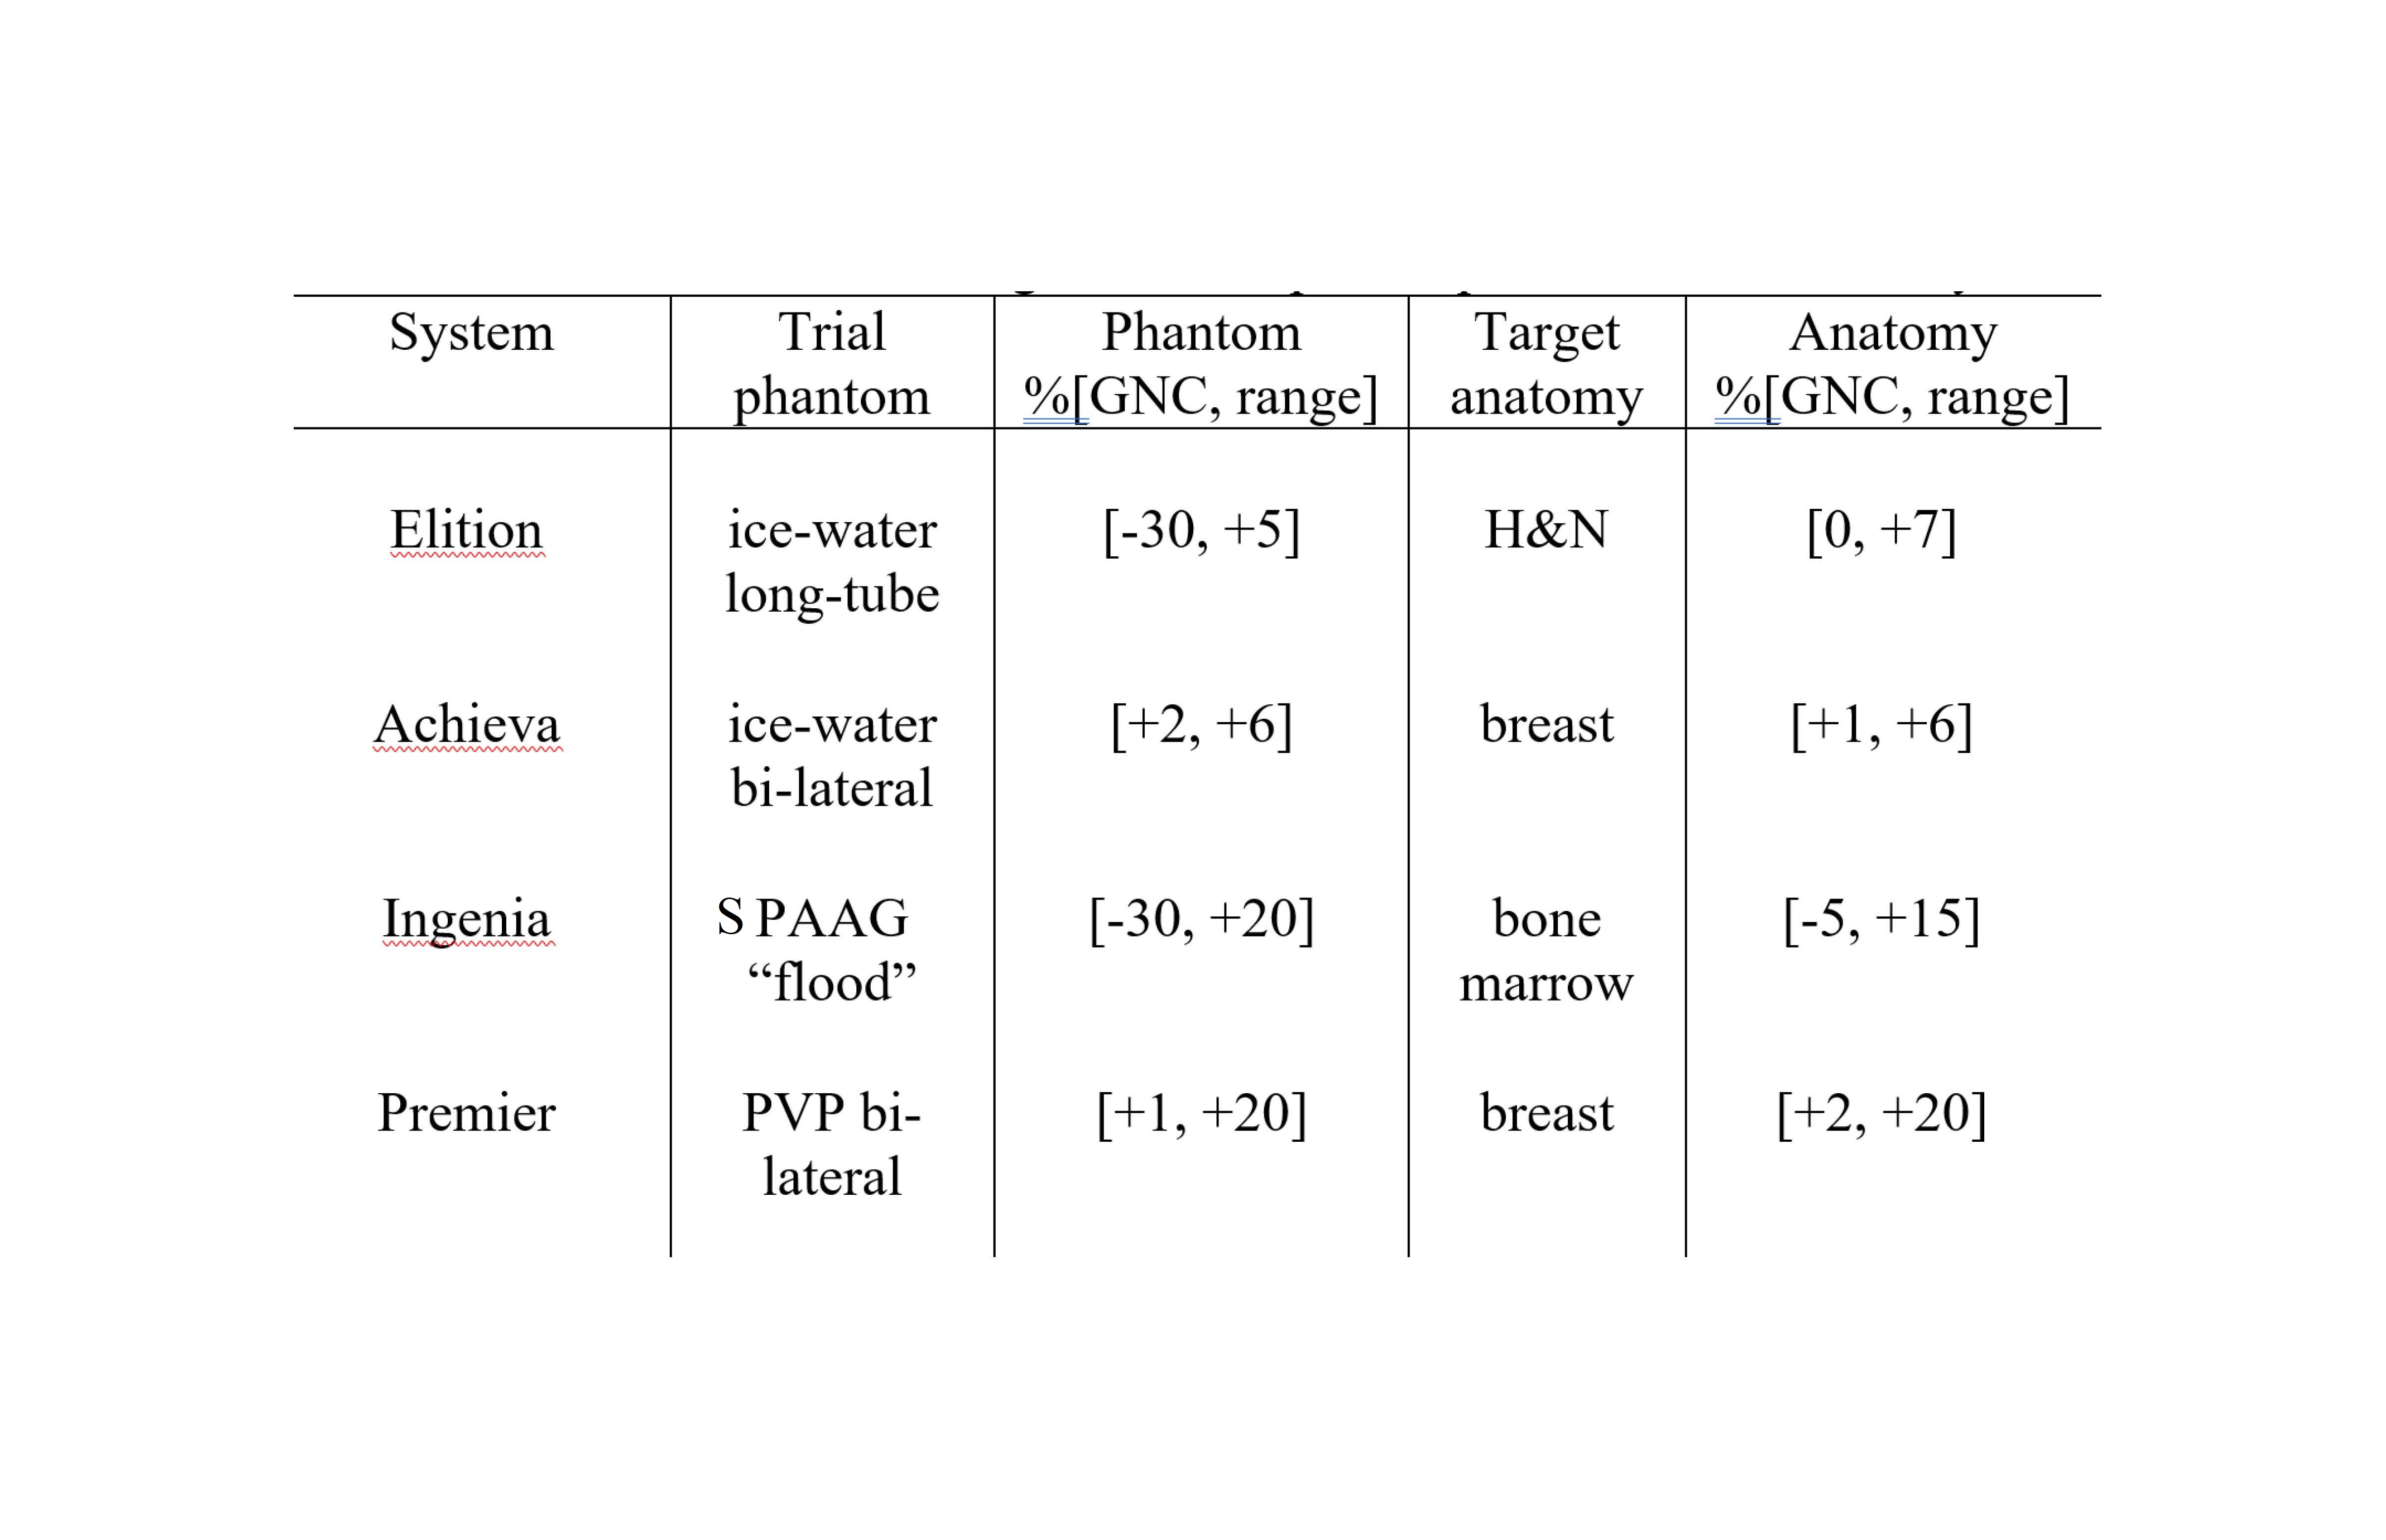
On-scanner GNC for clinical trials: ADC GNC7,8 was implemented by vendors on four clinical 3T MRI scanners with distinct gradient models (Table 1). These scanners are used by Academic-Industrial Partnership (AIP) imaging centers for their respective clinical trials that evaluate ADC for: head & neck (H&N, cancer therapy response)9, myelofibrosis (MF, bone marrow cancer monitoring)10, breast cancer (contrast-free diagnosis and therapy response assessment)1,2. The sites scanned their respective DWI QC phantoms based on ice-water and ambient-temperature water in sodium polyacrylate gel (SPAAG, “flood” phantom) and in polyvinylpyrrolidone (PVP, breast-phantom by CaliberMRI, Boulder, CO) materials. The patient DWI scans were performed according to trial-specific DWI protocols that included b-values=0,100,300,800s/mm2 with single-shot (ss) or multi-shot (ms) EPI acquisitions.ADC GNC analysis: ADC maps were generated on scanner consoles with and without GNC for phantoms and trial subjects. The QC assessment tools were shared with the sites as Matlab (R2019b, Mathworks, Natick, MA) p-code libraries. Sites calculated fractional-bias maps, %ADC bias = 100% (ADC– ADCGNC) / ADCGNC and b-value correction maps in scan DICOM coordinates8 in ITK meta-image header (MHD) format. Qualitative comparisons were performed between fractional bias and b-value correction maps to QC consistent GNC patterns. The constructed ADC and gradient model-bias maps (MHDs) were shared with a central analysis site for quantitative evaluation. To assess absolute accuracy, corrected ADCGNC was compared to ground-truth ADC values11,12 for phantoms. For patients, the fractional bias maps were compared to gradient-model b-value correction maps to confirm adequate GNC performance.
Results and Discussion
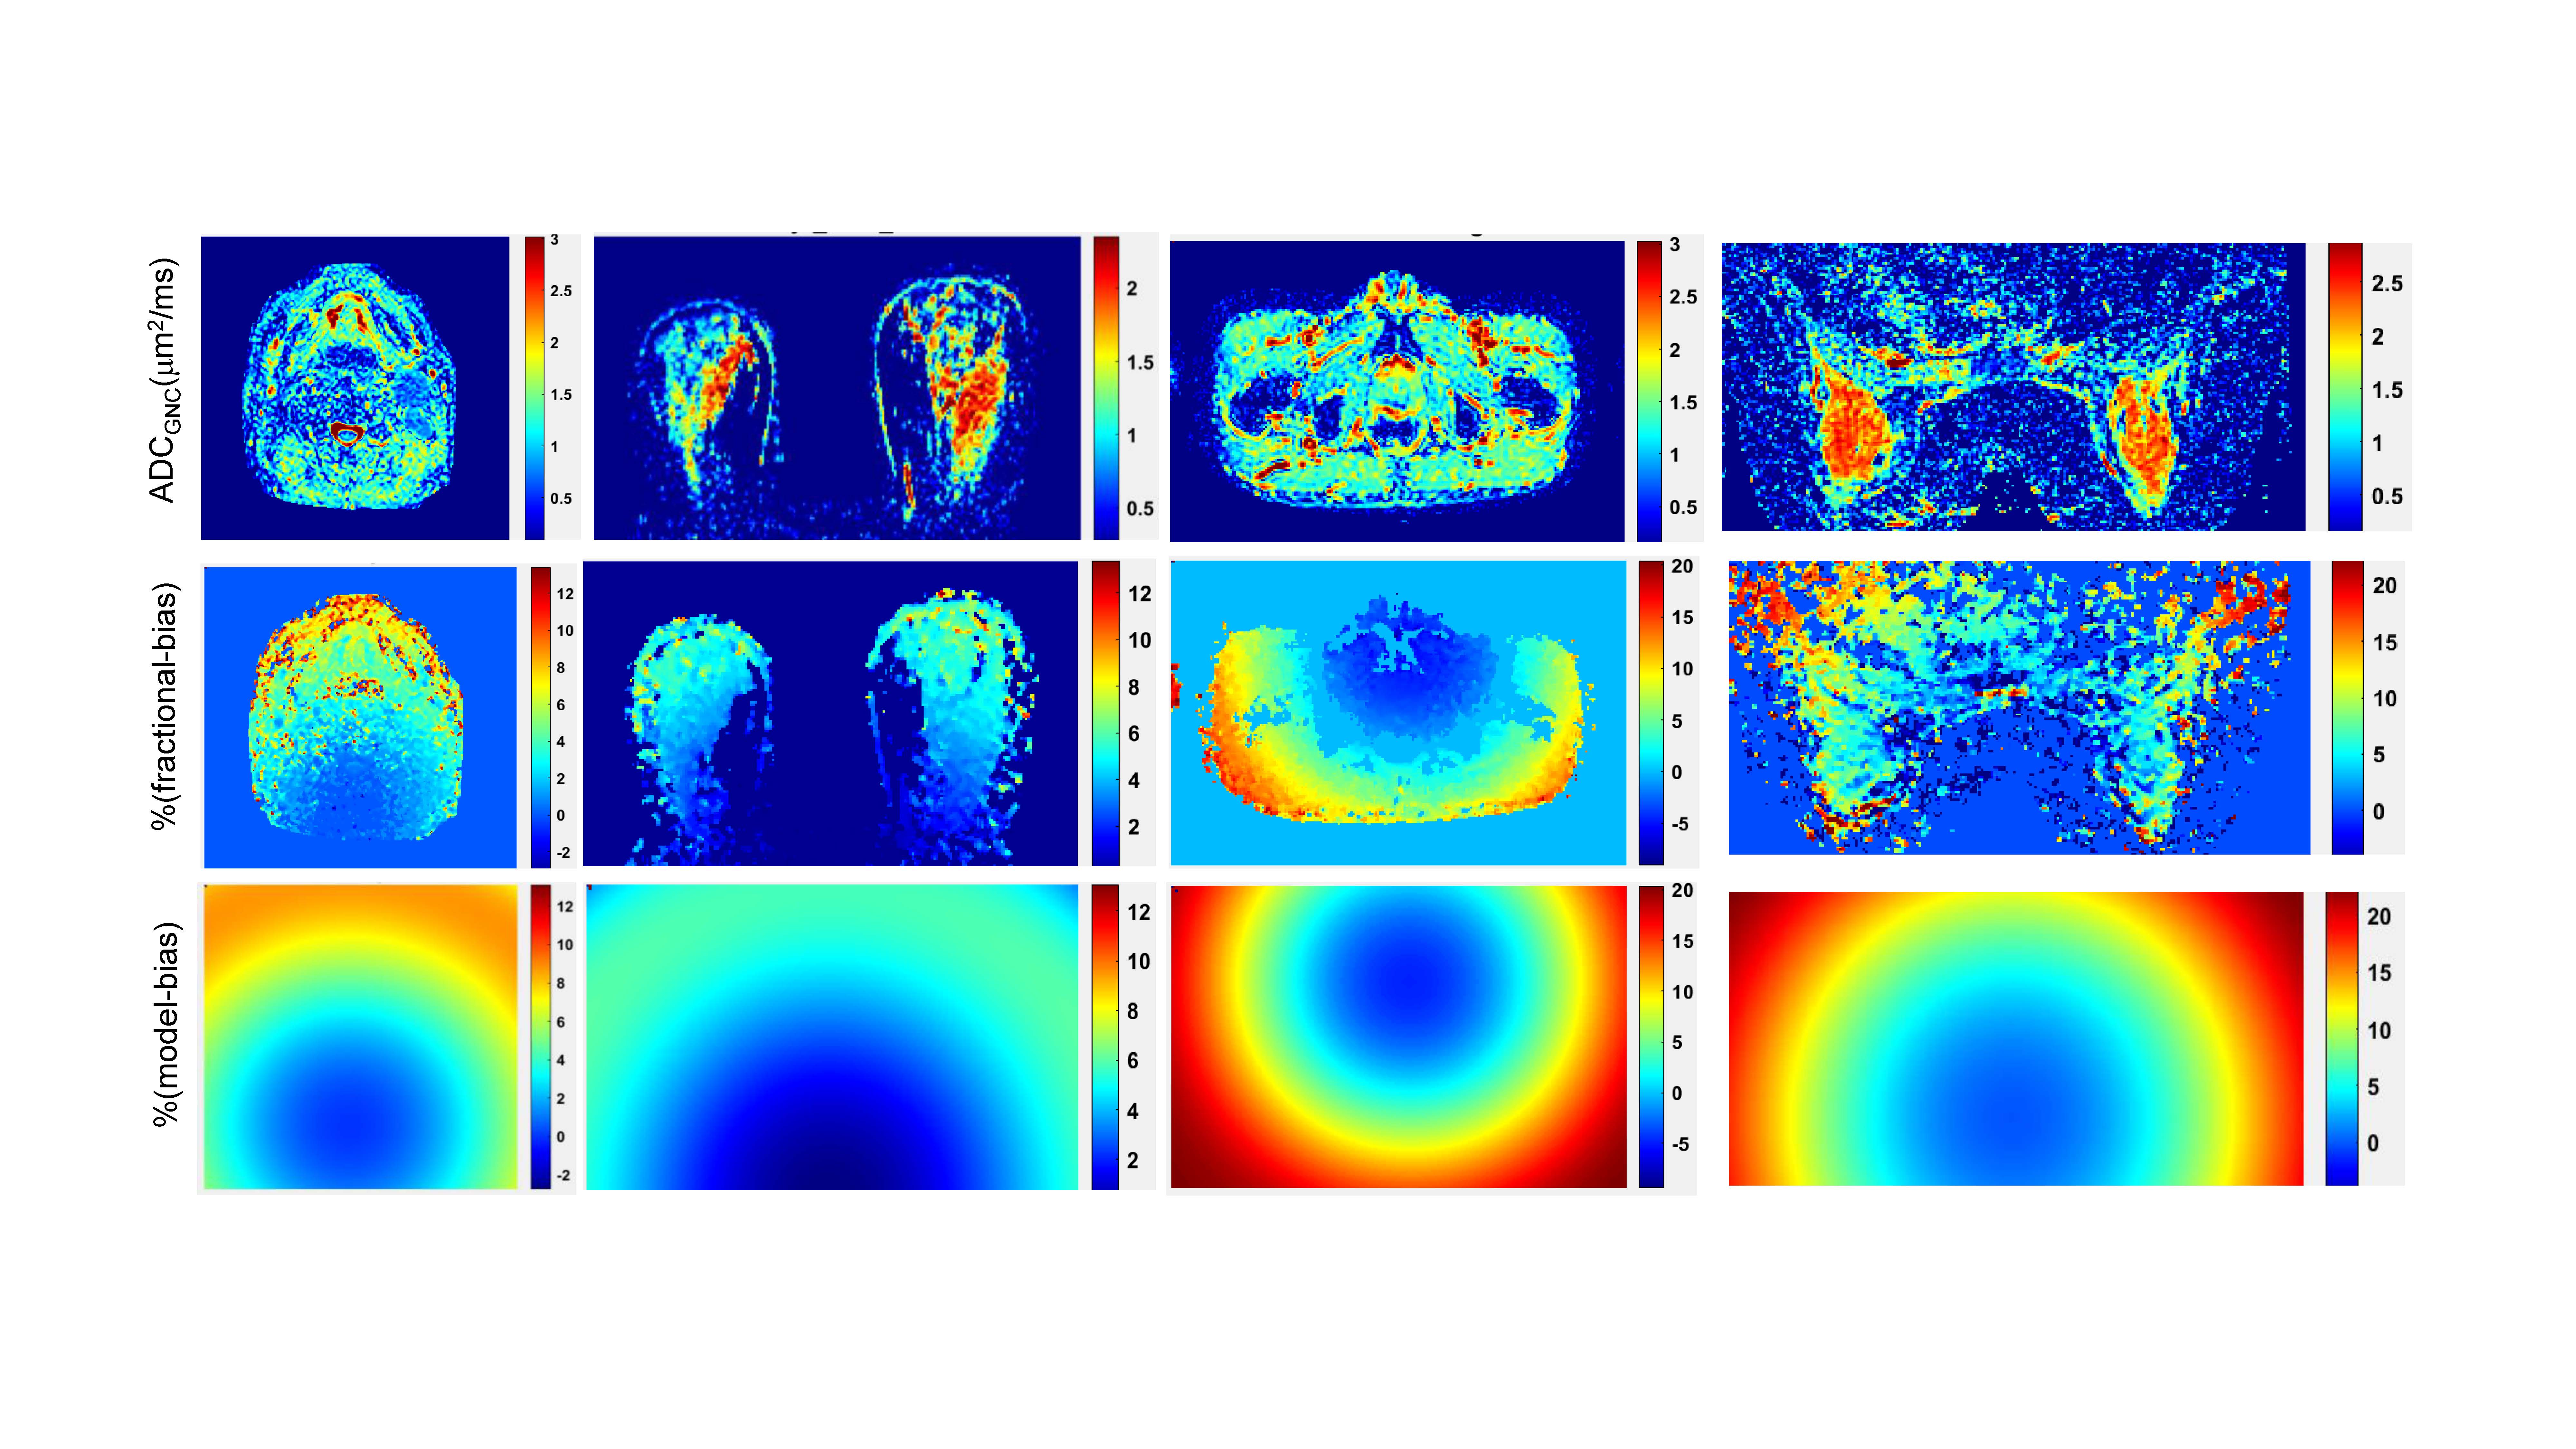
The fractional bias maps illustrate the extent and spatial pattern of ADC non-uniformity bias corrected by GNC for phantoms (Figure 1) and trial subjects (Figure 2). Adequate GNC deployment was ensured by the consistency of fractional bias (Figures 1,2, middle rows) and system GNL model correction maps (Figures 1,2, bottom rows), as well as small differences (<1% voxel-wise) between vendor-provided and vendor-agnostic AIP GNC (not shown). GNC restored spatial uniformity for the phantom ADC maps (Figure 1) of ice-water (tubes), “flood” gel and fibro-glandular (FG) tissue-mimic (breast PVP phantom background material). The GNL bias correction also improved cross-platform reproducibility for the ice-water phantoms and accuracy of measured absolute diffusion values for the phantom materials (ADCGNC±0.03)μm2/ms: ADCice-water(@0ºC) = 1.11 μm2/ms; ADCSPAAG(@isocenter) = 2.13 μm2/ms; and ADCPVP(%PVP0, 10, 25, 40) = (1.92, 1.58, 0.98, 0.60)μm2/ms in the PVP-DWI breast phantom.The spatial patterns of fractional bias maps qualitatively agreed with the system model predictions for phantoms (Figure 1) and patients (Figure 2). Consistent with the phantom ADC measurements, GNL bias and GNC efficiency increased with the increasing offset from the scanner isocenter for target anatomy and toward the FOV edges (Figure 2). More structured noise was evident on patient fractional bias maps (Figure 2, middle row) compared to phantoms (Figure 1, 3rd row), likely related to differences between background low-SNR DWI filtering with and without GNC implemented for on-scanner ADC calculation.
The range of the corresponding GNL bias in ADC observed for phantoms and patients is summarized in Table 1. Phantoms provided a representative sample of imaged off-center locations for testing the GNC with the range of corrected spatial GNL ADC non-uniformity bias from -30% (Figure 1, long-tube ice-water, SPAAG-flood) to +20% (Figure 1, SPAAG-flood, breast PVP) at extreme locations. For all target anatomies mostly positive (moderate) bias prevailed and was corrected (average of 3-12%, Table 1) in the patient ADC maps for breast, head and neck and bone marrow (Figure 2).
Conclusion
The developed GNC QC procedure accommodates different anatomy and DWI phantom protocols for a variety of clinical trials. It provides timely feedback on the ADC GNC performance without interrupting the imaging trial workflow. Preliminary results for the trial subjects indicate the adequate performance of the vendor-implemented ADC corrections on all four studied gradient systems. Evaluation of the GNC effect on ADC reproducibility and accuracy for trial subjects is ongoing.Acknowledgements
Funding support from National Institutes of Health Grants: R01CA190299, R01CA207290, R01CA248192, R01CA132870, U01CA211205, U01CA225427, U24CA237683.References
1. Partridge, S.C.; Zhang, Z.; Newitt, D.C.; Gibbs, J.E.; Chenevert, T.L.; Rosen, M.A.; Bolan, P.J.; Marques, H.S.; Romanoff, J.; Cimino, L.; et al. Diffusion-weighted MRI Findings Predict Pathologic Response in Neoadjuvant Treatment of Breast Cancer: The ACRIN 6698 Multicenter Trial. Radiology 2018, 289, 618–627
2. Rahbar H, Zhang Z, Chenevert TL, et al. Utility of diffusion weighted imaging to decrease unnecessary biopsies prompted by breast MRI: a trial of the ECOG-ACRIN Cancer Research Group (A6702). Clin Cancer Res. 2019;25(6):1756- 1765.
3. Newitt DC, Tan ET, Wilmes LJ, Chenevert TL, Kornak J, Marinelli L, Hylton N. Gradient nonlinearity correction to improve apparent diffusion coefficient accuracy and standardization in the American College of Radiology Imaging Network 6698 breast cancer trial. J Magn Reson Imaging. 2015;42(4):908-19.
4. McTavish, S., Van, A.T., Peeters, J.M. et al. Gradient nonlinearity correction in liver DWI using motion-compensated diffusion encoding waveforms. Magn Reson Mater Phy 35, 827–841 (2022)
5. Pang Y, Malyarenko DI, Wilmes LJ, Devaraj A, Tan ET, Marinelli L, Endt AV, Peeters J, Jacobs MA, Newitt DC, Chenevert TL. Long-Term Stability of Gradient Characteristics Warrants Model-Based Correction of Diffusion Weighting Bias. Tomography. 2022 Feb 4;8(1):364-375.
6. Pang, Y.; Malyarenko, D.I.; Amouzandeh, G.; Barberi, E.; Cole, M.; Vom Endt, A.; Peeters, J.; Tan, E.T.; Chenevert, T.L. Empirical validation of gradient field models for an accurate ADC measured on clinical 3T MR systems in body oncologic applications. Phys. Med. 2021, 86, 113–120
7. Tan, E.T.; Marinelli, L.; Slavens, Z.W.; King, K.F.; Hardy, C.J. Improved correction for gradient nonlinearity effects in diffusion-weighted imaging. J. Magn. Reson. Imaging 2013, 38, 448–453.
8. Malyarenko DI, Ross BD, Chenevert TL. Analysis and correction of gradient nonlinearity bias in apparent diffusion coefficient measurements. Magn Reson Med. 2014;71(3):1312-23.
9. Lu Y, Jansen JF, Stambuk HE, Gupta G, Lee N, Gonen M, Moreira A, Mazaheri Y, Patel SG, Deasy JO, Shah JP, Shukla-Dave A. Comparing primary tumors and metastatic nodes in head and neck cancer using intravoxel incoherent motion imaging: a preliminary experience. J Comput Assist Tomogr. 2013;37(3):346-52
10. Schaefer J, Choi S, Luker G, Chenevert T, Ross B, Talpaz M. Primary myelofibrosis evolving to an aplastic appearing marrow. Clin Case Rep. 2018 May 31;6(7):1393-1395.
11. Holz M, Heil SR, and Sacco A. Temperature-dependent self-diffusion coefficients of water and six selected molecular liquids for calibration in accurate 1H NMR PFG measurements. Phys. Chem. Chem. Phys. 2000; 2(20): 4740–4742.
12. Amouzandeh G, Chenevert TL, Swanson SD, Ross BD, Malyarenko DI: Technical note: Temperature and concentration dependence of water diffusion in polyvinylpyrrolidone solutions. Med Phys 2022; 49(5): 3325-3332
Figures