5353
Differentiation of stage IA and IB endometrial cancer using texture analysis based on T2 -weighted and diffusion-weighted imaging1Department of Radiology, The First Affiliated Hospital of Dalian Medical University, Dalian, China
Synopsis
Keywords: Contrast Mechanisms, Uterus, Endometrial Cancer
In our study, Imagingomics texture analysis in DWI and T2WI showed the correlation and inverse gap of glcm, glrlm-RunLengthNonUniformityNormalized and shortRunEmphasis are more effective in identifying stage IA and IB EC . And the diagnostic efficacy combined parameter analysis were higrer and bettter than the single parameter analysis.Introduction
Endometrial cancer (EC) is one of the common malignant tumors in the female reproductive system. FIGO staging suggests the tumour limited to endometrium or invading less than one half of myometrium was regarded as Stage ⅠA, and tumour invades one half or more of myometrium was Stage IB 1. Clinically, Patients in stage IA EC generally don’t have the lymphonectomy, while Stage IB EC with a higher risk for nodal metastases requires surgical resection of lymph nodes 2. The concurrent uterine leiomyomas or adenomyosis can usually lead to confound evaluation of the tumor on MRI 3. As an emerging technology, radiomics texture analysis can provide deep quantitative features and improve the diagnostic accuracy.Method
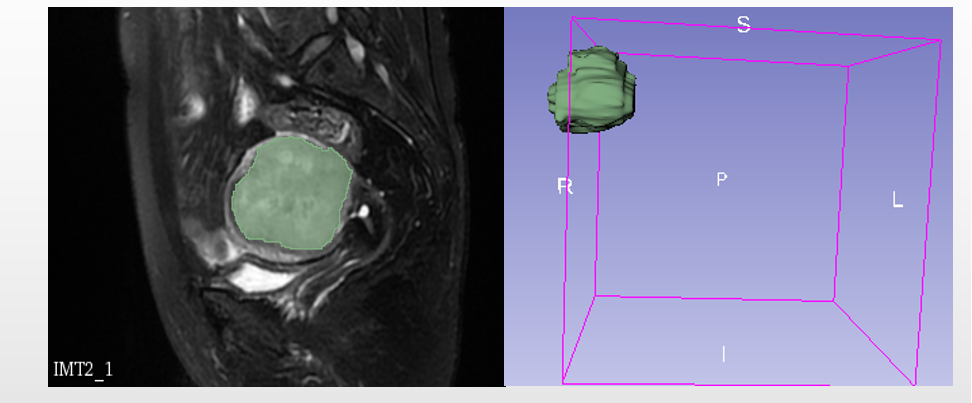
A retrospective analysis of 80 cases of endometrial cancer confirmed by surgery and pathology in our hospital were retrospectively analysed (Stage IA for 55 ,Stage IB for 25 ). All patients were examined on the pelvic 1.5T MRI before surgery. The area of interest (ROI) of the lesion was delineated layer respectively in sagittal T2WI and axial DWI images by radiologists using 3D-Slicer. 3D-ROI representing the overall tumor mass was obtained and texture features were extracted. The comparison of texture features between group IA and IB was performed by independent sample t test or Mann -WhitneyU test. The diagnosis efficiency of those features parameter was evaluated by receiver operating characteristic (ROC) curve and the area under the curve(AUC). The logistic regression was used to jointly analyze all the differential parameters in both sequences, and ROC curves were drawn to assess the efficacy of the combined diagnosis.Result
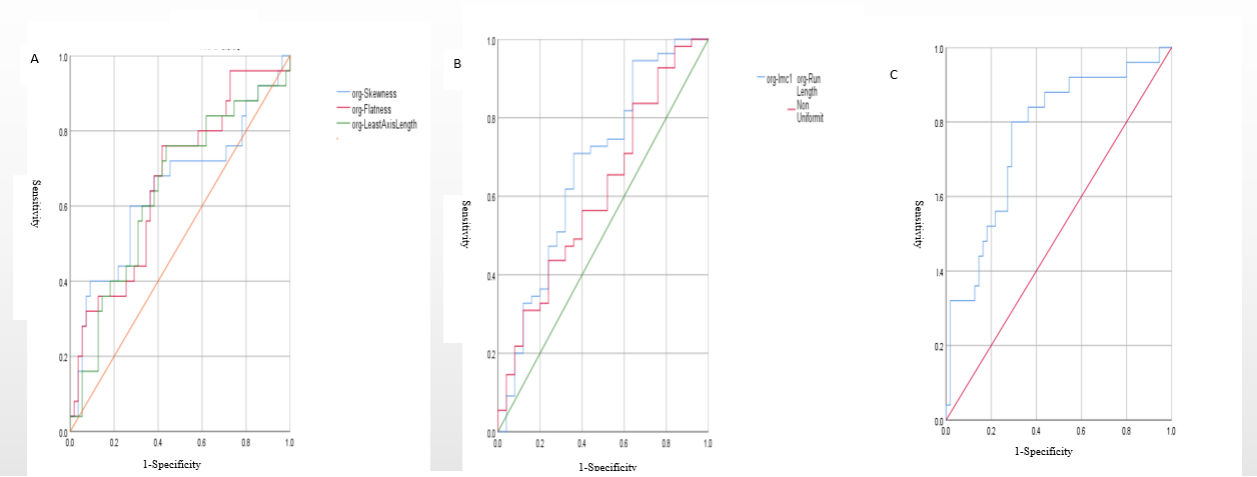
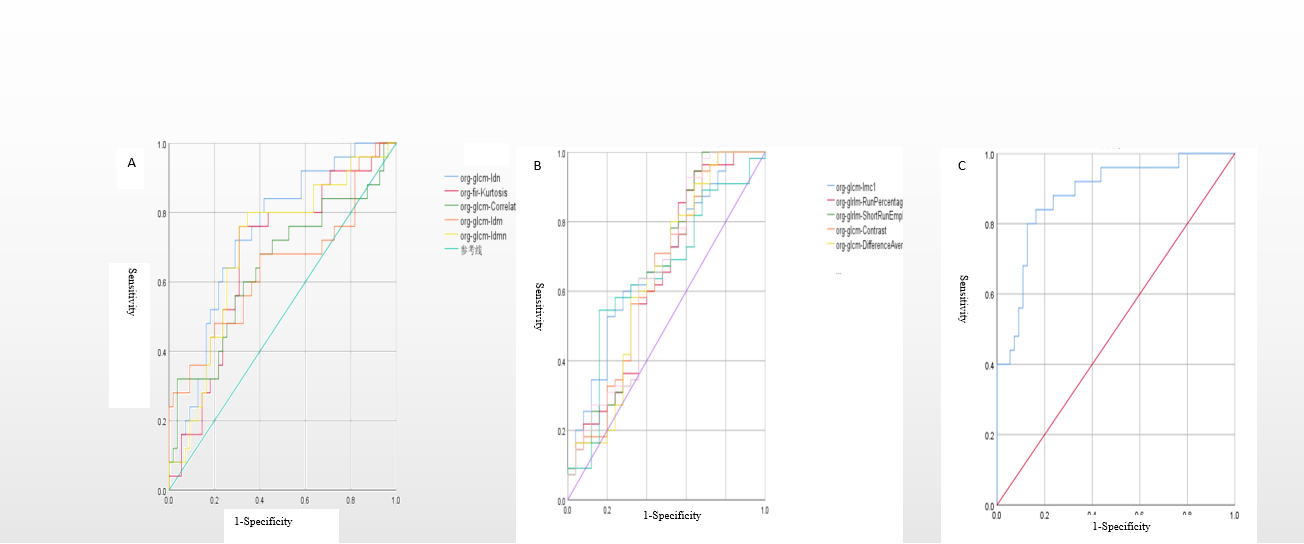
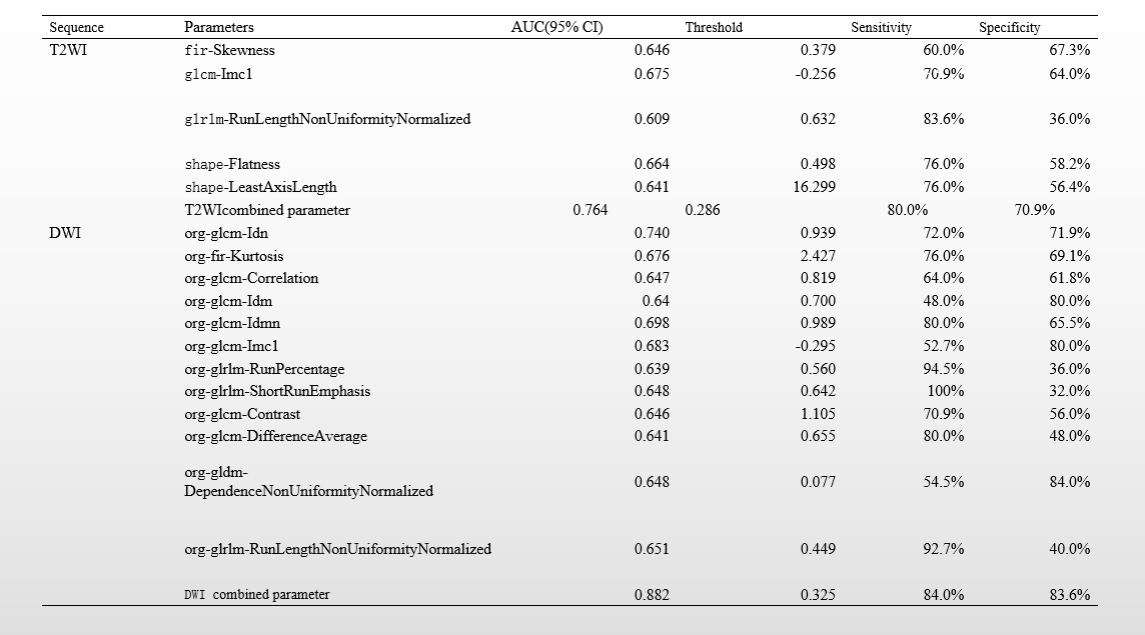
The difference of the texture features was statistically significant (p<0.05) in T2WI, including firstorder-Skewness, glcm-Imc1, glrlm-Run Length NonUniformity Normalized, shape-Flatness, shape-Least Axis Length. The AUC of glcm-Imc1 and shape-Flatness were the highest( 0.675,0.664), the thresholds were respectively -0.256 and 0.498,the sensitivity was respectively 70.9% and 76.0%,and the specificity was respectively 64.0% and 58.2%. The AUC was higher for T2WI combined with all differential parameters analysis (0.764) than single parameter analysis, with 80.0% sensitivity and 70.9% specificity. The difference of the texture features was statistically significant (p<0.05) in DWI, including firstorder-Kurtosis, glcm-Idn, glcm-Correlation, glcm-Idm, glcm-Idmn,glcm-Imc1, glcm-Contrast, glcm-Difference Average, gldm-Dependence NonUniformity Normalized, glrlm-Run Percentage, glrlm-Short Run Emphasis, glrlm-Run Length NonUniformity Normalized. The AUC of glcm-Idn was the highest(0.740).The threshold ,sensitivity and specificity were respectively 0.939,72.0% and 71.9%. The AUC was higher for DWI combined with all differential parameters analysis (0.882) , with 84.0% sensitivity and 83.6% specificity.Discussion
Shape-Flatness representing root mean square of the ratio of the largest path to the long axis on T2WI identified more in groups IB and IA EC, considering the Stage IB EC myometrial invasion is wider than IA 4. The value of T2WI-skewness and DWI-kurtosis in firstorder statistical features for group IB EC were higher , speculated that the internal heterogeneity of stage IB EC was greater,while the poor image symmetry of the patients were more skewed and the distribution of the variables were more concentrated near the mean. The value of glcm-correlation and inverse gap(Idn,Idm,Idmn) in DWI were higher in group IB , indicated that group IB EC images were more homogeneous but randomly complex, considered that the wider depth and scope of EC myometrial infiltration in Stage IB EC maked the smaller signal contrast between the lesion and myometria 5. And the value of glrlm-Run Length NonUniformity Normalized and gldm-Dependence NonUniformity Normalized in group IB were both lower , indicating group IB EC images were more homogeneous 6. The glrlm-ShortRunEmphasis had a higher value in group IA EC, suggested group IA EC images had finer textures, or the group IB had a thicker texture 6.Our study showed the Stage IB EC images have more homogeneous and thicker texture, except that the myometrial infiltration range in stage IB EC wider which makes signal contrast between lesions and myometrial and binding bands smaller 5. It was also related to the MELF (microcystic, elongated, and fragmented glandular) muscle layer infiltration patterns with more aggressive nature and a poor prognosis as previous reported 7, which has common histologic features including elongated structures lined with the same types of cells and the same inflammatory cells in their lumens 7 . However, the value of glcm-Imc1 evaluating the texture correlation in group IA was higher in our study, which was inconsistent with other features, considering that there may be some error in study measurement.
Overall, the diagnostic efficacy in DWI and T2WI combined parameter analysis were higrer than single parameter analysis,and it can better reflect the overall characteristics and tissue heterogeneity of the tumor lesions. Our study also showed that the diagnostic efficacy of combined parameter analysis in DWI were higher than T2WI(0.882 vs 0.764), which was speculated DWI provides realistic image contrast of the relative speed of the diffusion of tissue water molecules. It can more comprehensively reflect the tumor information with the higher diagnostic efficacy 8.
Conclusion
Our study showed texture analysis on T2WI and DWI can effectively differentiate in stage IA and IB EC , which is helpful for the selection of clinical treatments and prognosis judgment.Acknowledgements
First of all, I would like to thank my tutor and tutor Meiyu for her patient guidance and many valuable suggestions, so I benefited a lot from the whole process and helped me complete this research. Secondly, I also thank the department for its reliable image data support. All in all, I want to thank everyone who helped me in this research. Salute!References
1. Koh WJ, Abu-Rustum NR, Bean S, et al. Uterine neoplasms, version 1. 2018, NCCN clinical practice guidelines in oncology[J]. J Natl Compr Canc Netw, 2018, 16(2): 170-199.
2. National Comprehensive Cancer Network. NCCN clinical practice guidelines in oncology (NCCN Guidelines): Uterine neoplasms.(Version 1.2020)
3. Maheshwari E, Nougaret S, Stein EB, et al. Update on MRI in Evaluation and Treatment of Endometrial Cancer[J]. Radiographics,2022 , 26:220070.
4. Guo R, Shen XZ, Xin RQ, et al. Predictive value of random forest based on MRI radiomics in evaluating the invasion depth of endometrial carcinoma. Chin J Magn Reson Imaging, 2020, 11(12): 1133-1137.
5. YAO Yiming, YE Jing, GAO Hui, et al. Evaluation of the depth of myometrial invasion in stage I endometrial cancer based on gray level co-occurrence matrix of sagittal T2 - weighted MRI[J].Modern Oncology 2021,29( 08) : 1404 - 1409.
6. SU Chunqiu, HAN Qiuyu, FENG Piaopiao, et al. Differentiation of adult pilocytic astrocytomas and hemangioblastomas using texture analysis. J Pract Radiol, 2018 , 34(1):8-11.
7. Park JY, Hong D, Park JY. Association between Morphological Patterns of Myometrial Invasion and Cancer Stem Cell Markers in Endometrial Endometrioid Carcinoma. Pathol Oncol Res. 2019 Jan;25(1):123-130. doi: 10.1007/s12253-017-0320-5. Epub 2017 Oct 8. PMID: 28990139.
8. Sun Zhongru, Tian Weizhong, Yu Ji. Value of image texture analysis of diffusion-weighted imaging sequence in the differential diagnosis of benign and malignant breast tumors[J/ CD]. Chin J Digest Med Imageol (Electronic Edition), 2019, 9(6): 267-271.
Figures
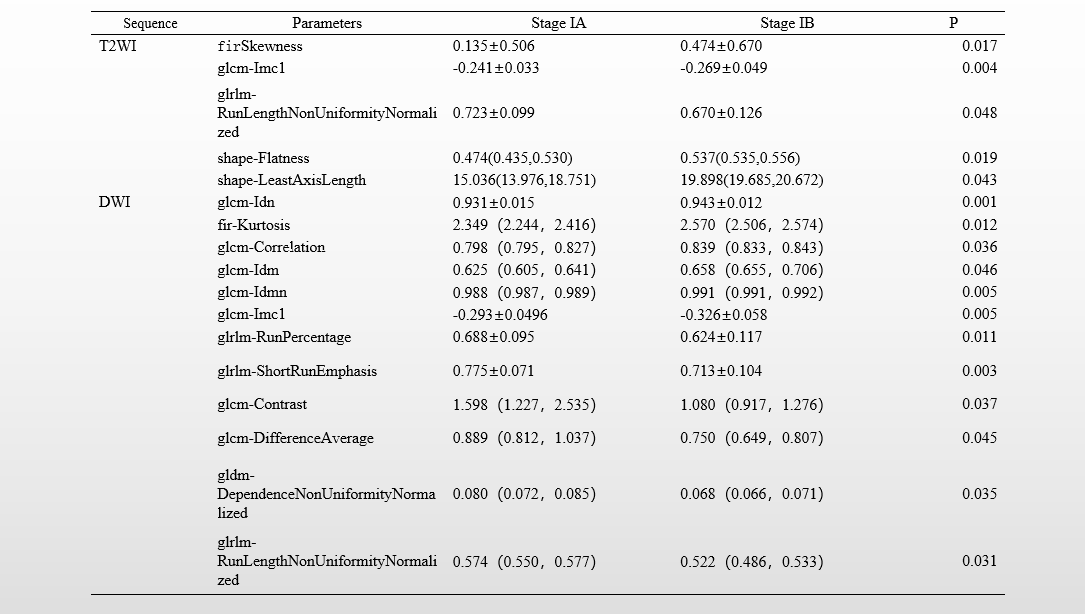
Tab 1. Comparison of statistically significant parameters in T2WI and DWI sequences in stage I EC patients
Note: The normal distribution to ( ¯x± s) . The non - normal distribution is represented by the median ( upper and lower quartiles) .