5352
A feasibility study of susceptibility source separation via chi-separation in amyotrophic lateral sclerosis patients at 7T1Department of Electrical and Computer Engineering, Seoul National University, Seoul, Korea, Republic of, 2Department of Radiology, Johns Hopkins University School of Medicine, Baltimore, MD, United States, 3F.M. Kirby Research Center for Functional Brain Imaging, Kennedy Krieger Institute, Baltimore, MD, United States, 4Institute of Radiation Medicine, Seoul National University Medical Research Center, Seoul, Korea, Republic of, 5Department of Radiology, Seoul National University Hospital, Seoul, Korea, Republic of, 6Center for Neuroscience Imaging Research, Institute for Basic Science (IBS), Suwon, Korea, Republic of, 7Biomedical Research Institute, Seoul National University Hospital, Seoul, Korea, Republic of, 8Department of Neurology, College of Medicine, Jeonbuk National University, Jeonju, Korea, Republic of, 9Department of Neurology, College of Medicine, Seoul National University, Seoul, Korea, Republic of
Synopsis
Keywords: Susceptibility, Susceptibility
The in-vivo imaging of iron and myelin concentrations of the motor cortex in amyotrophic lateral sclerosis (ALS) patients has significance in advancing knowledge about the degeneration progress of the disease. Here, we explored the feasibility of applying 𝜒-separation to ALS patients in-vivo at 7T. When the susceptibility values in hand knobs are examined, ALS patients have higher positive susceptibility values than healthy controls, confirming the histological finding of iron accumulation in ALS.
Introduction
𝜒-separation is an advanced quantitative susceptibility mapping method for susceptibility source separation1-3 that can separate positive and negative susceptibility distributions in the brain. Previous studies have demonstrated the correlations between positive susceptibility and iron concentration and between negative susceptibility and myelin concentration in the brain4-5, respectively.Amyotrophic lateral sclerosis (ALS) is a progressive neurodegenerative disorder accompanying damage to the motor neuron. There have been several attempts to use quantitative susceptibility mapping (QSM) to observe the differences in the iron distribution in ALS brain6-10, but yet using susceptibility source separation. Therefore, the objective of this study is to compare distributions of iron and myelin across the motor cortex in ALS patients and controls in-vivo at 7T.
Methods
We acquired high-resolution 𝜒-separation maps using 7T MRI to recognize the fine structures of the cortex region. However, the R2 map requirement of 𝜒-separation can be an obstacle to applying 𝜒-separation in 7T due to the high SAR and B1 inhomogeneity issues in multi-echo spin-echo. Although there is a deep neural network11 that can work with only the R2* map and local field map, it is challenging due to two reasons: i) The resolution difference between our data and training data. ii) R2* and R2 value differences along the field strengths. Therefore, we used a nominal-value R2 map. The QSM and 𝜒-separation maps were reconstructed using the iLSQR-based method14 (Fig. 1).For validation, one healthy subject was scanned at a 7T MRI system (Siemens Magnetom Terra). Multi-echo gradient echo (MEGE) data were acquired with the following parameters: resolution=0.2×0.2×1.5 mm3, TR=35 ms, TE=7:7:35 ms, and flip angle=10°. R2* and frequency shift maps were estimated from MEGE12-13. R2 map is estimated from three single-echo spin echo data (TE=10ms, 30ms, 50ms). The nominal R2 value is selected as 23 Hz since it has the minimum root-mean-square error to the original 𝜒-separation map.
As an application, twelve ALS patients and eight healthy subjects were scanned at 7T MRI. MEGE data were acquired with the following parameters: resolution=0.2×0.2×1.5 mm3, TR=35 ms, TE=7:7:28 ms, and flip angle=10°. For a region of interest (ROI) analysis, ROIs were manually segmented in the subcortical white matter (WM) and gray matter (GM) of the hand knob in the primary motor cortex using ITK-SNAP15. All experiments are IRB-approved.
Results
In Figure 2, 𝜒-separation maps that used the R2 map estimated from spin-echo and which used the nominal value R2 map (= 23 Hz) are shown. The overall contrast is similar in both 𝜒-positive and 𝜒-negative maps although differences are also noticeable. The normalized root-mean-squared error values between the two maps are 29% and 30% for 𝜒-positive and 𝜒-negative, respectively.The 𝜒-separation and QSM maps of two subjects from healthy control and an ALS patient are shown in Figure 3. In the 𝜒-positive maps, hyperintensities in hand knob regions are observed in a few ALS patients while large variations exist (see Figure 3; columns c and d). The overall distributions and contrasts are similar in other regions. The mean values in ROI from the 𝜒-separation maps and QSM in each subject are plotted in Figure 4. The positive susceptibility values are higher in the ALS patients than in the healthy controls (p<0.05) in the hand knob region, which is known to have a high concentration of iron. However, no significant differences are shown in QSM values. Also in the negative susceptibility maps, ALS patients have higher values in gray matter (p<0.05). No significant differences are found in the white matter of the susceptibility maps.
Conclusion and Discussion
Our study demonstrates that there are differences in the concentration of iron in the hand knob of the motor cortex between ALS patients and healthy controls. While conventional QSM maps cannot capture the significant difference in our data, positive susceptibility maps acquired by 𝜒-separation reveal differences. In white matter, no significant differences are found in 𝜒-negative maps, while the reduction of negative susceptibility was expected in ALS due to the demyelination progress reported in previous studies16-17. Additionally, we utilized the nominal R2 map method for 𝜒-separation in 7T, which shows comparable contrasts. Despite these results, there are still drawbacks to our work. The result of negative susceptibility maps that are higher in the gray matter of ALS patients is a remaining question. We presume that this result is not very reliable, since 𝜒-negative maps seem to contain errors that may originate from errors due to the lack of an R2 map. Also, the voxel size anisotropy can largely affect the dipole deconvolution process. Moreover, validation for using the nominal R2 map was conducted on one healthy subject, further validations or the development of deep-learning-based methods are obligatory. To further address the issues mentioned above, precise depthwise cortical profile analysis will be conducted, taking the advantage of high-resolution data.Acknowledgements
This work was supported by Creative-Pioneering Researchers Program through Seoul National University(SNU) and the National Research Foundation of Korea (NRF) grant funded by the Korea government (NRF-2021R1A2B5B03002783).References
1. Shin, Hyeong-Geol, et al. "𝜒-separation: Magnetic susceptibility source separation toward iron and myelin mapping in the brain." NeuroImage 240 (2021): 118371.2. Emmerich, Julian et al. “On the separation of susceptibility sources in quantitative susceptibility mapping: Theory and phantom validation with an in vivo application to multiple sclerosis lesions of different age.” Journal of magnetic resonance (San Diego, Calif.: 1997) vol. 330 (2021): 107033. doi:10.1016/j.jmr.2021.107033
3. Chen, Jingjia, et al. "Decompose quantitative susceptibility mapping (QSM) to sub-voxel diamagnetic and paramagnetic components based on gradient-echo MRI data." Neuroimage 242 (2021): 118477.
4. Subin, Lee, et al. “Laminar profiling in advanced susceptibility imaging reveals variations in iron and myelin concentrations”, 30th Joint Annual Meeting ISMRM-ESMRMB, 07-12 May 2022.
5. Reeves, Jack A., et al. "Susceptibility networks reveal independent patterns of brain iron abnormalities in multiple sclerosis." NeuroImage 261 (2022): 119503.
6. Schweitzer, Andrew D., et al. "Quantitative susceptibility mapping of the motor cortex in amyotrophic lateral sclerosis and primary lateral sclerosis." AJR. American journal of roentgenology 204.5 (2015): 1086.
7. Lee, Ji Young, et al. "Quantitative susceptibility mapping of the motor cortex: a comparison of susceptibility among patients with amyotrophic lateral sclerosis, cerebrovascular disease, and healthy controls." Neuroradiology 59.12 (2017): 1213-1222.
8. Costagli, Mauro, et al. "Magnetic susceptibility in the deep layers of the primary motor cortex in amyotrophic lateral sclerosis." NeuroImage: Clinical 12 (2016): 965-969.
9. Acosta-Cabronero, Julio, et al. "Quantitative susceptibility MRI to detect brain iron in amyotrophic lateral sclerosis." Radiology 289.1 (2018): 195.
10. Wang, Chaoyue, et al. "Methods for quantitative susceptibility and R2* mapping in whole post-mortem brains at 7T applied to amyotrophic lateral sclerosis." NeuroImage 222 (2020): 117216.
11. Minjoon, Kim, et al. “χ-sepnet: Susceptibility source separation using deep neural network” ”, 30th Joint Annual Meeting ISMRM-ESMRMB, 07-12 May 2022.
12. Dymerska, Barbara, et al. "Phase unwrapping with a rapid opensource minimum spanning tree algorithm (ROMEO)." Magnetic resonance in medicine 85.4 (2021): 2294-2308.
13. Li, Wei, Bing Wu, and Chunlei Liu. "Quantitative susceptibility mapping of human brain reflects spatial variation in tissue composition." Neuroimage 55.4 (2011): 1645-1656.
14. Li, Wei, et al. "A method for estimating and removing streaking artifacts in quantitative susceptibility mapping." Neuroimage 108 (2015): 111-122.
15. Paul A. Yushkevich, Joseph Piven, Heather Cody Hazlett, Rachel Gimpel Smith, Sean Ho, James C. Gee, and Guido Gerig. User-guided 3D active contour segmentation of anatomical structures: Significantly improved efficiency and reliability. Neuroimage 2006 Jul 1;31(3):1116-28.
16. Kolind, Shannon, et al. "Myelin imaging in amyotrophic and primary lateral sclerosis." Amyotrophic Lateral Sclerosis and Frontotemporal Degeneration 14.7-8 (2013): 562-573.
17. Meadowcroft, Mark D., et al. "Histological–MRI correlation in the primary motor cortex of patients with amyotrophic lateral sclerosis." Journal of magnetic resonance imaging 41.3 (2015): 665-675.
Figures
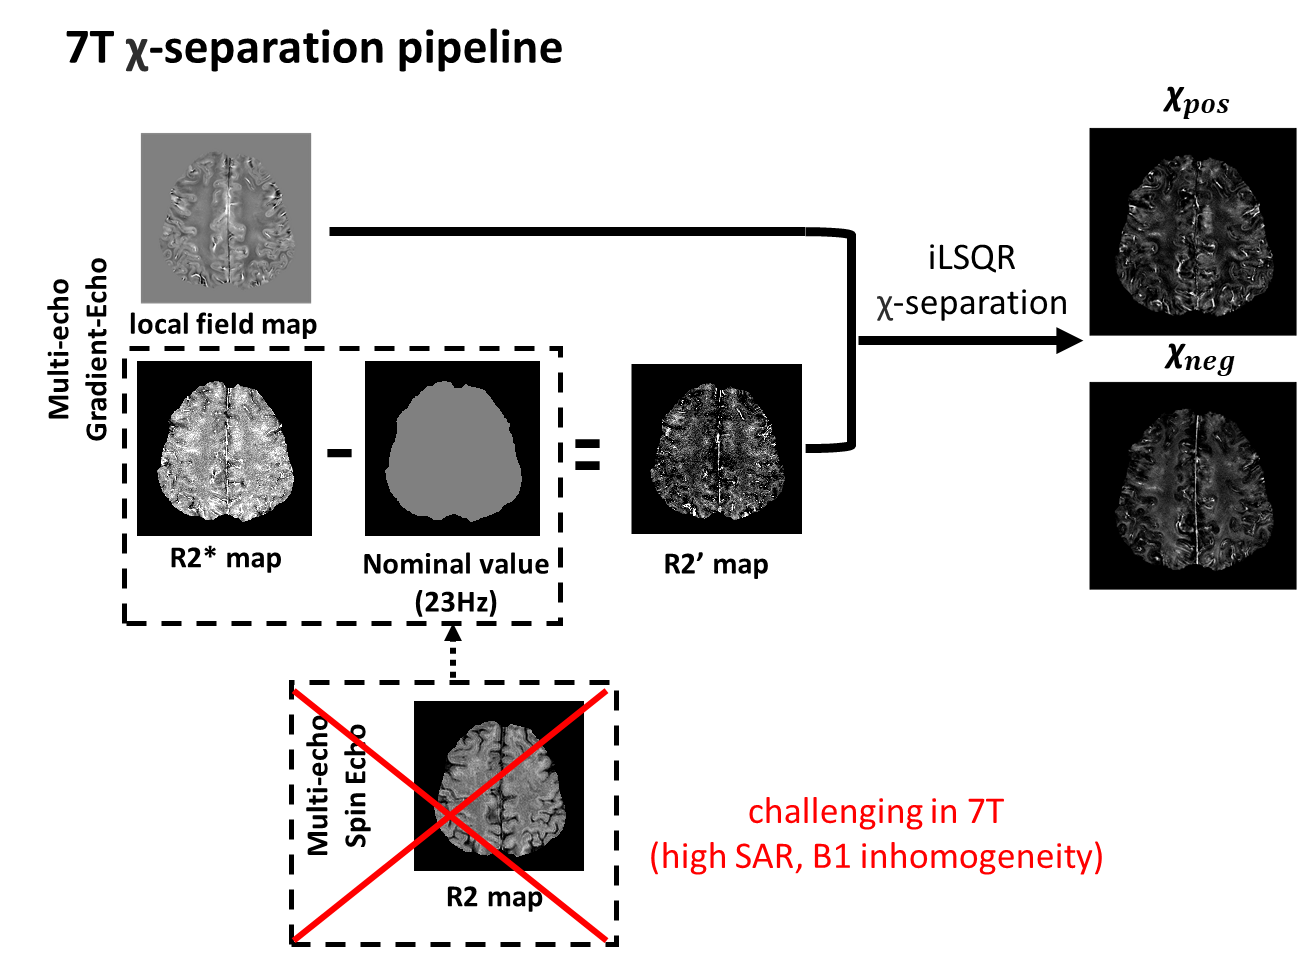
Figure 1. The overall pipeline of 𝜒-separation using 7T MRI. It is challenging to acquire an R2 map in 7T due to high SAR and B1 inhomogeneity issues. Here, we utilized the nominal R2 map instead to overcome these issues. The nominal value of R2 is chosen as 23 Hz since it has the minimum error to the original x-separation maps. For susceptibility source separation, iLSQR-based 𝜒-separation is applied.
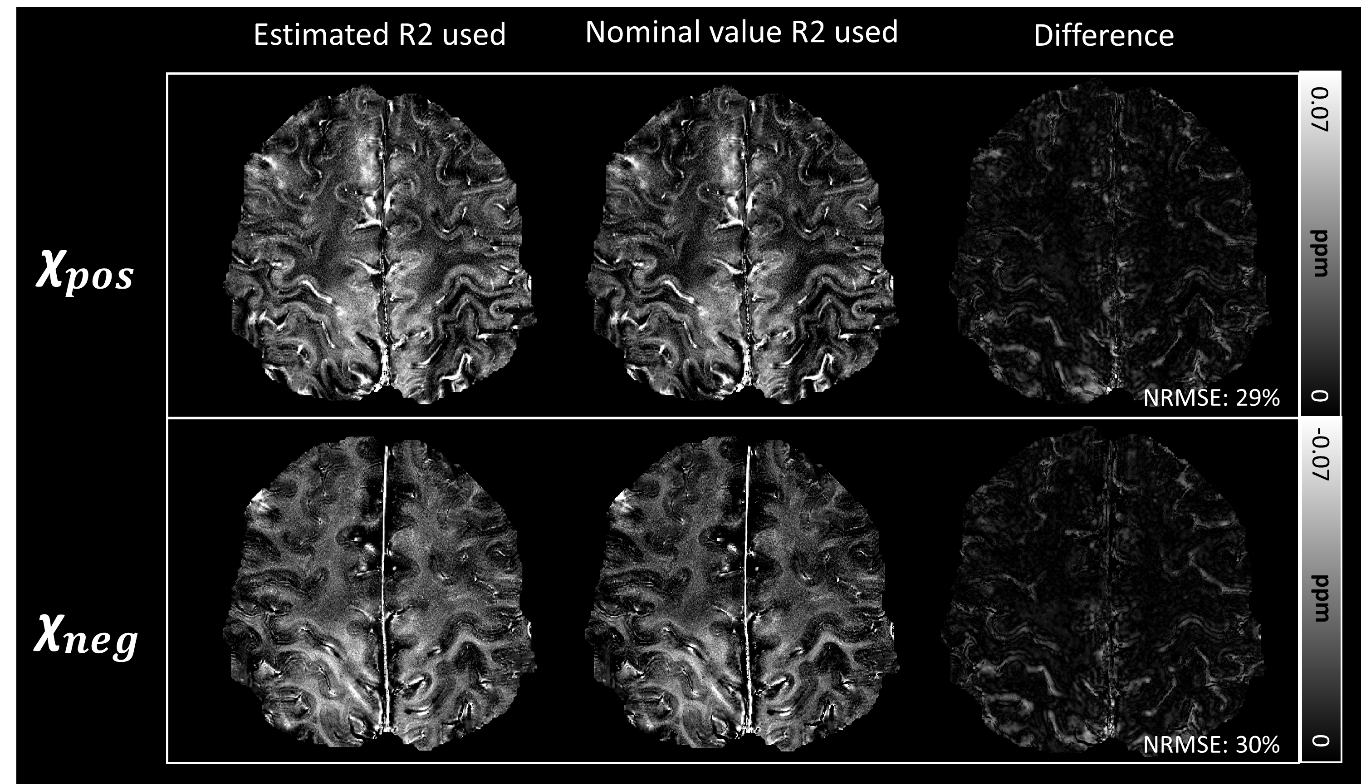
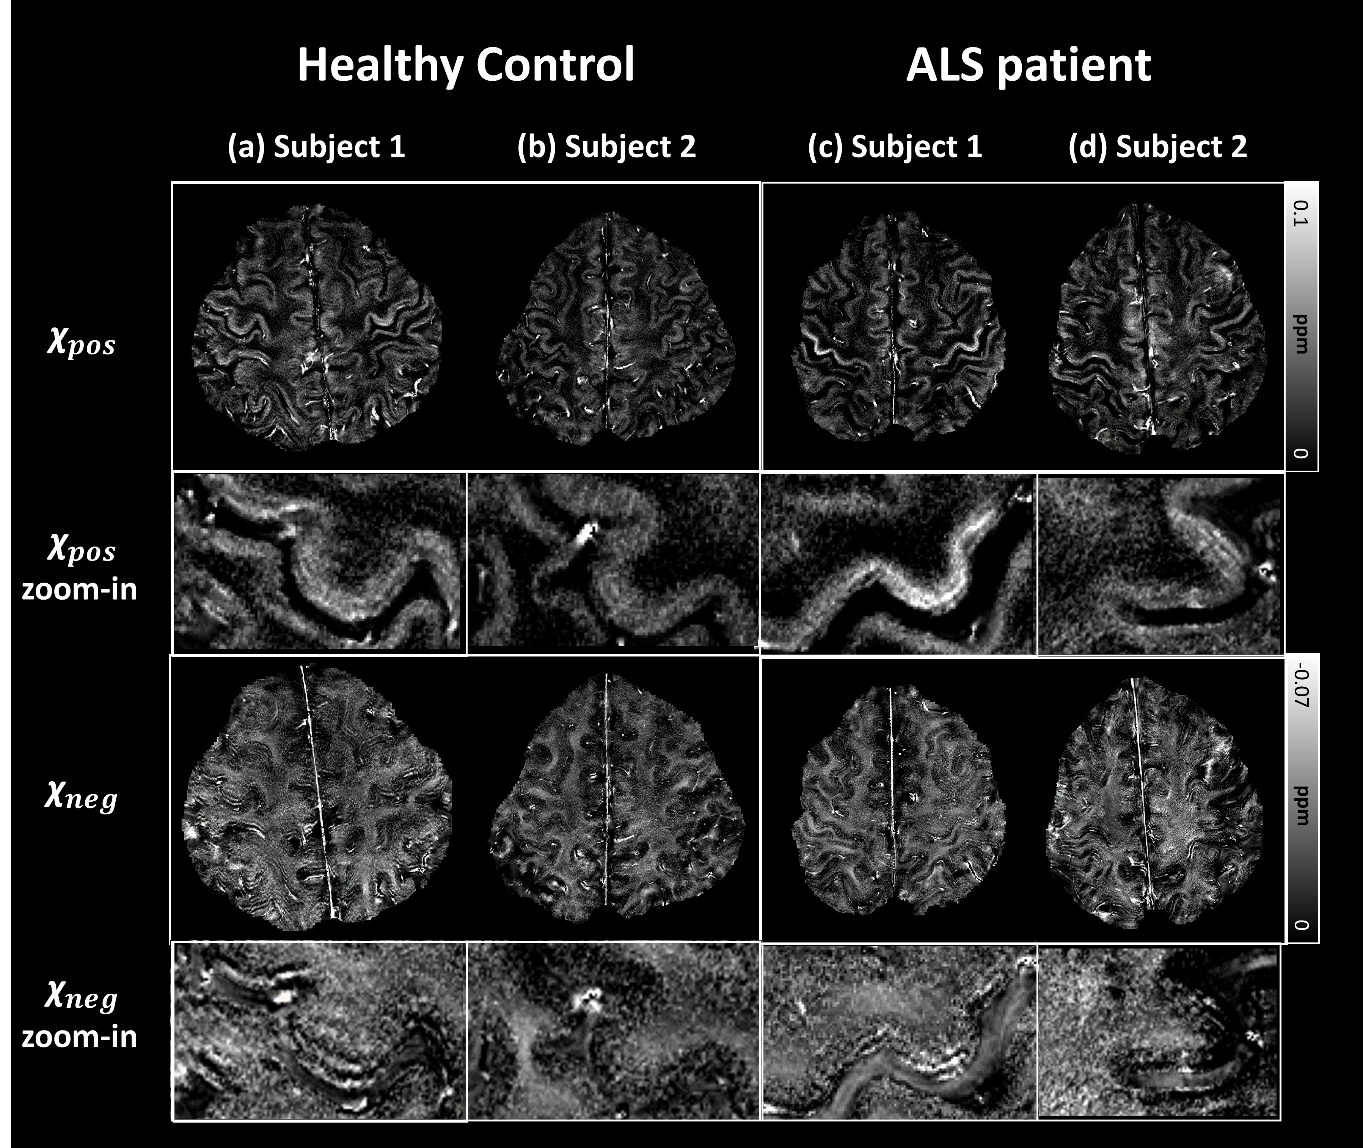
Figure 3. Images of 𝜒pos and 𝜒neg in two subjects each in healthy control and ALS patients. When zoomed in, 𝜒pos hyperintensity is observed at the hand knob region of the ALS patient (column c), implying iron accumulation following the neurodegenerative progress. On the other hand, no significant hyperintensity is found in several ALS patients (column d). The overall contrasts are similar, except for the hand knob region.
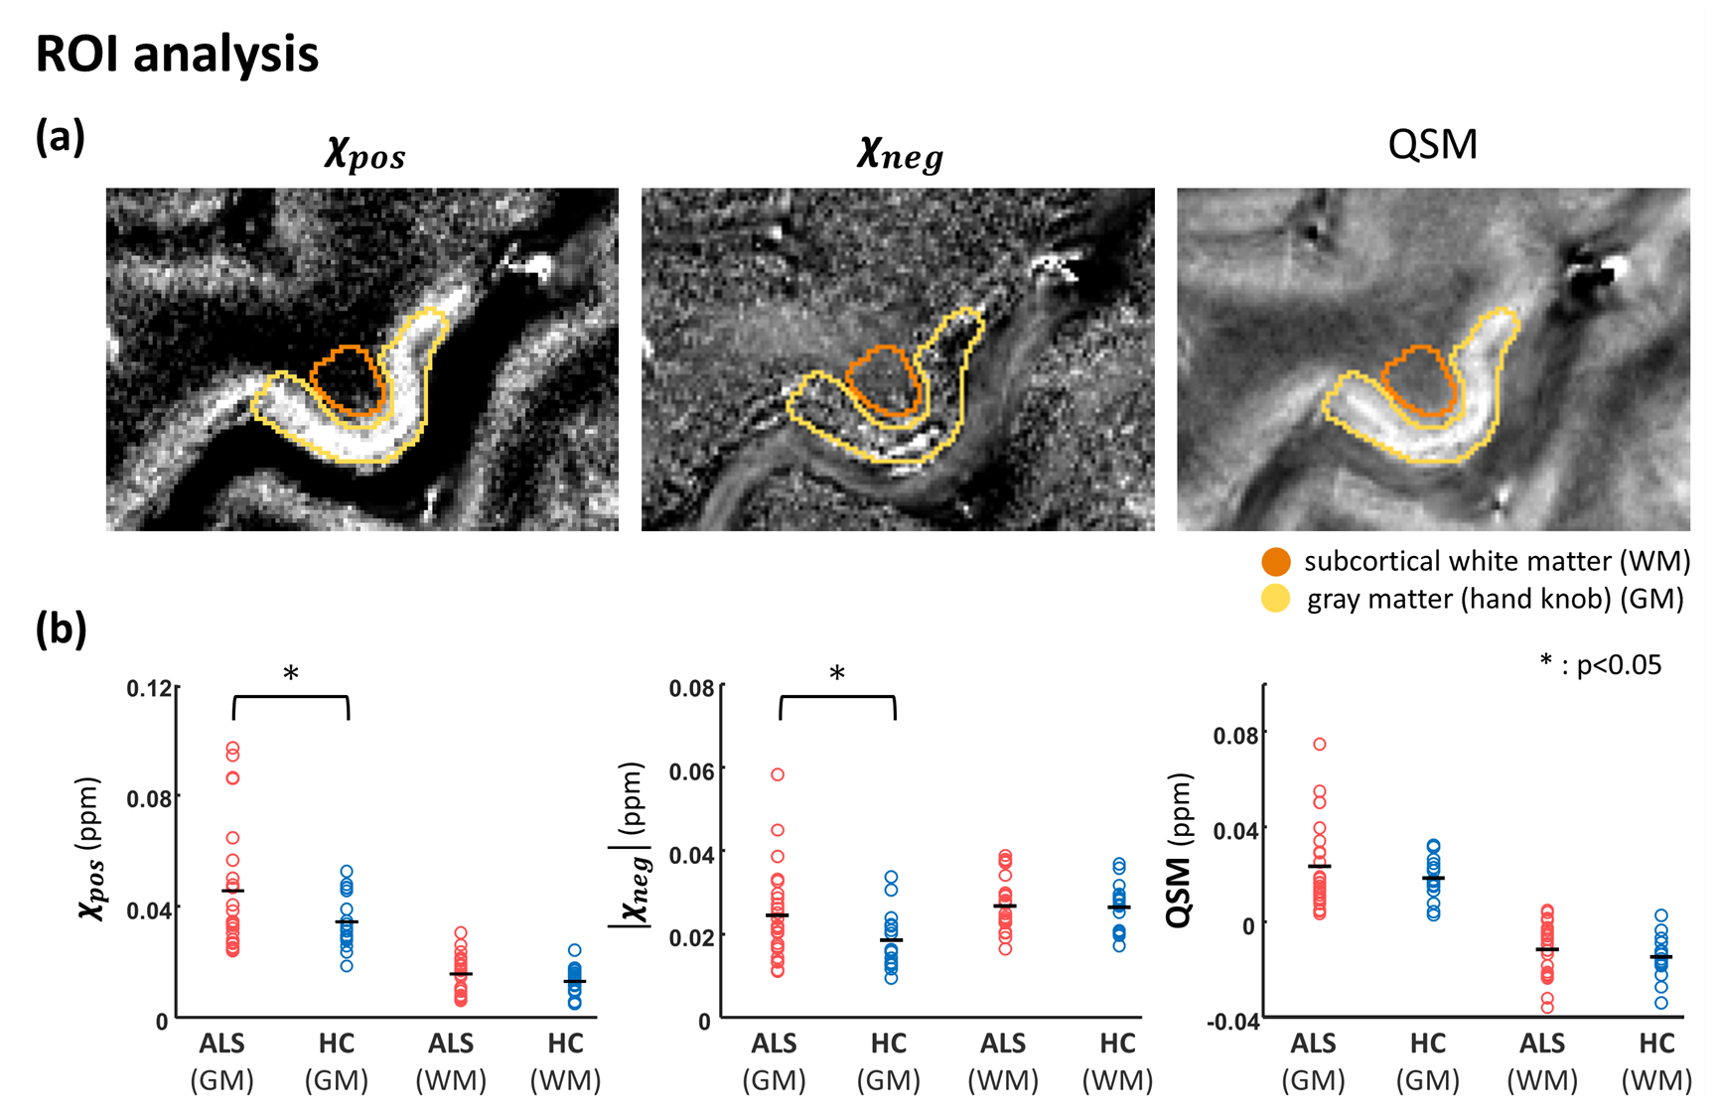
Figure 4. The susceptibility values in healthy controls vs ALS patients. (a) Region of interest analysis on susceptibility maps. The region drawn within the yellow line indicates the gray matter (hand knob), and with orange line indicates the edge of the white matter region. (b) The mean value of ROI in every subject (red: ALS patients, blue: healthy controls). The black line indicates the group average across the subjects. 𝜒pos and 𝜒neg reveal higher intensity in the hand knob of ALS patients than in healthy controls (p<0.05). QSM shows no significant differences.