5339
Spatial Correspondence Between fMRI and Frequency-Specific Electrophysiological Networks in Treatment Resistant Depression
Niki Sabetfakhri1, Joline Fan2, Natalya Slepneva 1, Julian Motzkin2,3, Melanie Morrison4, Leo Sugrue4, Andrew Krystal1, and A Moses Lee 1
1Department of Psychiatry and Behavioral Sciences, UCSF, San Francisco, CA, United States, 2Department of Neurology, UCSF, San Francisco, CA, United States, 3Department of Anesthesia and Perioperative Care, UCSF, San Francisco, CA, United States, 4Department of Radiology and Biomedical Imaging, UCSF, San Francisco, CA, United States
1Department of Psychiatry and Behavioral Sciences, UCSF, San Francisco, CA, United States, 2Department of Neurology, UCSF, San Francisco, CA, United States, 3Department of Anesthesia and Perioperative Care, UCSF, San Francisco, CA, United States, 4Department of Radiology and Biomedical Imaging, UCSF, San Francisco, CA, United States
Synopsis
Keywords: Psychiatric Disorders, fMRI (resting state), Stereoencephalography (sEEG)
Here, we obtained pre-operative fMRI and intracranial recordings from two subjects with treatment-refractory depression undergoing stereoencephalography as part of a DBS study. Intracranial recordings were obtained from leads bilaterally implanted in the orbitofrontal cortex, subgenual cingulate, ventral striatum, hippocampus, and amygdala. fMRI-based resting-state functional connectivity (RSFC) was calculated for ROIs defined by the recording sites. We identified significant spatial correlations between power bandpassed in canonical frequency bands and fMRI RSFC. Correlations between both modalities were highest within the beta band. These data suggest that it is possible to map between networks defined by fMRI and intracranial electrophysiology.Introduction
Mental health disorders, such as major depressive disorder, are widely believed to be mediated by dysfunctional brain networks. Non-invasive resting-state fMRI (rsfMRI) and intracranial electrophysiological recordings represent two methods for characterizing pathological brain networks for targeting therapeutic neuromodulation. While fMRI is spatially comprehensive, intracranial recordings are a more direct measure of brain electrophysiological activity and can resolve oscillatory brain activity due to its high temporal resolution. Previous studies using invasive electrophysiological recordings in clinical populations with depression and anxiety have identified neural oscillatory activity in the beta band (14-30 Hz) across corticolimbic structures as a correlate of symptom severity1-3. Here, we aim to characterize the relationship between resting state fMRI and electrophysiological functional connectivity across low and high frequencies in cortico-striatal-limbic networks for two subjects with treatment resistant depression (TRD).Methods
Two subjects with severe TRD underwent stereoencephalography (sEEG) monitoring to inform the implantation of a deep brain stimulation (DBS) device as a part of the PRESIDIO trial at the University of California San Francisco. Pre-operative rsfMRI data were collected prior to implantation of bilateral intracranial leads in the orbitofrontal cortex, subgenual cingulate, ventral striatum, hippocampus, and amygdala. We acquired gradient-echo rsfMRI data using a 3T GE scanner with a 32-channel head coil, TR/TE=2s/30ms, voxel size=3.75x3.75x4cm, flip angle=86, and FOV=24cm.The fMRI data were preprocessed with fMRIprep. Specific preprocessing steps included nonsteady state volume removal, slice-time correction, motion correction, normalization to MNI space, regression of cerebrospinal fluid and white matter global signal in addition to temporal derivatives and quadratic terms, bandpass filtering between 0.008 and 0.1 Hz, spatial smoothing with a 6mm FWHM kernel, and co-registration to the T1 weighted image. Spherical ROIs with 6 mm radii were generated at the electrode contact sites (N= 160) and the time series was extracted and averaged in each ROI using the AFNI toolbox. RSFC was then calculated as the correlation between mean timeseries for all possible combinations of electrode ROIs.
For the sEEG data, high gamma (70-150 Hz), low gamma (30-70 Hz), beta (14-30 Hz), alpha (8-14 Hz), theta (4-8 Hz), delta (1-4 Hz) power envelopes were extracted using the Hilbert transform. Power envelopes were normalized across each channel and averaged across 1s bins. Electrophysiological FC was measured as the correlation of the envelope of each frequency band between recording sites.
Spatial correlation between seed-based electrophysiological FC for each frequency range and fMRI RSFC was calculated with a (Fisher r-to-z transformed) Pearson correlation. We then compared the correlation between FCfMRI-FCsEEG for each frequency range.
Results
We studied two subjects with treatment resistant depression who had intracranial electrodes implanted in limbic networks (Fig. 1A). We first derived functional connectivity maps for fMRI fMRI FC and electrophysiological FC at each frequency range (Fig. 1B, C). In both subjects, sEEG FC in each frequency band was spatially correlated to fMRI RSFC in all subjects. Correlations between sEEG and fMRI were highest for the beta band [S1: mean r = 0.49, P < 0.0001, S2: mean r = 0.46, P < 0.0001] compared to other bands across pairs of electrode contacts/ROIs (Fig. 2A). There were significant correlation between fMRI-based FC and sEEG-based FC in multiple regions including the amygdala, hippocampus, and orbitofrontal cortex (Fig. 2B).Discussion
Here, we show a strong spatial correlation between electrophysiological FC and fMRI RSFC in a unique cohort of subjects with TRD implanted with electrodes in the corticolimbic networks. Interestingly, electrophysiological FC in the beta band correlated best with fMRI RSFC in both subjects. This relationship was consistent in several corticolimbic structures, including the amygdala, hippocampus, and orbitofrontal cortex.Our results replicate findings from previous studies showing correspondence between rsfMRI and electophysiological FC across multiple frequency ranges4,5. Recent studies have associated beta frequency activity with anxious thinking and depression1-3. It is therefore possible that beta activity is more robust in limbic networks of individuals with TRD.
Conclusion
Our results thus far suggest a mapping between depression networks identified using invasive and non-invasive methods for understanding the spatial organizations of brain networks.Acknowledgements
These studies were generously funded by the Ray and Dagmar Dolby Family Fund and the Foundation for OCD Research.References
- Sendi MSE, Waters AC, Tiruvadi V, et al. Intraoperative neural signals predict rapid antidepressant effects of deep brain stimulation. Transl Psychiatry. 2021;11(1):551.
- de Hemptinne C, Chen W, Racine CA, et al. Prefrontal Physiomarkers of Anxiety and Depression in Parkinson's Disease. Front Neurosci. 2021;15:748165.
- Kirkby LA, Luongo FJ, Lee MB, et al. An Amygdala-Hippocampus Subnetwork that Encodes Variation in Human Mood. Cell. 2018;175(6):1688-1700.e14.
- Hacker CD, Snyder AZ, Pahwa M, et al. Frequency-specific electrophysiologic correlates of resting state fMRI networks. Neuroimage. 2017;149:446-457.
- Kucyi A, Schrouff J, Bickel S, et al. Intracranial Electrophysiology Reveals Reproducible Intrinsic Functional Connectivity within Human Brain Networks. J Neurosci. 2018;38(17):4230-4242.
Figures
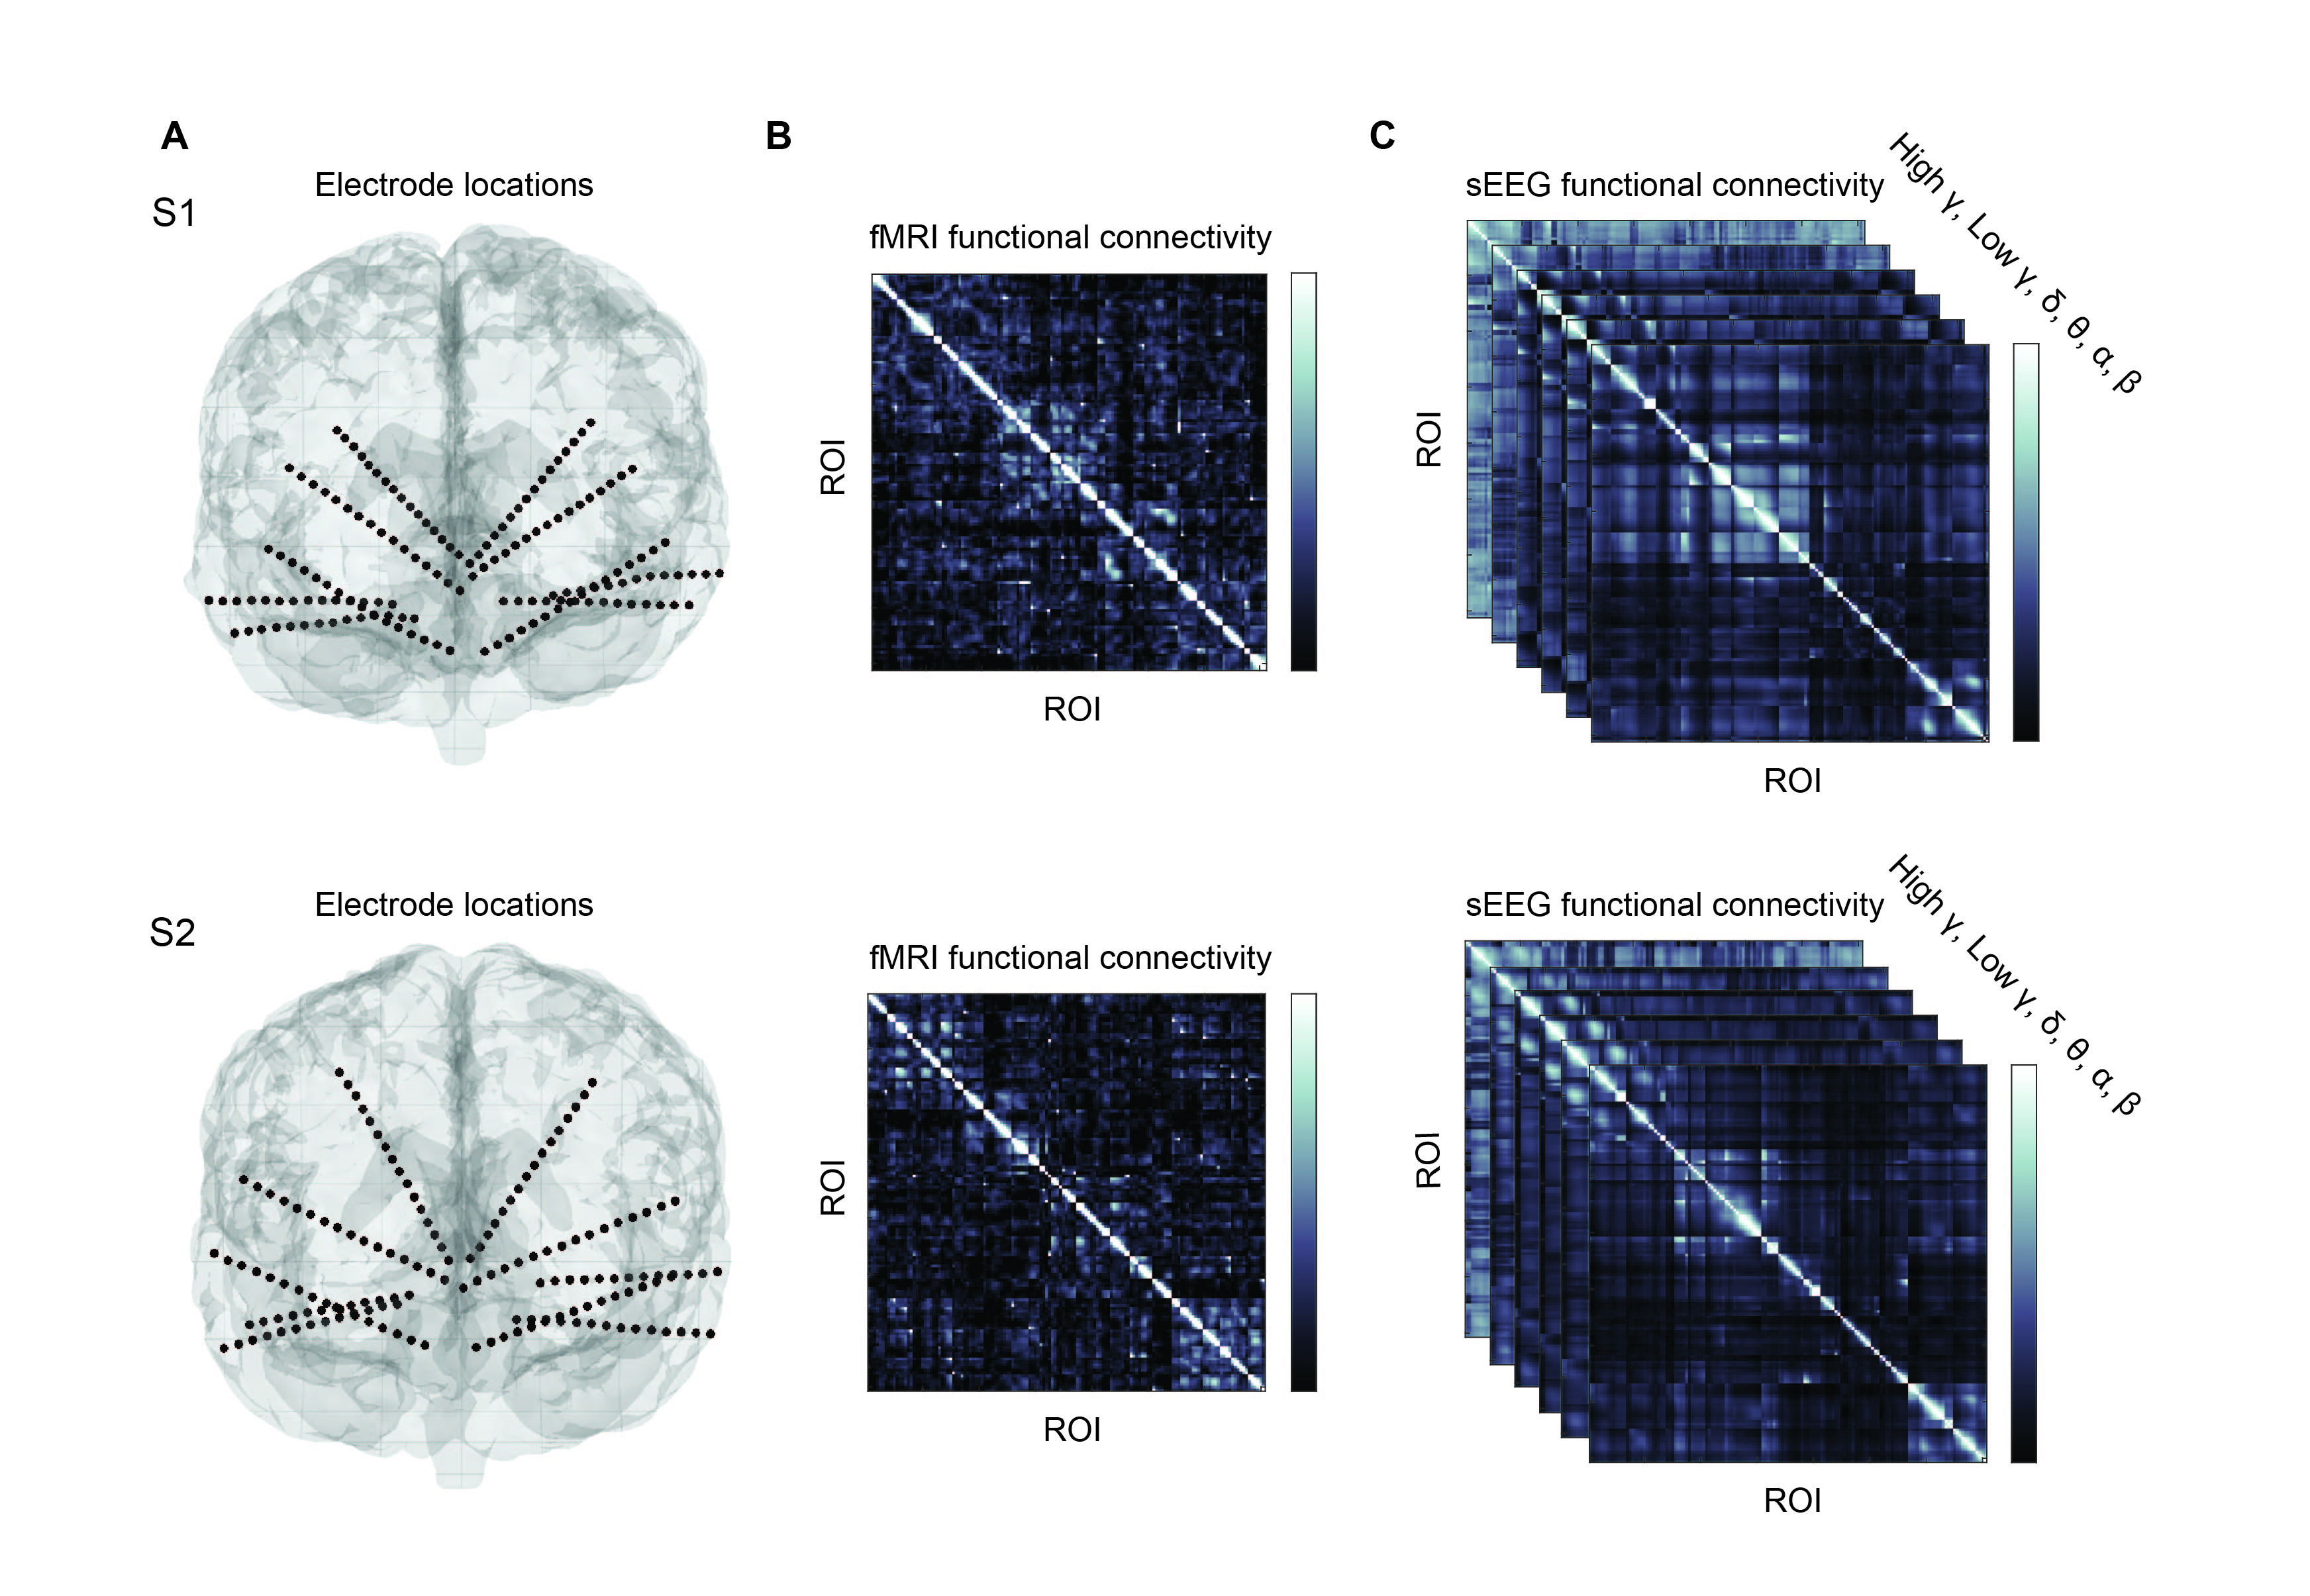
Figure 1. Measuring electrophysiological and resting-state fMRI FC. A) Two subjects with TRD were implanted with ten sEEG electrodes bilaterally in the orbitofrontal cortex, amygdala, hippocampus, ventral capsule and subgenual cingulate. B) ROIs derived from the location of electrode contacts were used to construct fMRI-based RSFC matrices for each subject. C) Frequency specific FC was measured by calculating envelope amplitude correlations of averaged sEEG time courses.
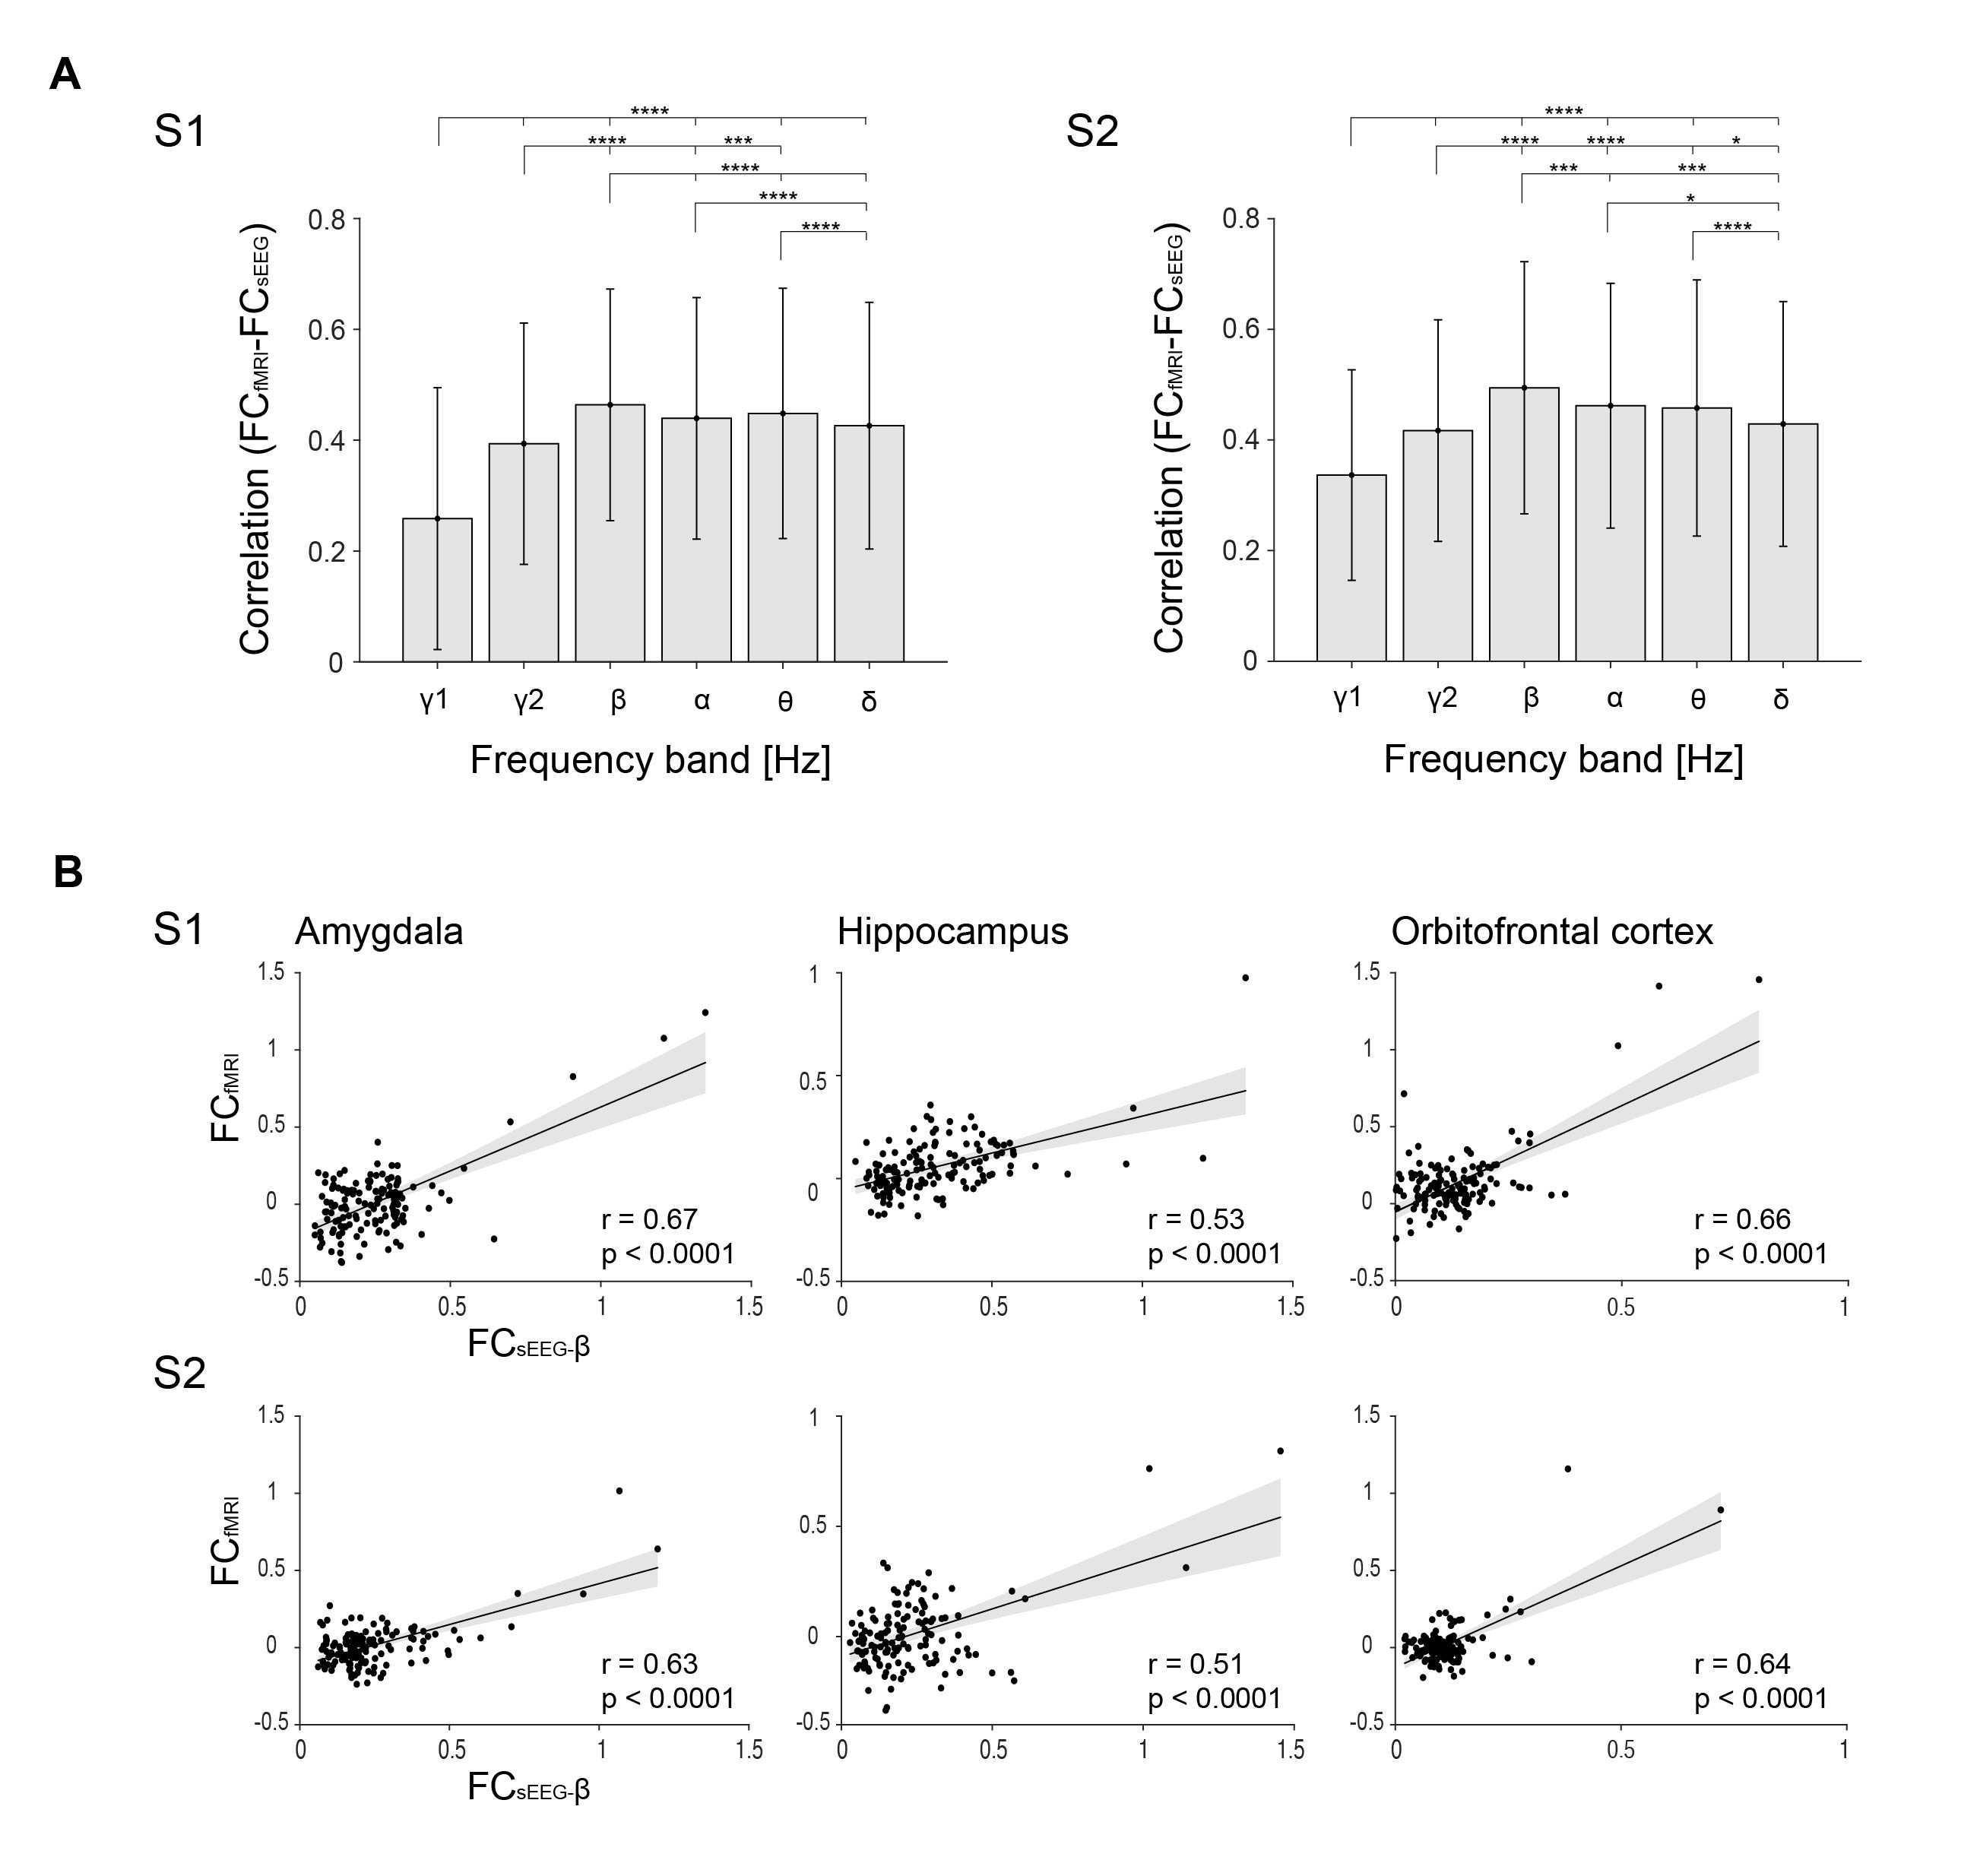
Figure 2. Correspondence between FCfMRI-FCsEEG. A) Averaged correlations between fMRI RSFC and FC in each frequency are shown. Significance bars indicate significance between each band and remainder bands (signed-rank, *p<0.05, **p<0.01, ***p<0.001, ****p<0.0001). Error bars correspond to mean +/- SD. Frequencies include γ1 (70-150 Hz), γ2 (30-70 Hz), β (14-30 Hz), α, (8-14 Hz), θ (4-8 Hz), and δ (1-4 Hz). B) Example scatterplots of fMRI FC versus beta-limited FC for electrode contacts within the amygda, hippocampus, and orbitofrontal cortex.
DOI: https://doi.org/10.58530/2023/5339