5335
7T MRI and CSF correlates of brain iron accumulation, neurodegeneration and neuroinflammation in Huntington's Disease: Study Protocol
Nadine van de Zande1, Marjolein Bulk2, Chloé Najac2, Louise van der Weerd2,3, Jeroen de Bresser2, Jan Lewerenz4, Itamar Ronen5, and Susanne de Bot1
1Neurology, Leiden University Medical Centre, Leiden, Netherlands, 2Radiology, Leiden University Medical Centre, Leiden, Netherlands, 3Human Genetics, Leiden University Medical Centre, Leiden, Netherlands, 4Neurology, University of Ulm, Ulm, Germany, 5Clinical Imaging Sciences Centre, Brighton and Sussex Medical School, Brighton, United Kingdom
1Neurology, Leiden University Medical Centre, Leiden, Netherlands, 2Radiology, Leiden University Medical Centre, Leiden, Netherlands, 3Human Genetics, Leiden University Medical Centre, Leiden, Netherlands, 4Neurology, University of Ulm, Ulm, Germany, 5Clinical Imaging Sciences Centre, Brighton and Sussex Medical School, Brighton, United Kingdom
Synopsis
Keywords: Neuroinflammation, Quantitative Susceptibility mapping, Huntington's Disease
HD is a rare, autosomal dominant inherited, progressive, neurodegenerative disorder. Strong evidence suggests a significant role for iron accumulation and neuroinflammation in HD. Previous studies already showed iron accumulation in the brain of patients with HD, but no other study linked these results with well-accepted biofluid biomarkers for neuroinflammation, or with neuroimaging methods to assess neuroinflammation. This study will provide an important basis for the evaluation of brain iron levels and neuroinflammation metabolites as imaging biomarkers for disease state and progression in HD and their relationship with the salient pathophysiological mechanisms of the disease.Introduction
HD is a rare, autosomal dominant inherited, progressive, neurodegenerative disorder, caused by CAG repeat expansion of exon 1 in the HTT gene on chromosome 41. In addition to the well-documented neurodegenerative aspect of HD, strong evidence suggests a significant role for iron accumulation and neuroinflammation in HD2-22. Previous studies, focusing on iron accumulation in neurodegenerative diseases such as Alzheimer’s disease as well as HD, have shown that iron appears to be absorbed by activated microglia, the resident macrophages of the brain16-19, 23. It is therefore thought that cerebral iron accumulation in humans is at least in part explained by iron-accumulating microglia in affected brain regions, linking iron to inflammation, a key pathological mechanism in neurodegenerative diseases9, 10, 16, 24-26.
No previous study in a neurodegenerative disease has linked the observed increase of brain iron accumulation as measured by MRI with direct well-established cerebrospinal fluid (CSF) and blood biomarkers. Taking advantage of the human ultrahigh field MR scanner (7T) available at the Leiden University Medical Centre (LUMC), we designed a protocol to evaluate changes in iron metabolism (using Quantified Susceptibility Mapping, QSM), metabolism (using Magnetic Resonance Spectroscopy, MRS), microstructure (using Diffusion Weighted Spectroscopy, DWS) and investigate their association with well-known clinical biofluid markers for iron accumulation, neuroinflammation and neurodegeneration (CSF and blood measurements), see Figure 1. Here we present an overview of our study protocol to connect with other researchers performing similar research, exchange knowledge and ideas to optimize our acquisition and analysis, and to enable collaborations for future multicentre projects. Data acquisition has already begun and we are planning on finishing our baseline visits in July 2023.
Material and methods
Study design: This is an observational cross-sectional cohort study with a multimodal design and a clinical one-year follow-up. The study was approved by the Medical Ethics Committee Leiden Den Haag Delft. This study will include the following procedures: motor, functional and neuropsychological assessments, a 7T-MRI scan of 60 minutes, a lumbar puncture to obtain CSF and blood sampling. CSF and blood will be tested on biofluid biomarkers for iron accumulation, neuroinflammation and neurodegeneration. The study design is outlined in Table 1. After one year, the clinical study assessments will be repeated, to assess disease progression.
Subjects: The study population will include 65 HD patients and 25 healthy control subjects of 21 years of age and older. The two groups will be age and sex matched as much as possible. We will include 25 pre-, 20 early-, and 20 moderate manifest HD patients, resulting in a variation in symptoms and disease severity, ensuring coverage of a broad spectrum of the disease. For individuals clinically diagnosed with HD, a positive genetic test with a CAG repeat expansion of ≥ 36 in the HTT gene is required to be enrolled in this study.
MRI: All scans are performed locally at the LUMC using a 7T Philips Achieva MRI scanner (Philips Healthcare). For the details of the standardized scan protocol, refer to Table 2. Spectra acquisition was acquired on a volume-of-interest (VOI). This VOI was placed manually to include as much of the regions of interest: pallidum, putamen and caudate nucleus, without including CSF of the lateral ventricle. Established pipelines for basic segmentation of anatomical images, co-registration and basic motion and intensity corrections are applied, using SPM27, FSL28 and/or MIPAV/JIST toolbox29, 30. We use the QSM processing pipeline tool SEPIA to generate QSM maps from multi-echo data31. By using established pipelines we obtain voxel-wise susceptibility values indicative for iron content for predefined structures, such as the striatum. MRS and DWS data analysis is performed with in-house Matlab routine and LCModel32.
Statistics: One-way ANOVA’s will be used to assess baseline between group differences. Potentially confounding demographic variables (age, gender) will be examined and those found significant will be included as covariates for subsequent analyses. The distributions of the MRI and CSF markers will be tested for normality. If applicable, appropriate non-parametric test will be used and corrections for multiple comparisons will be performed. For all statistics the significance is set at p<0.05.
Discussion
Neuroimaging, using MRI, is appealing as a potential biomarker for disease progression due to its ability to provide putative markers for several pathological mechanism in a non-ionizing and predominantly non-invasive manner. To date, several MRI studies in neurodegenerative diseases, including HD, showed the relevance of brain iron accumulation and neuroinflammation2-22. Some reports showed elevated iron levels in premanifest patients, compared to healthy controls. They also showed correlations with disease severity, pointing to MRI readouts of iron accumulation in the brain as a potential early biomarker3, 6. Nevertheless, before such biomarker can be used in the clinic, more research is needed to examine the clinical value and study its correlation with well-accepted biofluid markers and metabolites characteristic of neuroinflammation.
Conclusion
Our study will provide an important basis for the evaluation of brain iron levels and neuroinflammation metabolites as imaging biomarkers for disease state and progression in HD and their relationship with the salient pathophysiological mechanisms of the disease.
Acknowledgements
This project has received funding from the European Huntington Disease Network (EHDN) with an EHDN seed fund (Project code: 959, Project title: Association Between Iron Dysregulation, Neuroinflammation and Clinical Measures in Huntington's Disease).References
1. A novel gene containing a trinucleotide repeat that is expanded and unstable on huntington's disease chromosomes. The huntington's disease collaborative research group. Cell. 1993;72:971-983 2. Dexter DT, Carayon A, Javoy-Agid F, Agid Y, Wells FR, Daniel SE, et al. Alterations in the levels of iron, ferritin and other trace metals in parkinson's disease and other neurodegenerative diseases affecting the basal ganglia. Brain. 1991;114 ( Pt 4):1953-19753. Domínguez JF, Ng AC, Poudel G, Stout JC, Churchyard A, Chua P, et al. Iron accumulation in the basal ganglia in huntington's disease: Cross-sectional data from the image-hd study. J Neurol Neurosurg Psychiatry. 2016;87:545-549
4. Dumas EM, Versluis MJ, van den Bogaard SJA, van Osch MJP, Hart EP, van Roon-Mom WMC, et al. Elevated brain iron is independent from atrophy in huntington's disease. NeuroImage. 2012;61:558-564
5. Muller M, Leavitt BR. Iron dysregulation in huntington's disease. J Neurochem. 2014;130:328-350 6. van Bergen JM, Hua J, Unschuld PG, Lim IA, Jones CK, Margolis RL, et al. Quantitative susceptibility mapping suggests altered brain iron in premanifest huntington disease. AJNR Am J Neuroradiol. 2016;37:789-796
7. van den Bogaard SJ, Dumas EM, Roos RA. The role of iron imaging in huntington's disease. Int Rev Neurobiol. 2013;110:241-250
8. Zecca L, Youdim MB, Riederer P, Connor JR, Crichton RR. Iron, brain ageing and neurodegenerative disorders. Nat Rev Neurosci. 2004;5:863-873
9. Crotti A, Glass CK. The choreography of neuroinflammation in huntington's disease. Trends Immunol. 2015;36:364-373
10. Möller T. Neuroinflammation in huntington's disease. J Neural Transm (Vienna). 2010;117:1001-1008
11. Silvestroni A, Faull RL, Strand AD, Möller T. Distinct neuroinflammatory profile in post-mortem human huntington's disease. Neuroreport. 2009;20:1098-1103
12. Kumar A, Ratan RR. Oxidative stress and huntington's disease: The good, the bad, and the ugly. J Huntingtons Dis. 2016;5:217-237
13. Chen L, Hua J, Ross CA, Cai S, van Zijl PCM, Li X. Altered brain iron content and deposition rate in huntington's disease as indicated by quantitative susceptibility mri. J Neurosci Res. 2019;97:467-479 14. Bulk M, Hegeman-Kleinn I, Kenkhuis B, Suidgeest E, van Roon-Mom W, Lewerenz J, et al. Pathological characterization of t2*-weighted mri contrast in the striatum of huntington's disease patients. Neuroimage Clin. 2020;28:102498
15. Johnson EB, Parker CS, Scahill RI, Gregory S, Papoutsi M, Zeun P, et al. Altered iron and myelin in premanifest huntington's disease more than 20 years before clinical onset: Evidence from the cross-sectional hd young adult study. EBioMedicine. 2021;65:103266
16. Thomsen MS, Andersen MV, Christoffersen PR, Jensen MD, Lichota J, Moos T. Neurodegeneration with inflammation is accompanied by accumulation of iron and ferritin in microglia and neurons. Neurobiol Dis. 2015;81:108-118
17. Zeineh MM, Chen Y, Kitzler HH, Hammond R, Vogel H, Rutt BK. Activated iron-containing microglia in the human hippocampus identified by magnetic resonance imaging in alzheimer disease. Neurobiol Aging. 2015;36:2483-2500
18. Pavese N, Gerhard A, Tai YF, Ho AK, Turkheimer F, Barker RA, et al. Microglial activation correlates with severity in huntington disease: A clinical and pet study. Neurology. 2006;66:1638-1643 19. Sapp E, Kegel KB, Aronin N, Hashikawa T, Uchiyama Y, Tohyama K, et al. Early and progressive accumulation of reactive microglia in the huntington disease brain. J Neuropathol Exp Neurol. 2001;60:161-172
20. Simmons DA, Casale M, Alcon B, Pham N, Narayan N, Lynch G. Ferritin accumulation in dystrophic microglia is an early event in the development of huntington's disease. Glia. 2007;55:1074-1084
21. Tai YF, Pavese N, Gerhard A, Tabrizi SJ, Barker RA, Brooks DJ, et al. Imaging microglial activation in huntington's disease. Brain Res Bull. 2007;72:148-151
22. Tai YF, Pavese N, Gerhard A, Tabrizi SJ, Barker RA, Brooks DJ, et al. Microglial activation in presymptomatic huntington's disease gene carriers. Brain. 2007;130:1759-1766
23. Meadowcroft MD, Connor JR, Yang QX. Cortical iron regulation and inflammatory response in alzheimer's disease and appswe/ps1δe9 mice: A histological perspective. Front Neurosci. 2015;9:255 24. Edison P, Donat CK, Sastre M. In vivo imaging of glial activation in alzheimer's disease. Front Neurol. 2018;9:625
25. Heneka MT, Carson MJ, El Khoury J, Landreth GE, Brosseron F, Feinstein DL, et al. Neuroinflammation in alzheimer's disease. Lancet Neurol. 2015;14:388-405
26. Urrutia PJ, Mena NP, Núñez MT. The interplay between iron accumulation, mitochondrial dysfunction, and inflammation during the execution step of neurodegenerative disorders. Front Pharmacol. 2014;5:38
27. Friston KJ, Ashburner J, Frith CD, Poline JB, Heather JD, Frackowiak RSJ. Spatial registration and normalization of images. Hum Brain Mapp. 1995;3:165-189
28. Smith SM, Jenkinson M, Woolrich MW, Beckmann CF, Behrens TE, Johansen-Berg H, et al. Advances in functional and structural mr image analysis and implementation as fsl. Neuroimage. 2004;23 Suppl 1:S208-219
29. Lucas BC, Bogovic JA, Carass A, Bazin PL, Prince JL, Pham DL, et al. The java image science toolkit (jist) for rapid prototyping and publishing of neuroimaging software. Neuroinformatics. 2010;8:5-17 30. McAuliffe M, Lalonde F, McGarry D, Gandler W, Csaky K, Trus B. Medical image processing, analysis and visualization in clinical research. Proceedings of the 14th IEEE Symposium on Computer-Based Medi cal Systems (CBMS 2001). 2001:381-386
31. Chan KS, Marques JP. Sepia-susceptibility mapping pipeline tool for phase images. Neuroimage. 2021;227:117611
32. Provencher SW. Estimation of metabolite concentrations from localized in-vivo proton nmr-spectra. Magnet Reson Med. 1993;30:672-679
33. Marques JP, Kober T, Krueger G, van der Zwaag W, Van de Moortele PF, Gruetter R. Mp2rage, a self bias-field corrected sequence for improved segmentation and t1-mapping at high field. Neuroimage. 2010;49:1271-1281
Figures
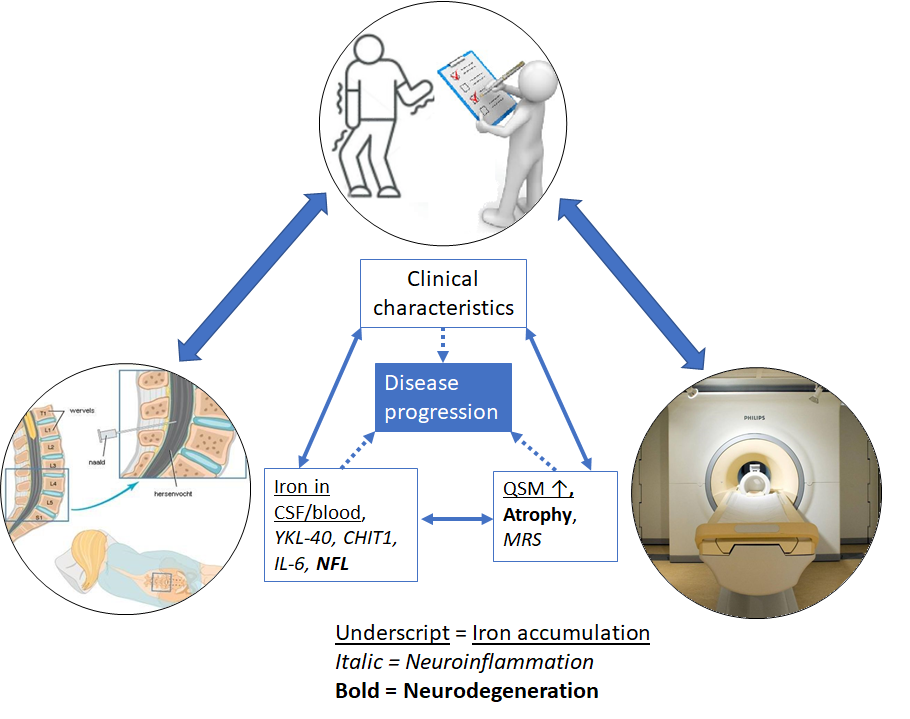
Figure 1: Three modalities covered by the study: neuro(psychological)
assessment, CSF and 7T-MRI, showing the pathophysiological mechanisms and
associated markers that are included.
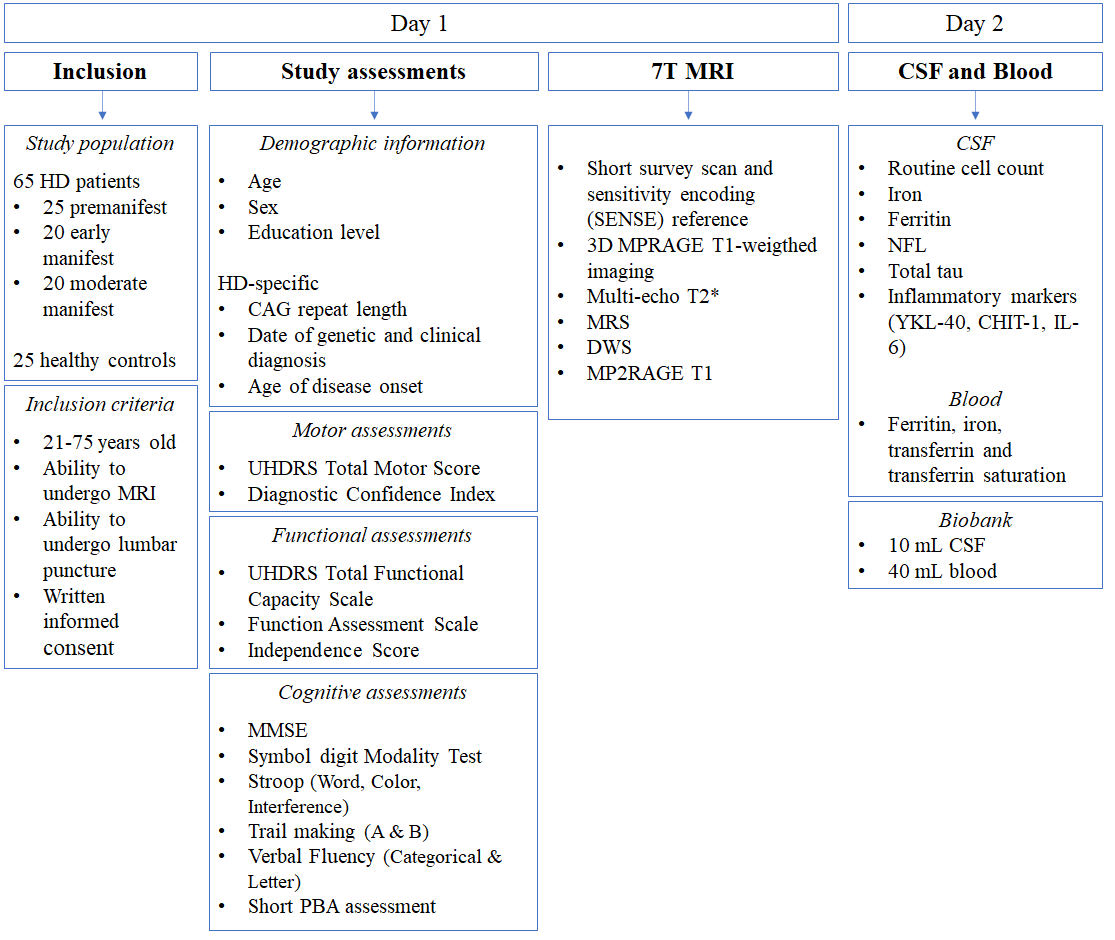
Table 1: Study Design and flow chart of the Baseline visit. Abbreviations:
HD = Huntington’s Disease, MRI = Magnetic Resonance Imaging. UHDRS = Unified
Huntington’s Disease Rating Scale. MMSE = Mini-Mental State Examination, PBA =
Problem Behaviors Assessment, MRS = Magnetic Resonance Spectroscopy, DWS =
Diffusion Weighted Spectroscopy, CSF = Cerebrospinal fluid, NFL = Neurofilament
light, IL = Interleukin.
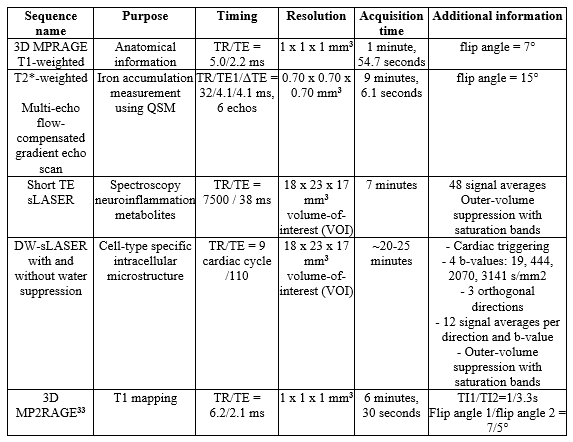
Table 2: Standardized scan protocol, on the 7T-MRI-scanner at the LUMC, to
assess iron accumulation, neuroinflammation and neurodegeneration in the study
population.
DOI: https://doi.org/10.58530/2023/5335