5334
The effect of elevated serum lactate on measures of apparent cerebral metabolism and perfusion in the anesthetised rodent brain.1Oxford Centre for Clinical Magnetic Resonance Research, University of Oxford, Oxford, United Kingdom, 2Department of Pharmacology, University of Oxford, Oxford, United Kingdom, 3Department of Physiology Anatomy and Genetics, University of Oxford, Oxford, United Kingdom, 4Nuffield Department of Clinical Neurosciences, University of Oxford, Oxford, United Kingdom, 5Department of Radiology, University of Oxford, Oxford, United Kingdom, 6Institute of Cancer and Genomic Sciences, University of Birmingham, Birmingham, United Kingdom
Synopsis
Keywords: Neurodegeneration, Hyperpolarized MR (Non-Gas)
It is unclear how serum lactate perturbations influence the quantification of cerebral blood flow (CBF) and metabolism using proton perfusion imaging and hyperpolarized 13C MRI. Low dosage L-lactate injection increased CBF and cerebral LDH flux, whilst high dosage lactate decreased CBF and maintained the increased LDH flux, relative to saline administration. Lactate administration did not alter apparent oxidative metabolism. This suggests the efficacy of probing oxidative metabolism with 13C MRI when alterations in serum lactate are present (e.g. in pathology). But highlights the requirement for serum lactate measurement prior to interpretation of 13C metabolic data.Introduction
Hyperpolarized [1-13C]pyruvate MRI can directly observe [1-13C]lactate and 13C bicarbonate formation, thus probing real-time lactate dehydrogenase (LDH) and pyruvate dehydrogenase (PDH) flux in-vivo1. Combining hyperpolarized 13C MRI in tandem with proton MR perfusion imaging can probe cerebral blood flow (CBF)2 and metabolic changes3 present in pathology. However, it is unknown how perturbations in serum lactate, a signalling molecule4 and substrate for oxidative brain metabolism5, which is altered in pathology6 and ageing7, influence apparent cerebral perfusion and metabolism. This study aimed to characterise CBF and 13C metabolic responses to varying concentrations of L-lactate in the anesthetized rodent brain.Methods
ProtocolSprague Dawley rats were imaged using a 60:40% O2:N2O protocol. 10 animals were imaged once without a pre-scan intervention of saline or lactate to estimate cerebral perfusion.Using a cross-over design, 3 animals were imaged three times, receiving a 0.5mL intra-peritoneal injection, prior to imaging, of either saline or sodium L-lactate at 0.5 (half dose) and 1g/kg (full dose). Animals were anesthetised with 2.5% isoflurane (2% isoflurane during scanning). Serum lactate was measured prior to injection and following scanning.
Hyperpolarization
Approximately 30muL of 40mg [1-13C]pyruvic acid (Merck, New Jersey, USA) was mixed with trityl radical, OX063 (15mM) (Oxford Instruments, Abingdon, UK) and gadolinium (3L, 1:50 dilution in water) (Dotarem, Guerbet, France) and was hyperpolarized in a prototype hyperpolarizer system at 3.35 T for approximately 1 hour as previously described8. Samples were dissolved using sodium hydroxide buffer (approximately 4.5 mL) and 1 mL of final solution was injected over 4 seconds with a 200µL saline chase.
MRI
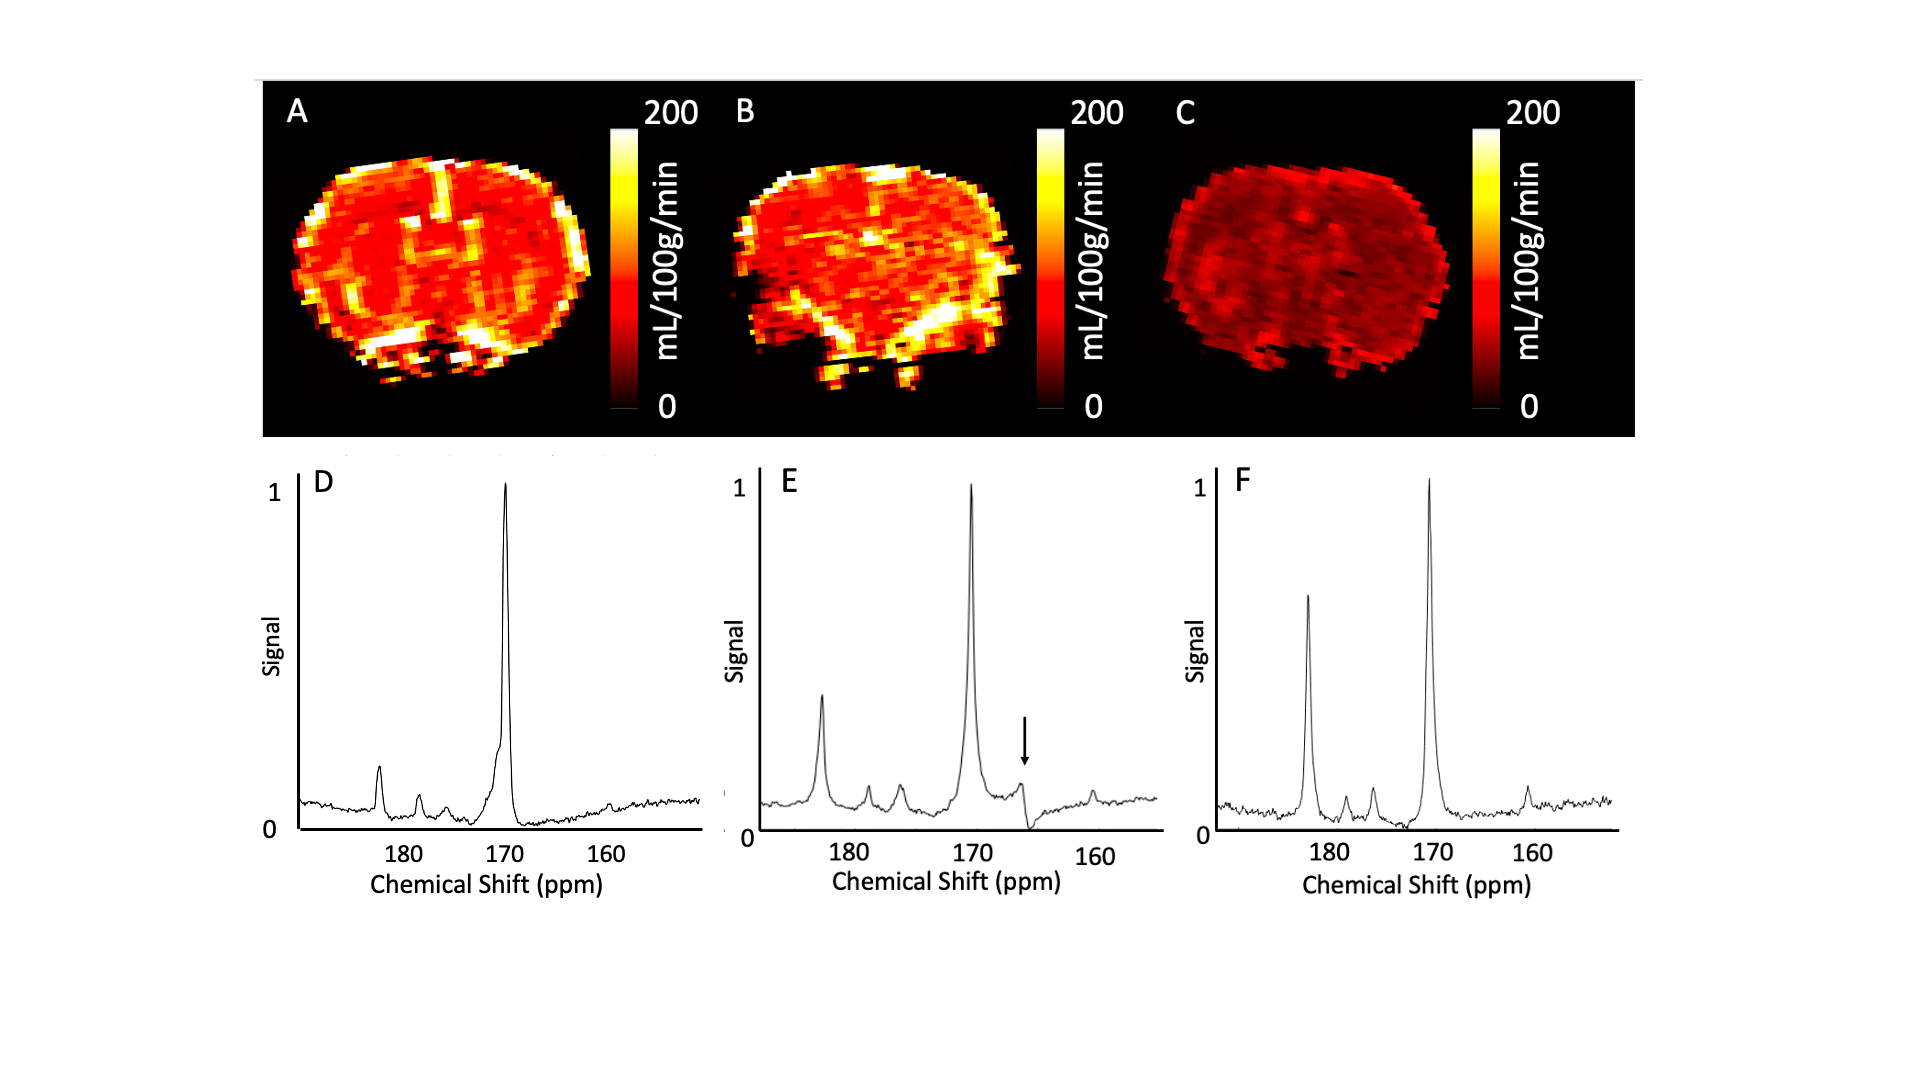
Animals were scanned using a 2-channel 13C receive coil using a 1H/13C volume coil for radiofrequency transmission (Rapid Biomedical, Rimpar). A pulse-acquire spectroscopic slab was placed through the brain of each animal (gauss excitation pulse, excitation pulse width = 100ms, receive bandwidth = 5kHz, TR = 1s, TE = 0.3ms, slice thickness = 20mm, FA = 15° , time points = 240). Animals were transferred to a second custom made cradle using a 4-channel 1H phased array head coil (Rapid Biomedical, Rimpar), for perfusion assessment (200µL Dotarem with 200µL saline chase, single slice 2D Gradient Echo, slice through mid-brain,) and anatomical T1-weighted imaging pre- and post-gadolinium bolus.
Post-processing
Spectra were processed using jMRUI (v5.1) using [1-13C]pyruvate, [1-13C]lactate, 13C bicarbonate, [1-13C]alanine, and [1-13C]pyruvate-hydrate as basis functions summed over the time 13C signal was present. [1-13C]lactate:[1-13C]pyruvate and 13C bicarbonate:[1-13C]pyruvate ratios were calculated.Cerebral perfusion data were post-processed using model-free deconvolution. A region of interest was drawn in supplying vessels to generate CBF, Cerebral Blood Volume (CBV), Time to peak, and Mean Transit Time maps. Measurement reproducibility was assessed by comparison of ROI’s drawn by five independent observers.
Statistical analysis
All statistical analysis was performed in R (4.0.5). Intra-class correlation coefficient (ICC) was calculated for inter-observer reliability of perfusion measurements. A Kruskal-Wallis test was used to assess variance between groups using paired post-hoc testing with a Bonferroni correction. Statistical significance was accepted at P<0.05
Results
Cerebral perfusion reproducibility.CBF reproducibility was (0.96 [0.92-0.99], CBV (0.98 [0.97-0.99], TTP (0.98 [0.96-0.99]), and MTT (0.99 [0.98-0.99].
Lactate modulates cerebral perfusion in the anesthetised rodent brain
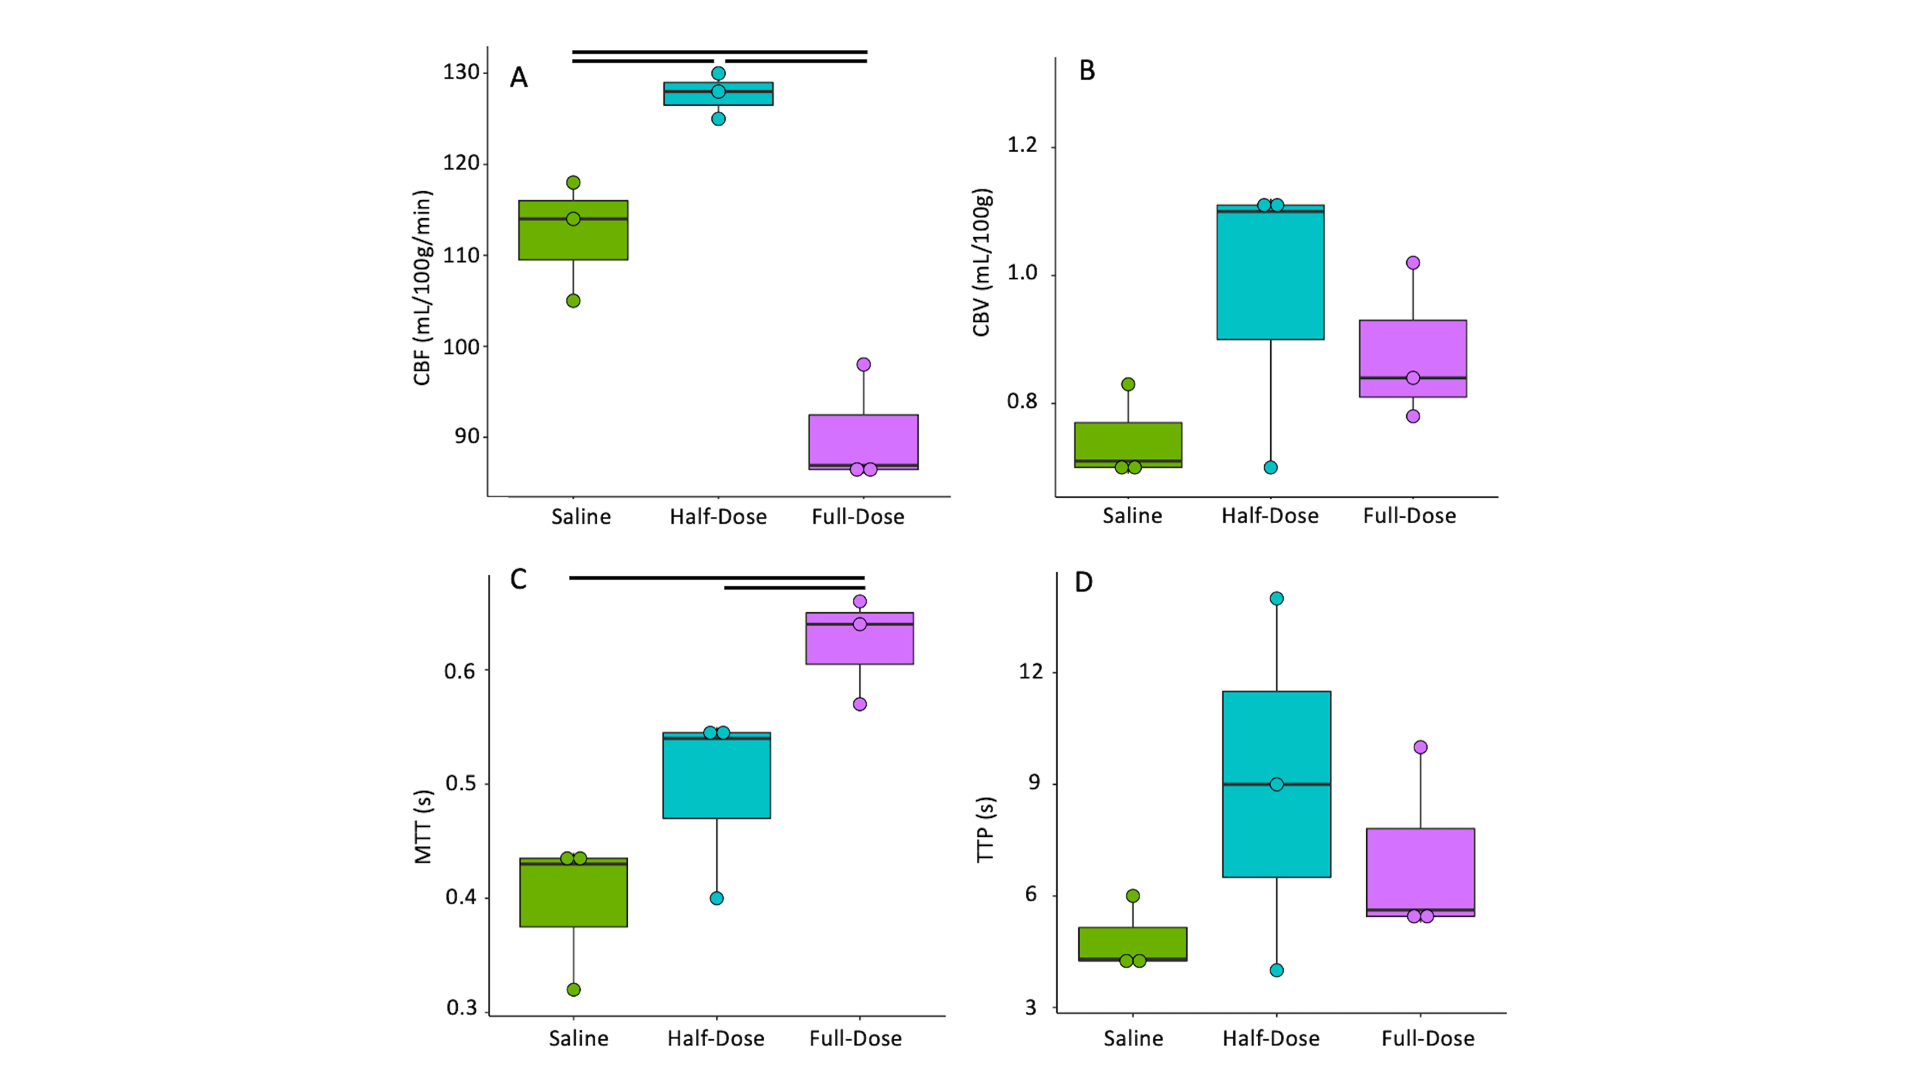
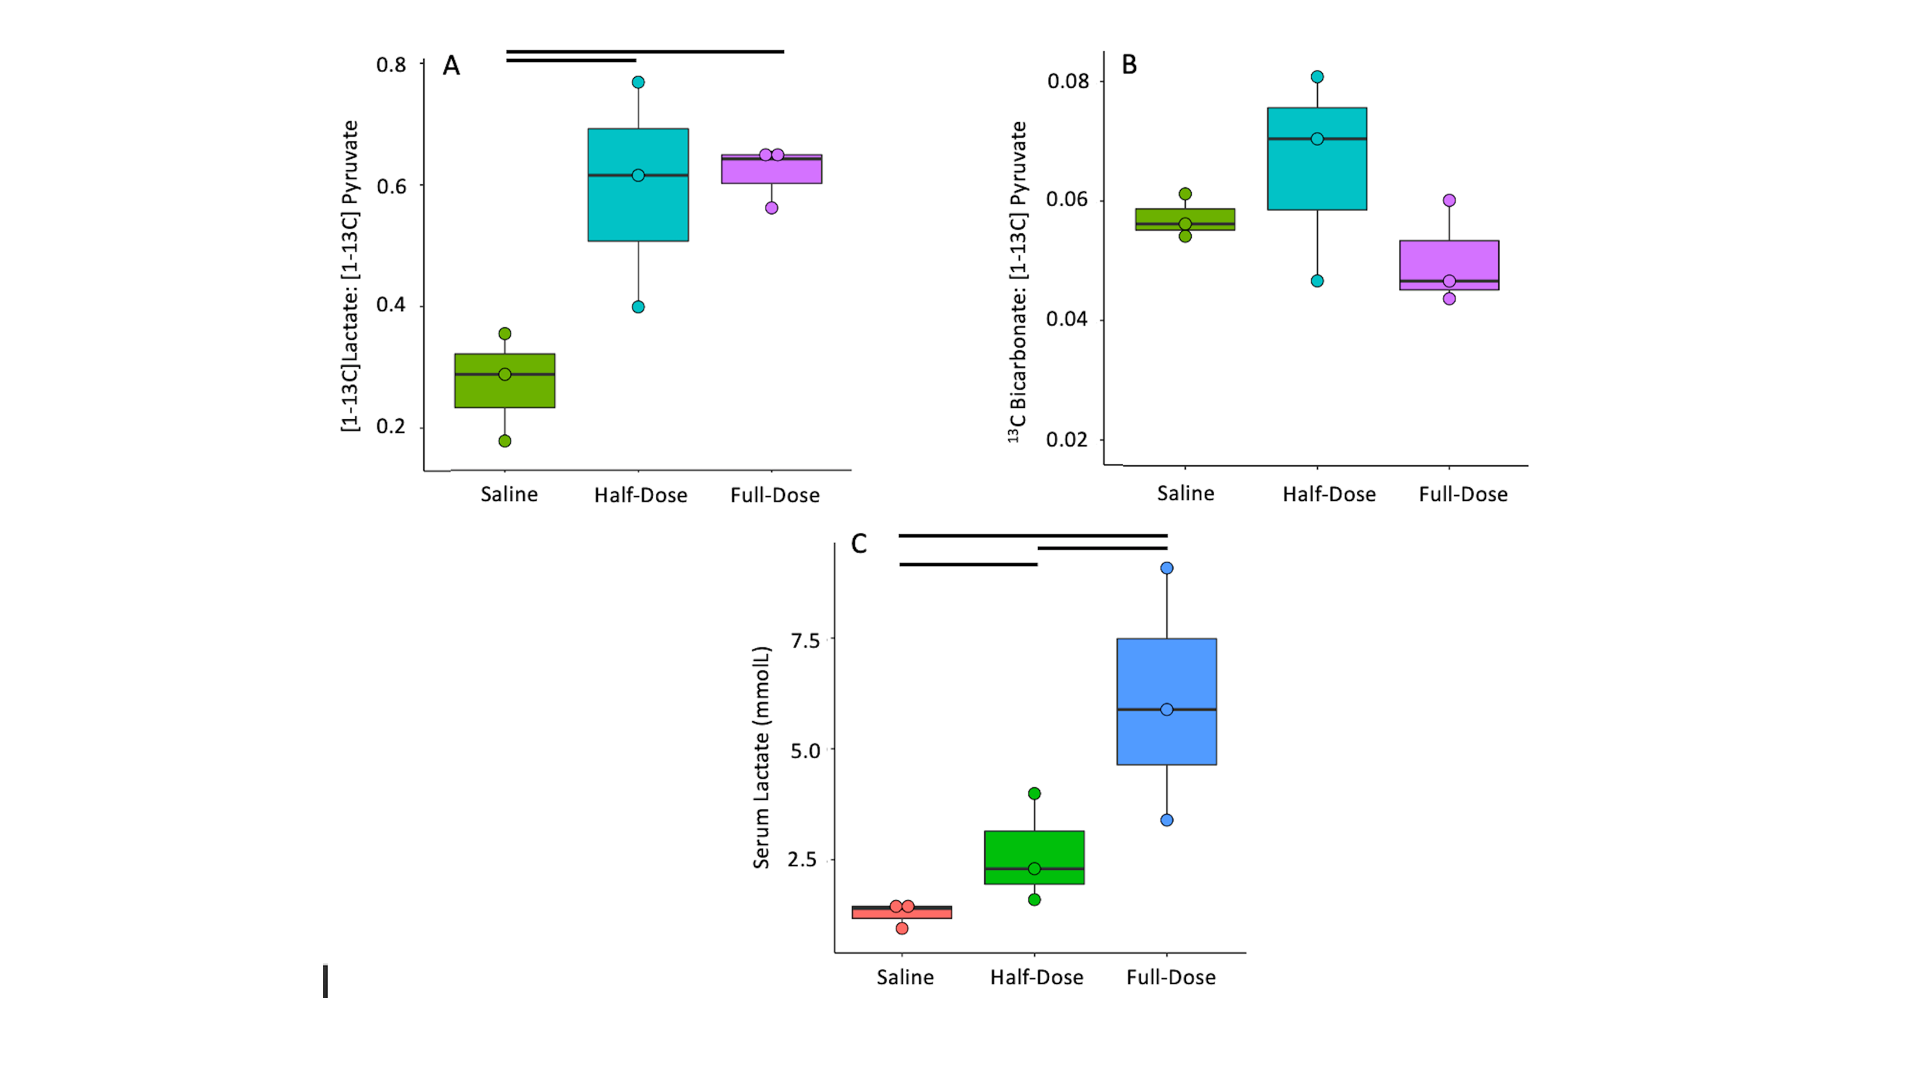
CBF increased between saline and half-dose lactate (112±5 vs 127±2 mL/100g/min) and decreased between saline and full dose lactate (112±5 vs 90±5 mL/100g/min) and between half dose and full dose lactate (127±2 vs 90±5 mL/100g/min) (Fig 2. A). CBV remained consistent between conditions (P=0.6). High dose lactate increased MTT relative to saline injection (0.62±0.04 s-1 vs0.39±0.05) and half dose lactate (0.62±0.04 vs 0.49±0.07 s-1) (Fig 2. C). TTP remained consistent between conditions (P=0.2). Measurements of lactate exchange, but not PDH flux, vary with lactate dose. The [1-13C]lactate:[1-13C]pyruvate ratio increased following half dose lactate relative to saline (0.59±0.15 vs 0.22±0.05). This was maintained at high dose lactate (0.62±0.04 vs 0.59±0.15) (Fig 3.A) End-scan serum lactate concentrations were greater following half dose (2.6±0.8 vs 1.3±0.2 mmolL-1) and full dose lactate relative to saline (6±2 vs 1.3±0.2 mmolL-1) and at full dose relative to half dose (6±2 mmolL-1 vs 2.6±0.8 mmolL-1) (Fig 3. C).13Cbicarbonate:[1-13C]pyruvate ratio was consistent between conditions (P=0.1 Fig 3.B).
Discussion
Consistent with the modulatory role of lactate on CBF, half dose lactate administration increased CBF, whereas high dose lactate decreased CBF relative to half dose lactate and saline conditions.13Clactate:13Cpyruvate ratio, reflecting the cerebral 12C lactate pool size and LDH flux, increased similarly following half and full dose lactate administration, relative to saline. 13C bicarbonate:13C pyruvate ratio, reflecting PDH flux and oxidative metabolism, was unresponsive to L-lactate administration and associated CBF response. This may reflect PDH saturation from the 13C pyruvate bolus or altered brain oxygen extraction fraction following CBF changes. These data may indicate the feasibility of probing oxidative metabolism using 13C MRI when serum lactate is perturbed due to pathology6 or therapeutic intervention9. Further, apparent alterations in LDH flux may reflect serum lactate changes as opposed to an inherent cellular pathology. Therefore, multi-variate analysis including serum metabolites are needed to elucidate clinical pathology.Conclusion
These data demonstrate preservation of cerebral oxidative metabolism (13C bicarbonate:13C-pyruvate) in the healthy rodent brain during experimental modulation of CBF and apparent cerebral LDH flux via L-lactate administration.Acknowledgements
No acknowledgement found.References
1. Grist, J. T., McLean, M. A., Riemer, F., Schulte, R. F., Deen, S. S., Zaccagna, F., ... & Gallagher, F. A. (2019). Quantifying normal human brain metabolism using hyperpolarized [1–13C] pyruvate and magnetic resonance imaging. Neuroimage, 189, 171-179.
2. Inglese, M., Park, S. J., Johnson, G., Babb, J. S., Miles, L., Jaggi, H., ... & Grossman, R. I. (2007). Deep gray matter perfusion in multiple sclerosis: dynamic susceptibility contrast perfusion magnetic resonance imaging at 3 T. Archives of Neurology, 64(2), 196-202.
3. Roelcke, U., Kappos, L., Lechner-Scott, J., Brunnschweiler, H., Huber, S., Ammann, W., ... & Leenders, K. L. (1997). Reduced glucose metabolism in the frontal cortex and basal ganglia of multiple sclerosis patients with fatigue: A 18F‐fluorodeoxyglucose positron emission tomography study. Neurology, 48(6), 1566-1571.
4. Tang, F., Lane, S., Korsak, A., Paton, J. F. R., Gourine, A. V., Kasparov, S., & Teschemacher, A. G. (2014). Lactate-mediated glia-neuronal signalling in the mammalian brain. Nature communications, 5(1), 1-14.
5. Pellerin, L., Pellegri, G., Bittar, P. G., Charnay, Y., Bouras, C., Martin, J. L., ... & Magistretti, P. J. (1998). Evidence supporting the existence of an activity-dependent astrocyte-neuron lactate shuttle. Developmental neuroscience, 20(4-5), 291-299.
6. Amorini, A. M., Nociti, V., Petzold, A., Gasperini, C., Quartuccio, E., Lazzarino, G., ... & Tavazzi, B. (2014). Serum lactate as a novel potential biomarker in multiple sclerosis. Biochimica et Biophysica Acta (BBA)-Molecular Basis of Disease, 1842(7), 1137-1143.7. Datta, S., & Chakrabarti, N. (2018).
7. Age related rise in lactate and its correlation with lactate dehydrogenase (LDH) status in post-mitochondrial fractions isolated from different regions of brain in mice. Neurochemistry International, 118, 23-33.
8. Atherton, H. J., Dodd, M. S., Heather, L. C., Schroeder, M. A., Griffin, J. L., Radda, G. K., ... & Tyler, D. J. (2011). Role of pyruvate dehydrogenase inhibition in the development of hypertrophy in the hyperthyroid rat heart: a combined magnetic resonance imaging and hyperpolarized magnetic resonance spectroscopy study. Circulation, 123(22), 2552-2561.
9. Bouzat, P., Sala, N., Suys, T., Zerlauth, J. B., Marques-Vidal, P., Feihl, F., ... & Oddo, M. (2014). Cerebral metabolic effects of exogenous lactate supplementation on the injured human brain. Intensive care medicine, 40(3), 412-421.
Figures