5329
SNR and Dose Considerations for Hyperpolarized 129Xe Magnetic Resonance Spectroscopy1Medical Physics Graduate Program, Duke University, Durham, NC, United States, 2Department of Biomedical Engineering, Duke University, Durham, NC, United States, 3Department of Radiology, Duke University, Durham, NC, United States
Synopsis
Keywords: Hyperpolarized MR (Gas), Spectroscopy
Hyperpolarized 129Xe MR spectroscopy is a powerful tool for evaluating gas exchange, blood oxygenation and hemodynamics. However, there is no established method for determining the HP 129Xe dose equivalent required to achieve scans of sufficient quality for analysis. Here, we establish a robust approach to calculate the 129Xe MRS SNR and assess its relationship to the 129Xe dose equivalent.Introduction
Hyperpolarized (HP) 129Xe MR spectroscopy provides a series of quantitative biomarkers for pulmonary gas exchange, blood oxygenation, and hemodynamics with sensitivity to disease progression and treatment response.1 However, there is no current standard for calculating 129Xe spectroscopic SNR, nor is there an established relationship to the 129Xe dose needed to achieve it. Here, we introduce a robust means of calculating 129Xe spectroscopic SNR and establish its correlation to the administered HP 129Xe dose.Methods
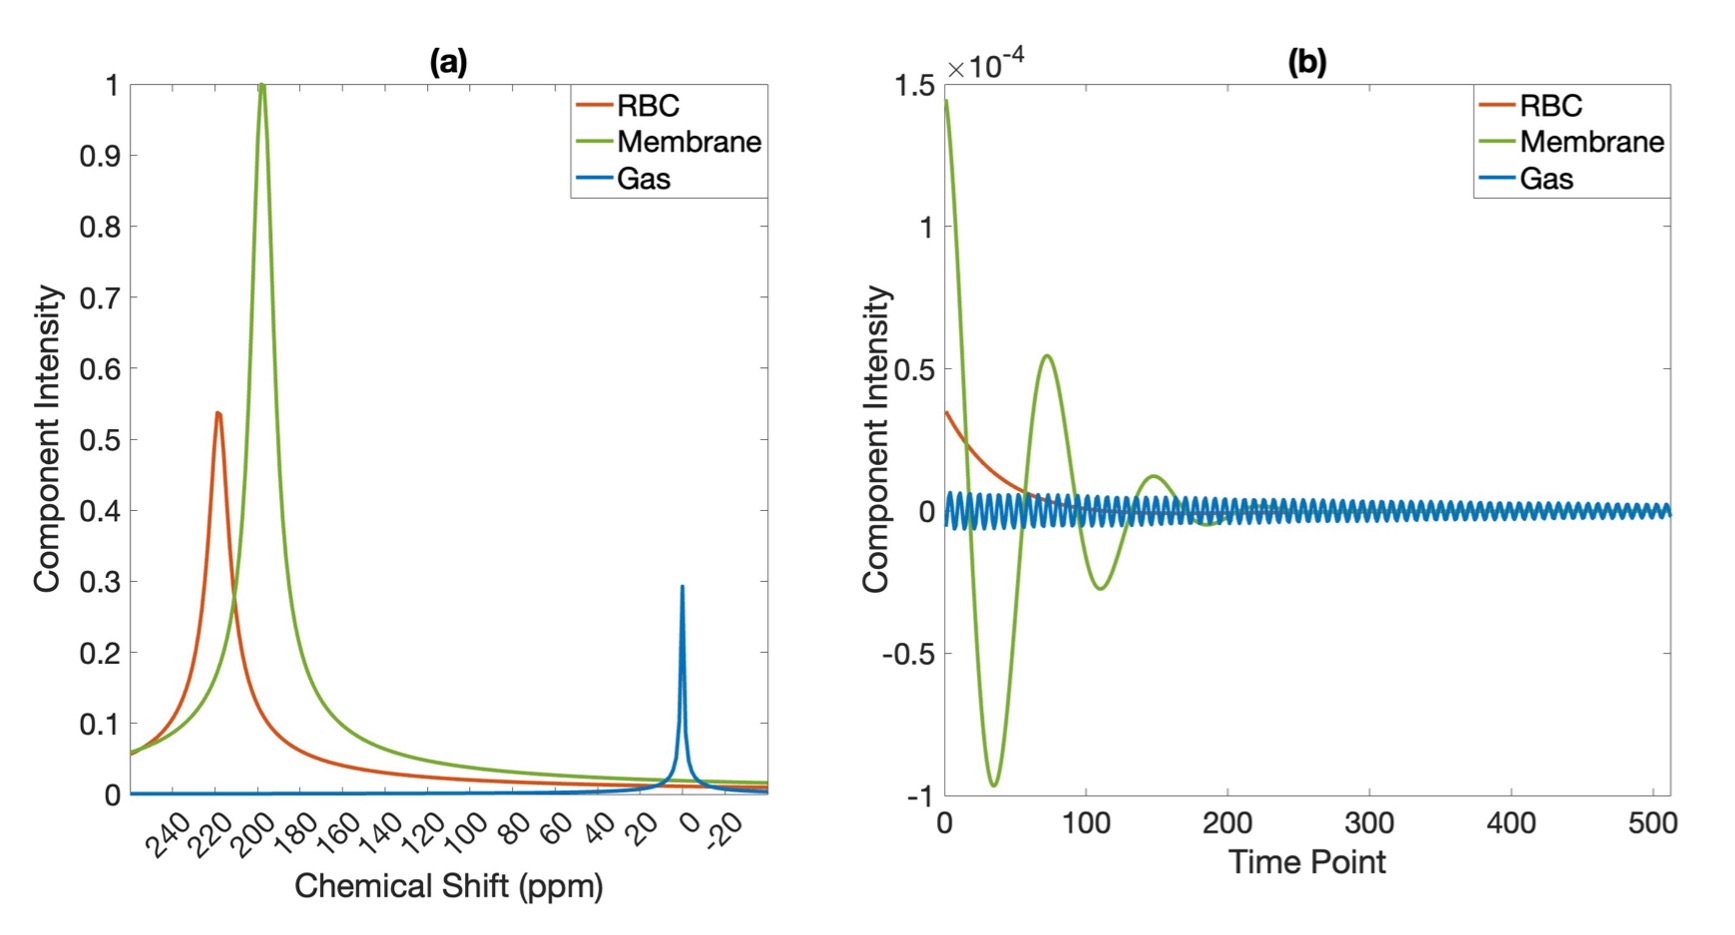
HP 129Xe MRS was performed on 85 subjects, including 21 healthy subjects and patients across different age, sex, and disease groups (33 IPF patients and 31 patients with other obstructive and restrictive lung diseases). Spectra (n=500) were acquired on a 3.0 T Siemens Prisma scanner using a quadrature 129Xe vest coil as per consortium recommendations2 with a 0.69 ms windowed sinc RF pulse, centered on the red blood cell (RBC) resonance with 20˚ flip, repetition time (TR) = 15 ms, echo time (TE) = 450 μs, dwell time = 19500 μs, 512 points. The SNR analysis focused on 1-sec of averaged data (67 FIDs) acquired 2 seconds into the breath-hold to ensure steady state magnetization.Spectra were fit in the time domain to a Voigt profile for the membrane signal and a Lorentzian for the RBC and gas signals 3. The membrane refers to the interstitial lung parenchymal tissue and blood plasma. The 129Xe spectral structure is shown in both spectral and time domains (Figure 1).
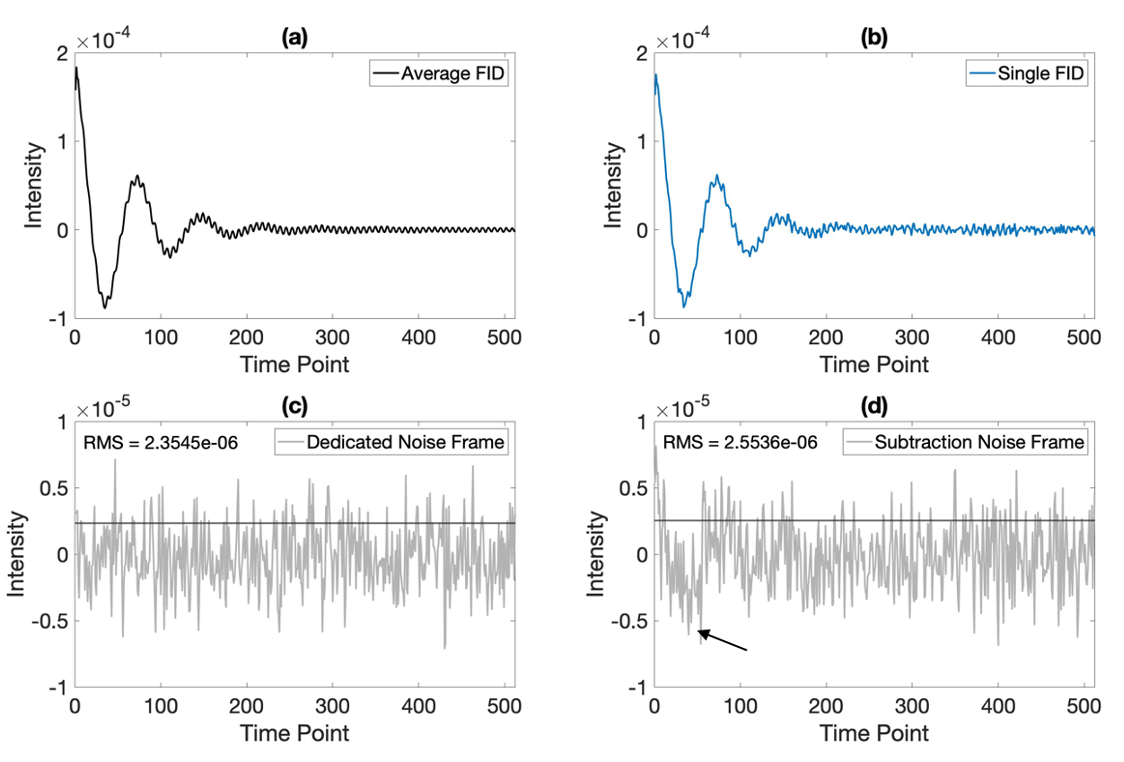
The spectral noise was calculated by two different methods (Figure 2). First, each acquisition included acquisition of a dedicated noise frame (NF), in which data was acquired without RF excitation. However, to accommodate data acquired without a dedicated noise frame, we also developed an estimated noise frame as follows4. First, the 67 views were averaged, then each individual view was subtracted from this average. These individual estimate noise frames (ENFi) were then averaged to calculate the estimated noise frame SNR. The estimated noise frames contained some subtraction artifacts during the early phase of sampling, likely caused by cardiogenic signal oscillations, and thus only the 2nd half was retained to estimate the noise.
$$\overline{FID}=\frac{1}{67}\sum_{i=1}^{67}FID_{i}\;\;\;\;\;\;\;\;\;\; (1)$$ $$ENF_{i}=\overline{FID}-FID_{i}\;\;\;\;\;\;\;\;\;\; (2)$$
$$SNR_{ENF}=\frac{1}{\sqrt{67}}\sum_{i=1}^{67}\frac{Amplitude\,Fit\, (\overline{FID})}{std\,dev\,{(ENF_{i})}}\;\;\;\;\;\;\;\;\;\; (3)$$
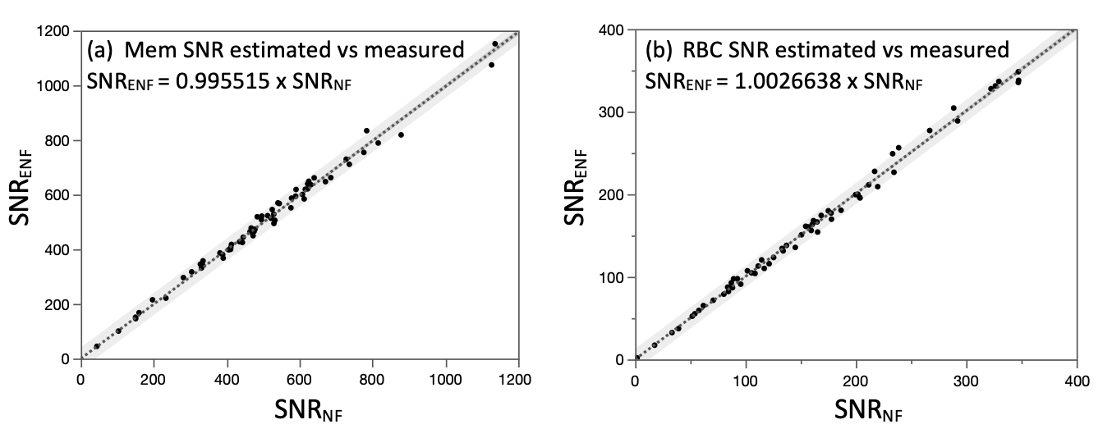
SNR for this 1-sec average was calculated for both the membrane and RBC resonances and correlations between the two approaches were calculated. Finally, SNRENF was correlated against the administered dose equivalent for each scan, defined as DE = f129 x P129 x VXe, where f129 is the isotopic fraction of 129Xe, P129 is the nuclear spin polarization of the 129Xe, and VXe is the xenon volume in ml 5. The administered DE ranged from 50.5 ml to 113.8 ml (mean 82.1±15.1 ml).
Results
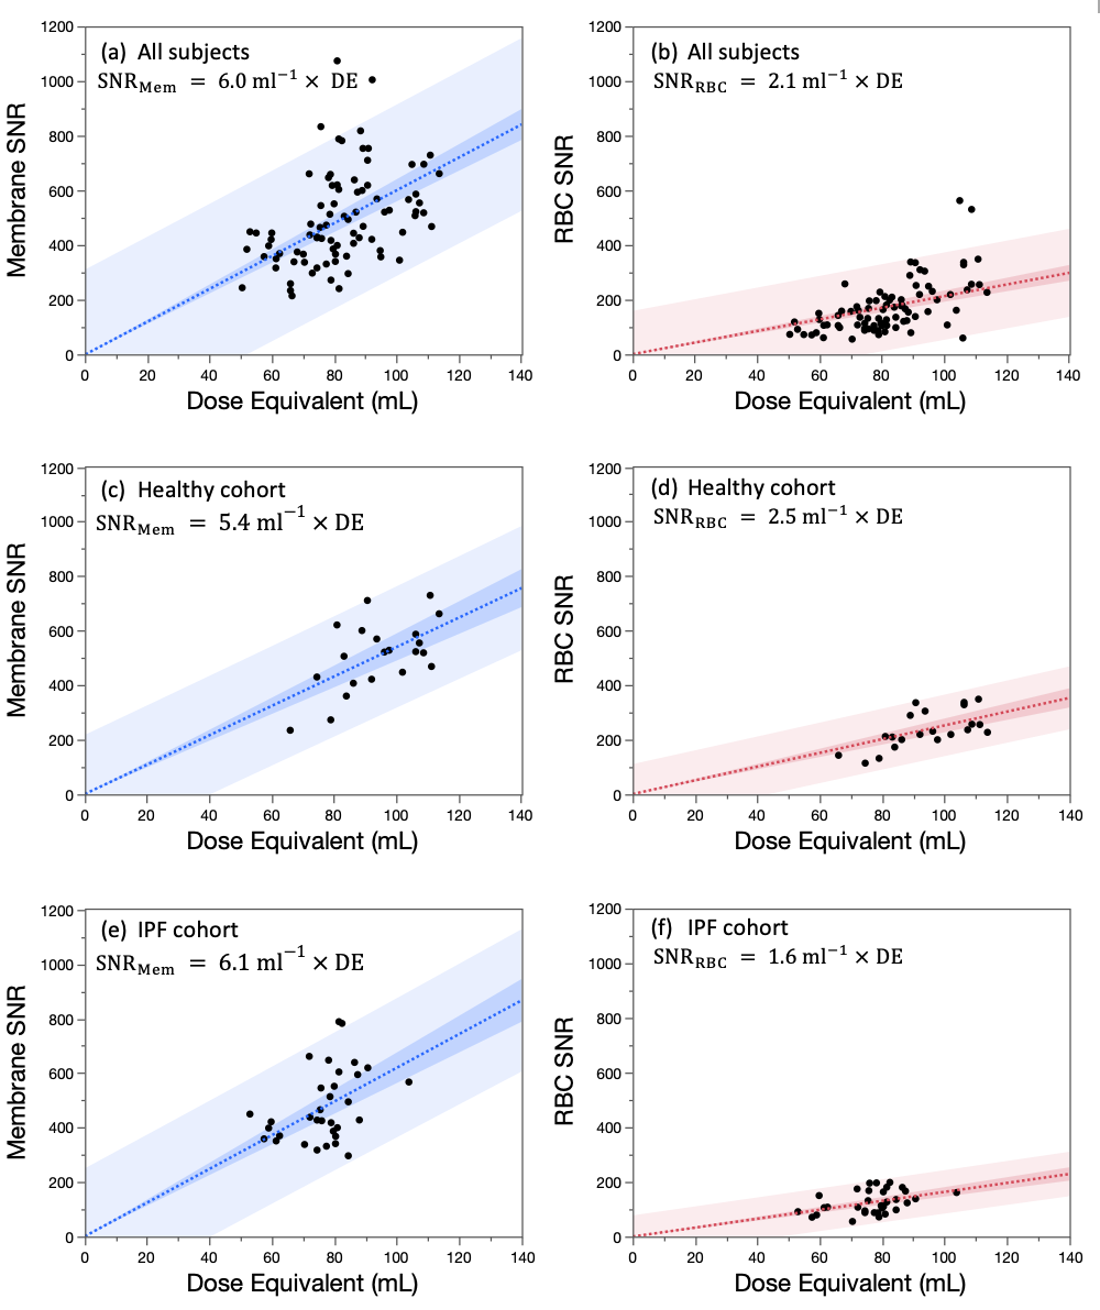
Figure 3 shows that the correlation of SNR calculated using the dedicated vs estimated noise frame is ~1. Figure 4 shows the relationship between SNRENF and DE for both resonances across the entire cohort and broken down by the healthy and IPF cohorts. Across the entire cohort, the relationships were.$$SNR_{Mem}={6.0}\, ml^{-1}\times{DE}$$
$$SNR_{RBC}={2.1}\, ml^{-1}\times{DE}$$
These results were similar to what was obtained in the healthy cohort, although in the IPF cohort, membrane SNR/DE was higher and that of the RBC signal was lower.
Discussion
This study provides a robust means of calculating SNR for 129Xe MRS and establishes its relationship to administered dose equivalent for the current standard acquisition. We demonstrated that SNR calculated using estimated noise is virtually identical to that obtained with a dedicated noise frame, thus simplifying the acquisition.We noted some differences in DE scaling when considering healthy volunteers vs. patients with IPF. Notably, for IPF patients RBC SNR is ~1.6 times lower than their healthy counterparts. This is not surprising considering the known gas exchange impairment in these patients and is consistent with differences in RBC/Membrane of ~ 0.46 for the healthy cohort vs ~ 0.26 in the IPF cohort in this study. This disparity implies for a given DE, less 129Xe reaches the RBC compartment in these patients. By contrast, the IPF patients exhibited high SNR/DE for the membrane compartment than the healthy subjects or the full patient cohort. This too is consistent with the known finding that an elevated membrane signal is characteristic of patients with IPF and interstitial pneumonias in general. However, we suggest that using the SNR scaling achieved across the entire patient cohort is likely sufficient for most studies.
These results can be used in practice to estimate the required DE for acceptable quantification of spectroscopic biomarkers. To that end, a recent reader study of 129Xe MRS dynamic and static spectroscopy readability conducted in our laboratory sought to determine the technical requirements to achieve a reader score >3 (on a 5-point Likert scale) for static spectroscopy metrics (RBC/M and RBC shift) as well as dynamic (RBC amplitude oscillations). Studies with a rating of >3 for static spectroscopy had an RBC SNR of 50.6, and for dynamic spectra an SNR of 105.4 was required. Using this information suggests that a DE of 25.3 ± 1.0 ml is required for robust static spectra and 50.2 ± 4.7 ml is required for dynamic spectra. This information may prove useful in future multi-center trials that incorporate 129Xe MRI/MRS.
Acknowledgements
No acknowledgement found.References
1. Marshall, H., Stewart, N. J., Chan, H. F., Rao, M., Norquay, G., & Wild, J. M. (2021). In vivo methods and applications of xenon-129 magnetic resonance. In Progress in Nuclear Magnetic Resonance Spectroscopy (Vol. 122). https://doi.org/10.1016/j.pnmrs.2020.11.002
2. Niedbalski, P. J., Hall, C. S., Castro, M., Eddy, R. L., Rayment, J. H., Svenningsen, S., Parraga, G., Zanette, B., Santyr, G. E., Thomen, R. P., Stewart, N. J., Collier, G. J., Chan, H. F., Wild, J. M., Fain, S. B., Miller, G. W., Mata, J. F., Mugler, J. P., Driehuys, B., … Woods, J. C. (2021). Protocols for multi-site trials using hyperpolarized 129Xe MRI for imaging of ventilation, alveolar-airspace size, and gas exchange: A position paper from the 129Xe MRI clinical trials consortium. Magnetic Resonance in Medicine, 86(6). https://doi.org/10.1002/mrm.28985
3. Bier, E. A., Robertson, S. H., Schrank, G. M., Rackley, C., Mammarappallil, J. G., Rajagopal, S., McAdams, H. P., & Driehuys, B. (2019). A protocol for quantifying cardiogenic oscillations in dynamic 129 Xe gas exchange spectroscopy: The effects of idiopathic pulmonary fibrosis. NMR in Biomedicine, 32(1). https://doi.org/10.1002/nbm.4029
4. Nalcioglu, O., & Cho, Z. H. (1984). Limits to signal-to-noise improvement by FID averaging in NMR imaging. Physics in Medicine and Biology, 29(8). https://doi.org/10.1088/0031-9155/29/8/005
5. He, M., Robertson, S. H., Kaushik, S. S., Freeman, M. S., Virgincar, R. S., Davies, J., Stiles, J., Foster, W. M., McAdams, H. P., & Driehuys, B. (2015). Dose and pulse sequence considerations for hyperpolarized 129Xe ventilation MRI. Magnetic Resonance Imaging, 33(7). https://doi.org/10.1016/j.mri.2015.04.005
Figures