5328
Enhancement of Pulse Simulation in Quantifying Procedure of Very Slow CSF Flow Measurement with Shunt-FENSI1Department of Bioengineering, University of Illinois at Urbana-Champaign, Champaign, IL, United States, 2Beckman Institute, University of Illinois at Urbana-Champaign, Urbana, IL, United States, 3Carle Illinois College of Medicine, University of Illinois at Urbana-Champaign, Urbana, IL, United States, 4Department of Neurosurgery, Carle Foundation Hospital, Urbana, IL, United States, 5Department of Radiology, Carle Foundation Hospital, Urbana, IL, United States
Synopsis
Keywords: Neurofluids, Brain, Flow, Hydrocephalus, CSF, Quantitative
Ventriculoperitoneal shunts drain excessive cerebrospinal fluid (CSF) for hydrocephalus patients, but shunts placed shortly after birth 50% fail within 2 years. Since rapid MRI is becoming the standard for imaging possible shunt malfunction, an MRI technique that assesses shunt flow at the same imaging setting, would be beneficial. Previously, the non-invasive quantitative method, Shunt Flow Enhancement of Signal Intensity (Shunt-FENSI), was proposed for diagnosing possible shunt failure. An improvement in its flow data simulation and quantification is included, more accurately reflecting the RF pulse application in the pulse sequence. Improvements are demonstrated on phantom, extraventricular drain (EVD), and shunt patients.Introduction
Almost half of the ventriculoperitoneal (VP) shunts for cerebrospinal fluid (CSF) fail within two years for pediatric hydrocephalus patients, caused by obstruction or infection1-3. Flow Enhancement of Signal Intensity for Shunt (Shunt-FENSI) was introduced to non-invasively detect these problems. We now enhance the simulation to include the consideration of the pulse pairs of Shunt-FENSI, where we simulate the longitudinal and transversal components of spin incrementally, which brings our simulated signals closer to the phantom test signals. We also developed a criterion with image registration to localize the flow information on our mapping more precisely. We apply the change to multiple extraventricular drain (EVD) and shunt patient scans to demonstrate the improvements.Methods
In Shunt-FENSI tagging, pairs of tag pulses are used to repeatedly saturate a thin plane in the center of a slice to build up the tag from the slow-moving flow. The flip angles of pulse pairs in the tag module are 45°/45° to effectively saturate, and for control, a pair of 45°/-45° pulses is used. The Shunt-FENSI simulation is used to quantify the measured signal into the predicted flow.Previously, the simulation used a 90° effective pulse to simplify the pulse pair4, but flow during control RF pulse pair application can cause some tagging too, leading to an underestimation of flows. The new simulation now brings in the actual effects of 45° pulse pairs. We now track the effect of the transversal and longitudinal condition of the spin.
Flow constantly moves into the imaging slice in each new time step of the simulation, and pushes part of the CSF out from the tagging plane. The actual time points of the two pulses from the pulse pair are used in the simulation. For each time step of the simulation, we apply the RF pulses, keeping track of the transverse magnetization between the 2 RF pulse pairs, and displace the flowing CSF. At the end of a pulse pair, a spoiling gradient spoils transverse magnetization, but longitudinal tagging is kept, with T1 recovery included in the simulation. After the tagging module, the simulated signal is determined from the sum of the longitudinal magnetization along the tube.
By running this simulation for a series of flow rates between 0-0.4 ml/min, a series of simulated signals is generated. FENSI signal is quantified by taking the difference between control and tag signals, ΔM, in the data processing5. A scaling factor was calibrated for the FENSI ΔM signal by curve-fitting between simulation and phantom data across a range of flow rates between 0-0.4 ml/min.
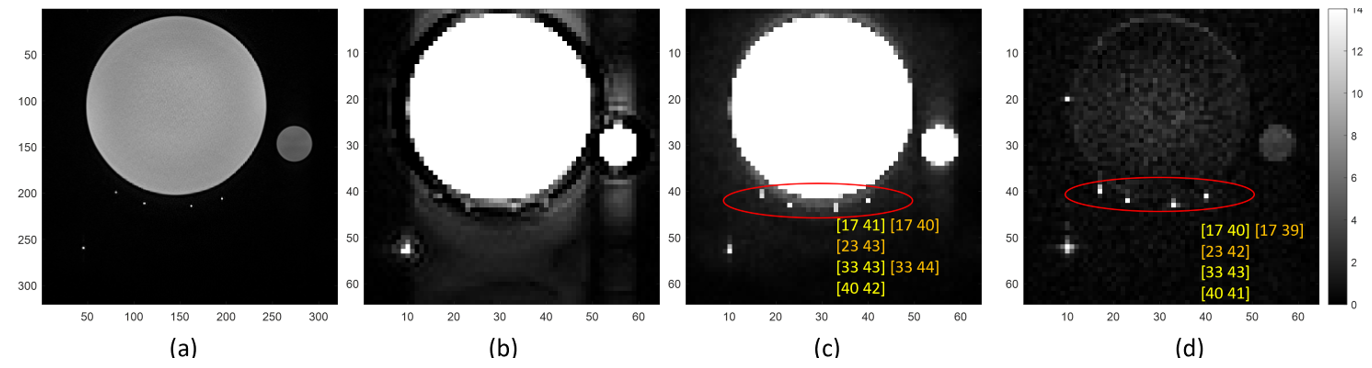
A high-resolution TSE image (Fig. 1a) was acquired in order to see and localize the tubing. This was registered to a FENSI-matched resolution TSE image (Fig. 1b) in FENSI space using flirt in FSL6,7. This results in accurate localization of the shunt tubing (Fig. 1c) and is transferred to the FENSI images (Fig. 1d). A 3*3-pixel grid around this pixel is summed to account for distortion and partial voluming. We set a threshold for the nine signals included in the summation to avoid including irrelevant signals.
Results
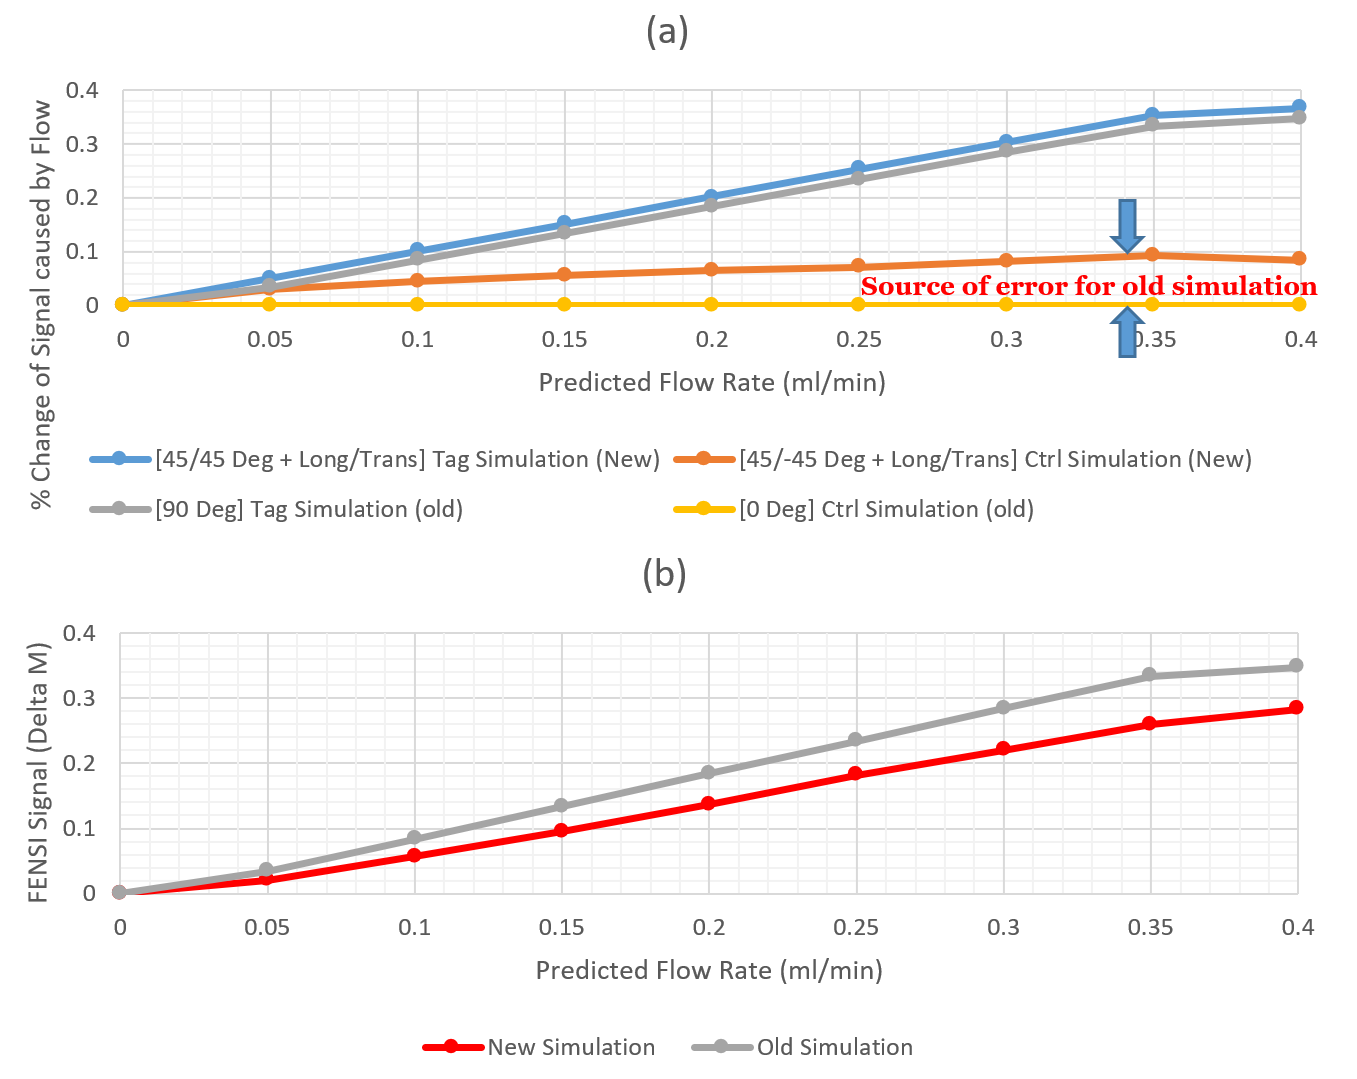
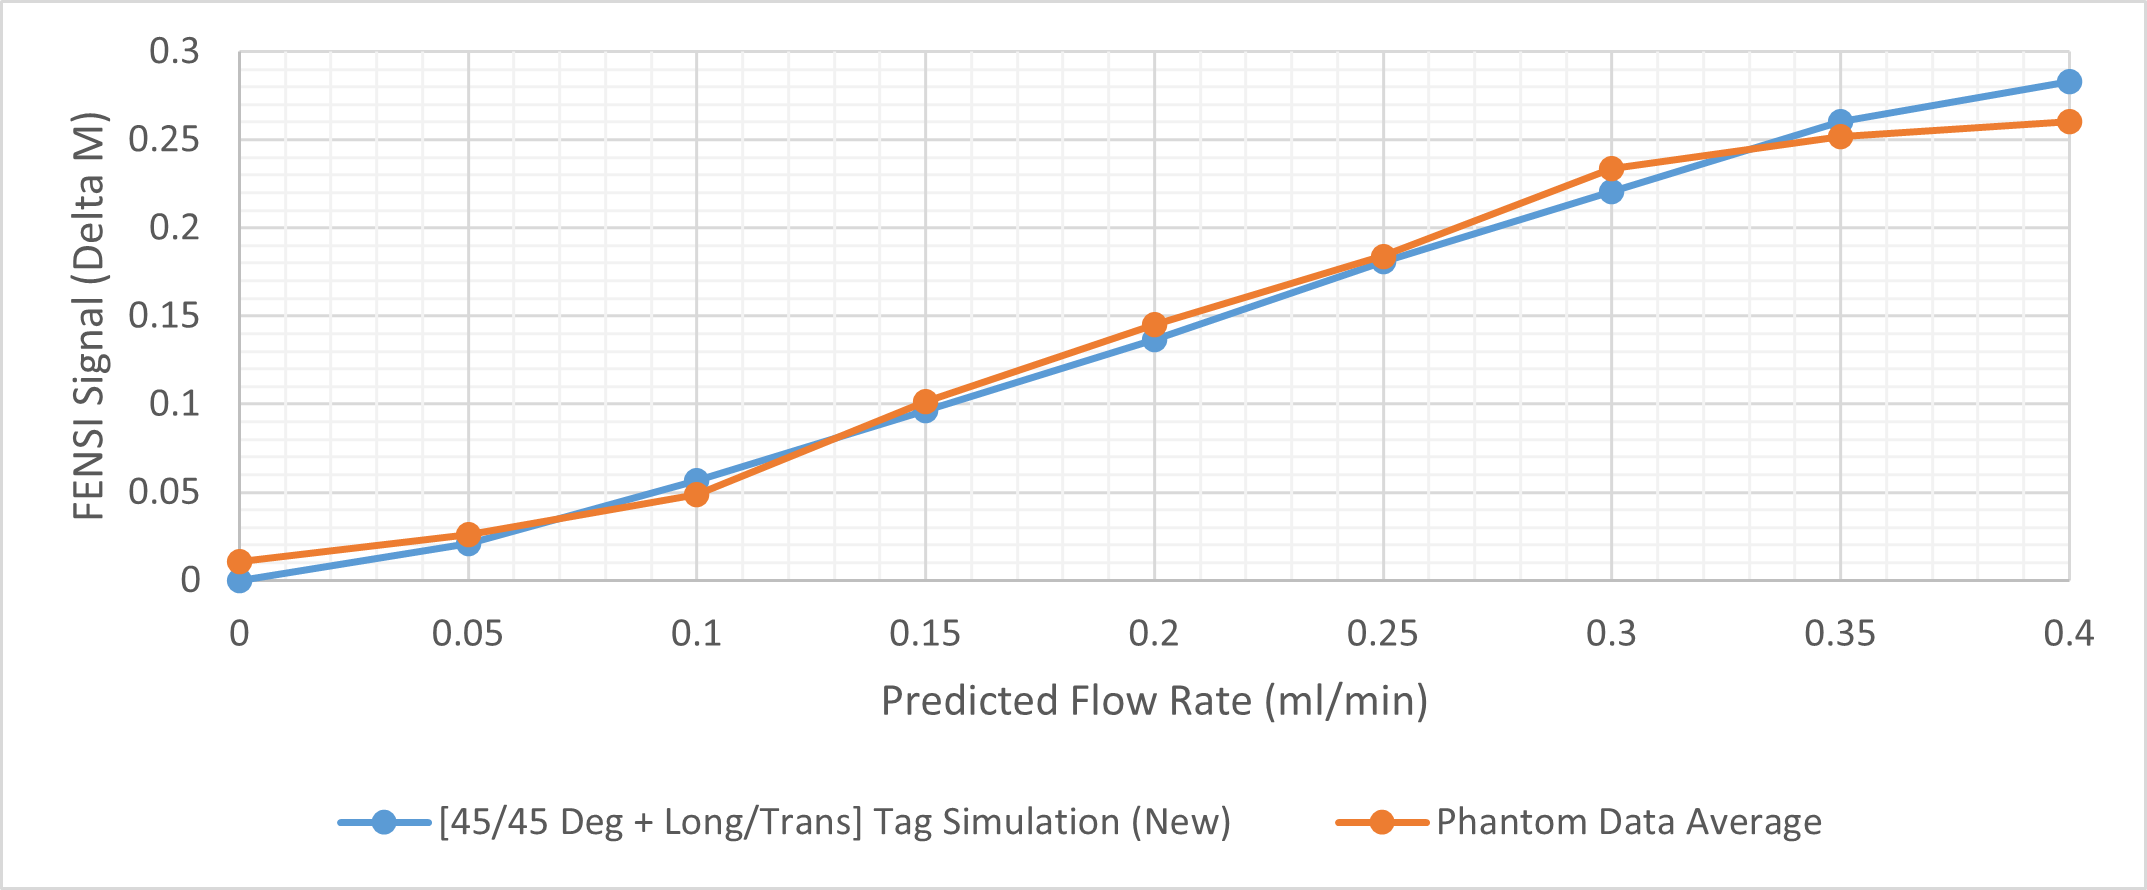
Fig. 2 shows the comparison between new and old simulations. Fig. 2a displays the signal results from the tag and control simulations. The difference between the control simulations is significant. Fig. 2b demonstrates the subtraction results between the tag and control versions for the new and old simulation methods, with a clear difference in the slopes.Using curve-fitting, we found a scaling factor of 7.4 of the measured FENSI signal towards the new simulation. Fig. 3 shows the comparison between the phantom data and the new simulation with the new scaling factor applied.
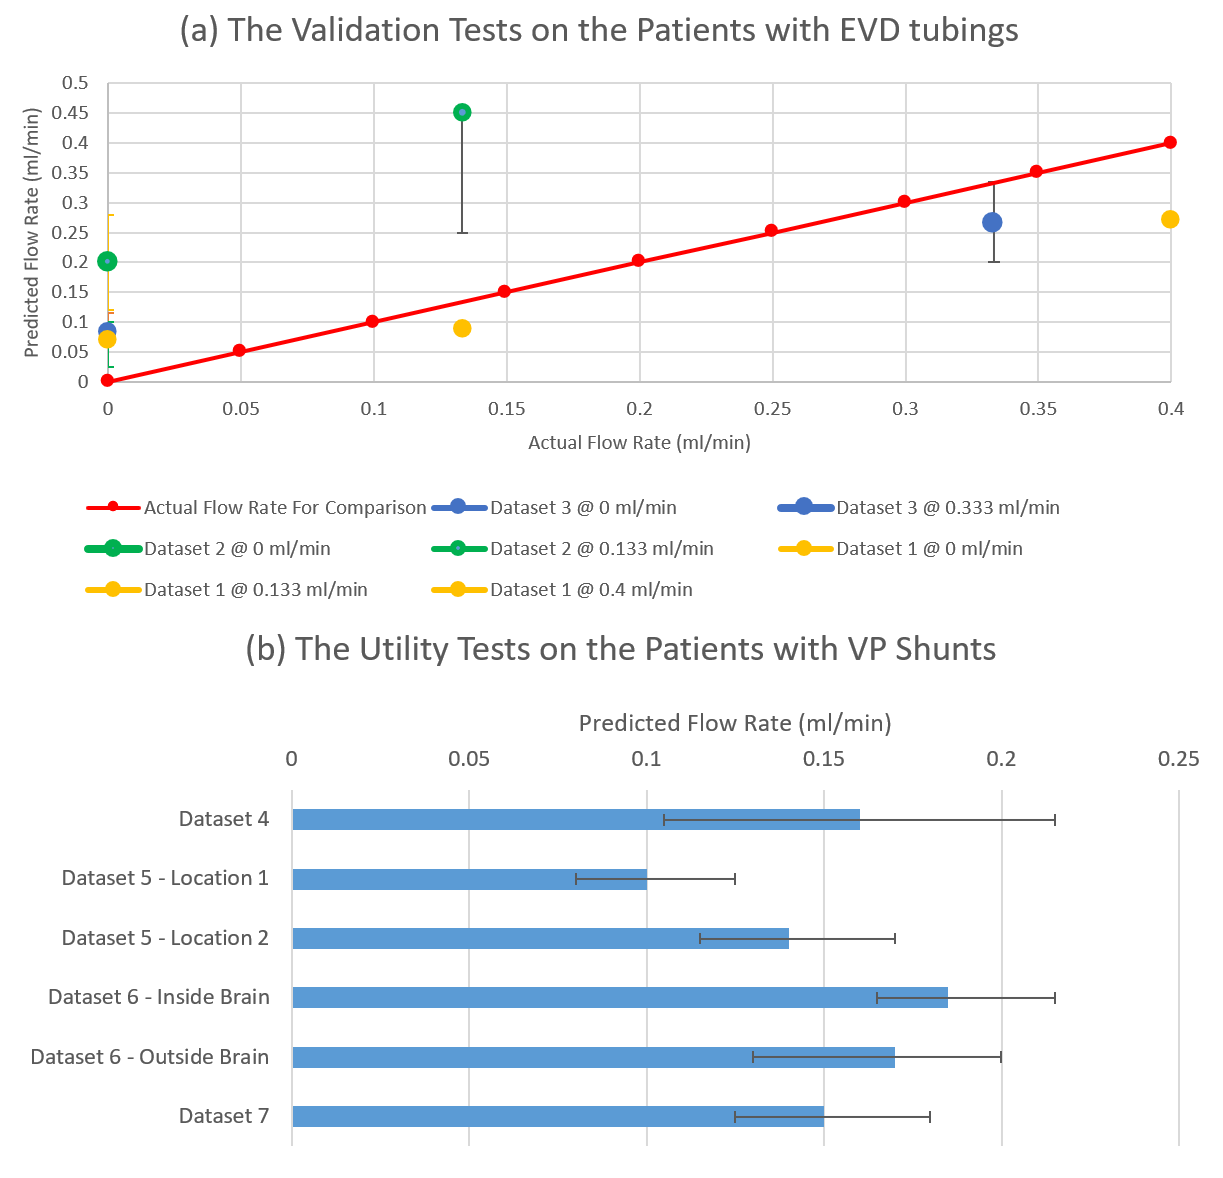
Fig. 4 demonstrates the in vivo experiment results. Fig. 4a shows the results in the EVD patients, whose actual flow rates could be recorded from drainage bags. The actual flow rate is compared with the predicted one, converted from the measured FENSI signals by the simulation curve. Fig. 4b displays the utility test results in the VP shunt patients.
Discussion
Overall, our updated simulation improved the accuracy of fitting the FENSI signal across our flow rates tested. The registration fixed our tubing shifting and the possible tubing location on the pixel boundary, and the localization criterion captures signal information better. Generally, the EVD data show promising results. Dataset 2 (Green curve) in Fig. 4(a) does not agree with the actual flow rate well. It could be caused by the susceptibility to human motion, which confused the normalization process and led to a larger scale.According to Fig. 3, there is a minor change in the tag signal and a significant change in the control signal for the updated simulation. This implies that lumping the paired RF pulses into a 90°/0° effective pulse causes significant errors in the expected FENSI signal. Having a more accurate simulation will enable us to better design tagging parameters to provide higher sensitivity to expected flow rates and provide a more accurate quantification.
Acknowledgements
Research reported in this publication was supported by the Eunice Kennedy Shriver National Institute of Child Health & Human Development of the National Institutes of Health under Award Number R21HD095314. The content is solely the responsibility of the authors and does not necessarily represent the official views of the National Institutes of Health.References
1. Browd SR, Gottfried ON, Ragel BT, Kestle JR. Failure of cerebrospinal fluid shunts: part II: overdrainage, loculation, and abdominal complications. Pediatr Neurol. 2006;34(3):171-6. doi: 10.1016/j.pediatrneurol.2005.05.021. PubMed PMID: 16504785.
2. Kestle J, Drake J, Milner R, Sainte-Rose C, Cinalli G, Boop F, Piatt J, Haines S, Schiff S, Cochrane D, Steinbok P, MacNeil N. Long-term follow-up data from the Shunt Design Trial. Pediatr Neurosurg. 2000;33(5):230-6. doi: 55960. PubMed PMID: 11155058. 3. Pollack IF, Albright AL, Adelson PD. A randomized, controlled study of a programmable shunt valve versus a conventional valve for patients with hydrocephalus. Hakim-Medos Investigator Group. Neurosurgery. 1999;45(6):1399-408; discussion 408-11. PubMed PMID: 10598708.
4. Aw NW-Y. Cerebrospinal fluid flow quantification in the brain using magnetic resonance imaging. (Master's Thesis, University of Illinois, Urbana, IL, United States). Retrieved from https://www.ideals.illinois.edu/items/1121242019.
5. Ouyang C, Sutton BP. Localized blood flow imaging using quantitative flow-enhanced signal intensity. Magn Reson Med. 2012;67(3):660-8. Epub 2011/06/30. doi: 10.1002/mrm.23046. PubMed PMID: 21713979; PMCID: PMC3184373.
6. Jenkinson M, Bannister P, Brady M, Smith S. Improved optimization for the robust and accurate linear registration and motion correction of brain images. Neuroimage. 2002;17(2):825-41. Epub 2002/10/16. doi: 10.1016/s1053-8119(02)91132-8. PubMed PMID: 12377157.
7. Jenkinson M, Smith S. A global optimisation method for robust affine registration of brain images. Med Image Anal. 2001;5(2):143-56. Epub 2001/08/23. doi: 10.1016/s1361-8415(01)00036-6. PubMed PMID: 11516708.
Figures