5327
Increased T1w MRI-based brain age in chronic migraine patients1Image Processing Laboratory, Universidad de Valladolid, Valladolid, Spain, 2Hospital Clínico Universitario de Valladolid, Valladolid, Spain, 3CUBRIC, Cardiff University, Cardiff, United Kingdom
Synopsis
Keywords: Machine Learning/Artificial Intelligence, Aging, Migraine
Brain-age is an emerging neuroimaging biomarker that represents the aging status of the brain using machine learning techniques from MRI data. It has been successfully applied to the study of different neurological and psychiatric conditions. We hypothesize that patients with migraine may show an increased brain age gap (difference between the age estimated from the MRI data and the chronological age). After building a brain age model from 2,781 healthy subjects, we tested this hypothesis on a dataset with 210 healthy controls and migraine patients. Results showed an increased brain age in chronic migraine patients with respect to healthy controls.Purpose
Migraine is one of the most common neurological disorders, with a higher prevalence among women, and causes a huge societal and economic burden1. Chronic migraine (CM) patients suffer headaches for no less than 15 days per month for more than three months, with at least eight days of having migrainous symptoms. Patients with episodic migraine (EM), on the other hand, suffer headaches for less than 15 days per month2. Different studies have shown differences in the brain of migraine patients with respect to those of healthy controls (HC) in terms of morphological, connectivity, and metabolic features3,4,5. However, the pathophysiology of migraine is still unclear. To contribute to its understanding, the Brain Age framework has emerged as a neuroimaging technique that predicts the individual's age ("brain age") by employing MRI data. To determine the Brain Age Gap Estimation (BrainAGE)6, the predicted and real chronological ages are compared, representing a positive value accelerated brain aging, as previously reported in several disorders such as Alzheimer’s disease, multiple sclerosis, or diabetes type II7,8,9. The aim of this study is to develop a BrainAGE model and estimate the aging status of the brain in patients with migraine.Methods
Subjects and acquisition: A total of 2781 T1w MRI images (Dataset 1) from different datasets were employed to build the Brain Age model. This model was afterward applied to Dataset 2, composed of healthy controls (HC, n=70), EM (n=78), and CM patients (n=62), in order to test whether there are differences among these groups in terms of BrainAGE (table 1). These groups were first tested for significant differences in sex proportions and age distribution.Brain age model: FastSurfer10, a deep learning whole brain segmentation method trained on the Desikan-Killiany atlas11, was employed to obtain parcellations of the brain MRI images. Next, a total of 624 morphological features were calculated over the segmented regions of interest (ROIs) encompassing area, volume, curvature, and thickness of cortical and subcortical brain ROIs.
Dataset 1 was randomly divided in an 8:1:1 proportion (training, validation, and test) and a 10-fold cross-validation training scheme was performed. Feature selection was done on each fold, defining three sets of 20, 30, and 40 features each. Feature selection was carried out in two steps. First, a filter was applied to select the first best decile features defined by the mutual information between features and age in the training set. Next, the final feature sets are determined by applying a forward feature selection algorithm using Gaussian mixture models to maximize the mutual information between a subset of features and age12. Support vector machine (SVR), random forest (RF), and a multilayer perceptron (MLP) were evaluated as regressors. Figure 1 illustrates the pipeline followed. As a result, a total of 90 models were trained by combining three regressors with different feature sets of 20, 30, and 40 features for each fold. Predictions were obtained for the validation and test set for each fold. Validation results were used to select the brain age model to be applied to Dataset 2 (table 2), while test results were exclusively employed to report the accuracy of the brain age model on Dataset 1. An ensemble formed with the average result of the trained model from each fold was used to obtain the final predictions. Finally, the brain age gap was calculated as the difference between the predicted age and the chronological age of each individual.
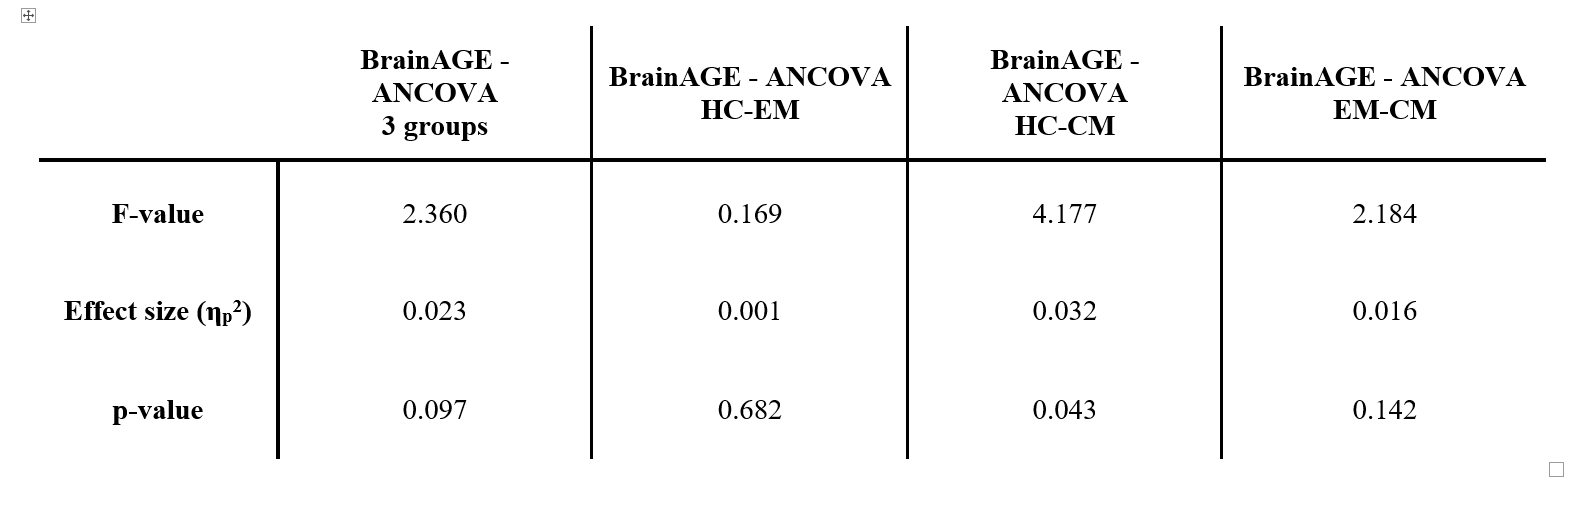
Statistical analysis: An ANCOVA test of the BrainAGE values was performed, adding age, estimated total intracranial volume (eTIV), and sex as covariates in order to avoid possible spurious associations13,14. This analysis was conducted between HC, EM, and CM, as well as between each pair of groups (table 3).
Results
The MLP model, using 40 features, obtained the best results in the validation set, and was therefore selected to study the BrainAGE of the groups. This model obtained a mean absolute error (MAE) and Pearson correlation coefficient (r) of 5.38 and 0.83 respectively, on Dataset 1. This same model obtained a MAE and Pearson correlation of 6.43 years and 0.71, respectively, on the HCs of Dataset 2. With regard to the comparison between groups, a statistically significant increased BrainAGE was found in CM patients compared to HC (2.28 years vs -0.27 years, Figure 2). No other significant differences were found.Discussion
We found an increased BrainAGE in CM compared to healthy subjects. Disorders like Alzheimer's disease6 or multiple esclerosis7 exhibit a wider gap, suggesting CM's effect on brain age may be milder. In contrast, no significant differences were found between EM and HC. Although larger datasets might be needed to confirm these findings, they may support the distinct nature of EM and CM, and the effect of CM on the brain’s aging trajectories. Future work will include the refinement of the proposed brain age model and the incorporation of diffusion MRI, which is more sensitive to white matter alterations that are known to be relevant in migraine.Conclusion
We employed the brain age framework to study the migrainous brain and found an increased BrainAGE in CM compared to healthy subjects but no differences for EM patients.Acknowledgements
Acknowledgments: This work was supported by Ministerio de Ciencia e Innovación of Spain with research grants PID2021-124407NB-I00, TED2021-130758B-I00 and PRE2019-089176; and the European Union (NextGenerationEU).References
1. Stovner, Lars Jacob, et al. "The global prevalence of headache: an update, with analysis of the influences of methodological factors on prevalence estimates." The journal of headache and pain 23.1 (2022): 1-17.
2. Headache Classification Committee of the International Headache Society. "The International Classification of Headache Disorders, 3rd edition." Cephalalgia 38 (2018): 1-211.
3. Planchuelo-Gómez, Álvaro, et al. "Gray matter structural alterations in chronic and episodic migraine: a morphometric magnetic resonance imaging study." Pain Medicine 21.11 (2020): 2997-3011.
4. Lisicki, Marco, et al. "Age related metabolic modifications in the migraine brain." Cephalalgia 39.8 (2019): 978-987.
5. Planchuelo-Gómez, Álvaro, et al. "Structural connectivity alterations in chronic and episodic migraine: A diffusion magnetic resonance imaging connectomics study." Cephalalgia 40.4 (2020): 367-383.
6. Franke, Katja, and Christian Gaser. "Ten years of BrainAGE as a neuroimaging biomarker of brain aging: What insights have we gained?." Frontiers in neurology (2019): 789.
7. Lee, Jeyeon, et al. "Deep learning-based brain age prediction in normal aging and dementia." Nature Aging 2.5 (2022): 412-424.
8. Cole, James H., et al. "Longitudinal assessment of multiple sclerosis with the brain‐age paradigm." Annals of neurology 88.1 (2020): 93-105.
9. Franke, Katja, et al. "Advanced BrainAGE in older adults with type 2 diabetes mellitus." Frontiers in aging neuroscience 5 (2013): 90.
10. Henschel, Leonie, et al. "Fastsurfer-a fast and accurate deep learning based neuroimaging pipeline." NeuroImage 219 (2020): 117012.
11. Klein, Arno, and Jason Tourville. "101 labeled brain images and a consistent human cortical labeling protocol." Frontiers in neuroscience 6 (2012): 171.
12. Maia Polo, Felipe, and Renato Vicente. "Effective sample size, dimensionality, and generalization in covariate shift adaptation." Neural Computing and Applications (2022): 1-13.
13. Butler, Ellyn R., et al. Pitfalls in brain age analyses. Vol. 42. No. 13. Hoboken, USA: John Wiley & Sons, Inc., 2021.
14. de Lange, Ann‐Marie G., et al. "Mind the gap: Performance metric evaluation in brain‐age prediction." Human Brain Mapping (2022).
Figures