5326
Quantitative susceptibility mapping of hippocampal iron relates to pattern separation and completion in older adults at risk for Alzheimer's1Montreal Neurological Institute, McGill University, Montreal, QC, Canada, 2PERFORM Centre, Concordia University, Montreal, QC, Canada, 3StoP-AD Centre, Douglas Mental Health Institute Research Centre, Montreal, QC, Canada, 4McGill University, Montreal, QC, Canada, 5McGill Centre for Integrative Neuroscience, McGill University, Montreal, QC, Canada, 6McConnell Brain Imaging Center, McGill University, Montreal, QC, Canada, 7Department of Psychology and Institute of Gerontology, Wayne State University, Detroit, MI, United States, 8Physics Department, Concordia University, Montreal, QC, Canada, 9Department of Psychology, York University, Toronto, ON, Canada, 10Department of Neurology and Neurosurgery, Montréal Neurological Institute, Montreal, QC, Canada, 11Douglas Mental Health University Institute, Montreal, QC, Canada, 12Departments of Psychiatry and Psychology, McGill University, Montreal, QC, Canada
Synopsis
Keywords: Alzheimer's Disease, Quantitative Susceptibility mapping, Human Memory
Quantitative susceptibility mapping (QSM) was used to evaluate hippocampal iron in a cohort of healthy older individuals at elevated risk for Alzheimer’s disease (AD), and related to pattern separation and pattern completion memory performance. Our results demonstrated that elevated brain iron content in the hippocampus is strongly associated with lower performance on behavioral tests specific to memory function, ie lower pattern separation scores and higher pattern completion scores. Our findings suggest that hippocampal iron deposition may be a pathological mechanism resulting in poorer mnemonic discrimination in later lifeIntroduction
Quantitative susceptibility mapping (QSM) is a quantitative MRI approach used to estimate magnetic susceptibility from brain iron deposition. Brain iron deposition has been observed in patients with Alzheimer’s disease (AD)[1]. Recent studies demonstrated that higher hippocampal iron correlated with lower episodic memory performance in old adults with amyloid pathology[2]. Clinical measures of episodic memory may not be sensitive to presymptomatic changes in healthy older adults at risk for AD. The Mnemonic Similarity Task (MST) [3] has been developed to test high fidelity episodic memory but dissociating central functions of the hippocampus, including pattern separation and completion. Pattern separation refers to the transformation of similar information into orthogonal, non-overlapping, representations, a process attributed to the dentate gyrus (DG)[4]. Pattern completion retrieves memory from partial or degraded representations by filling in missing information[5], and is likely mediated by hippocampal subfield CA1[6]. In this study, we evaluated hippocampal iron using QSM in a cohort of healthy older individuals at elevated risk for AD, and related iron content to pattern separation and completion.Methods
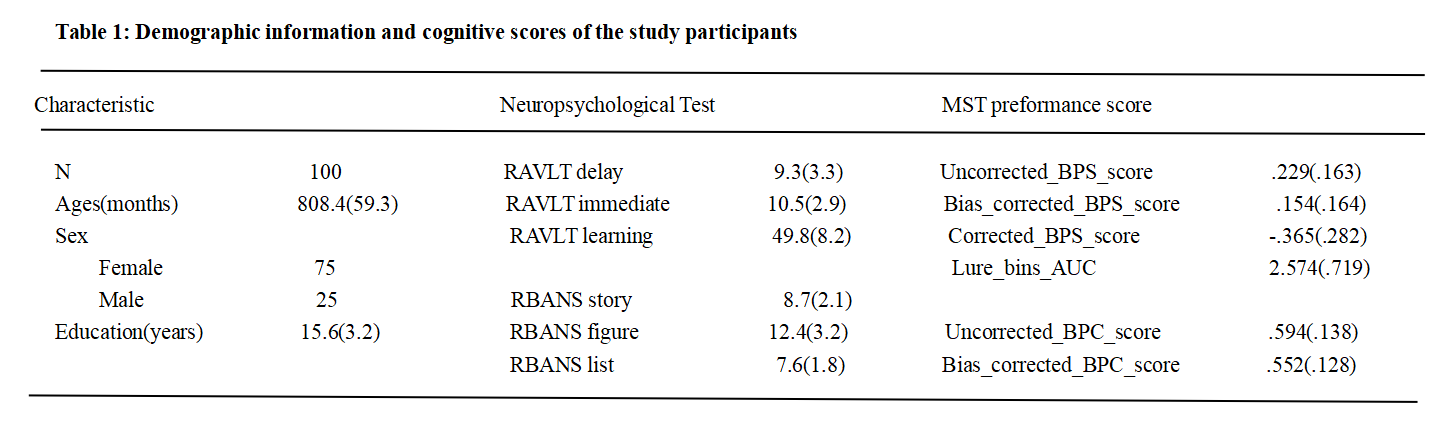
Participants and cognitive assessment: 100 cognitively normal older adults at familial risk for AD from the PREVENT-AD cohort (mean age, 670.5y, 75 women; 25 men) underwent MRI scanning and a battery of neuropsychological tests (e.g. RAVLT; RBANS) including the MST to assess pattern separation and pattern completion ( see Table 1).Data acquisition: MRI scans were conducted on a Siemens Prisma 3T scanner with a 32-channel head coil array. QSM images were acquired from a 3D gradient-recalled echo sequence with single-echo(TE=7.29ms; TR=20ms; Voxel size=0.8 x 0.8 x1.0 mm3; scan time=5.31min). T1-weighted images were acquired with a 3D magnetization-prepared rapid gradient echo (MP-RAGE, (TR=2300 ms; TE=2.96ms; voxel size=1.0 x 1.0 x 1.2 mm3 ; scan time=5.3min ), and T2-weighted images (TR=2500.0ms; TE=198ms; Voxel size=0.6 x 0.6 x 0.6 mm3; scan time=7.35min).
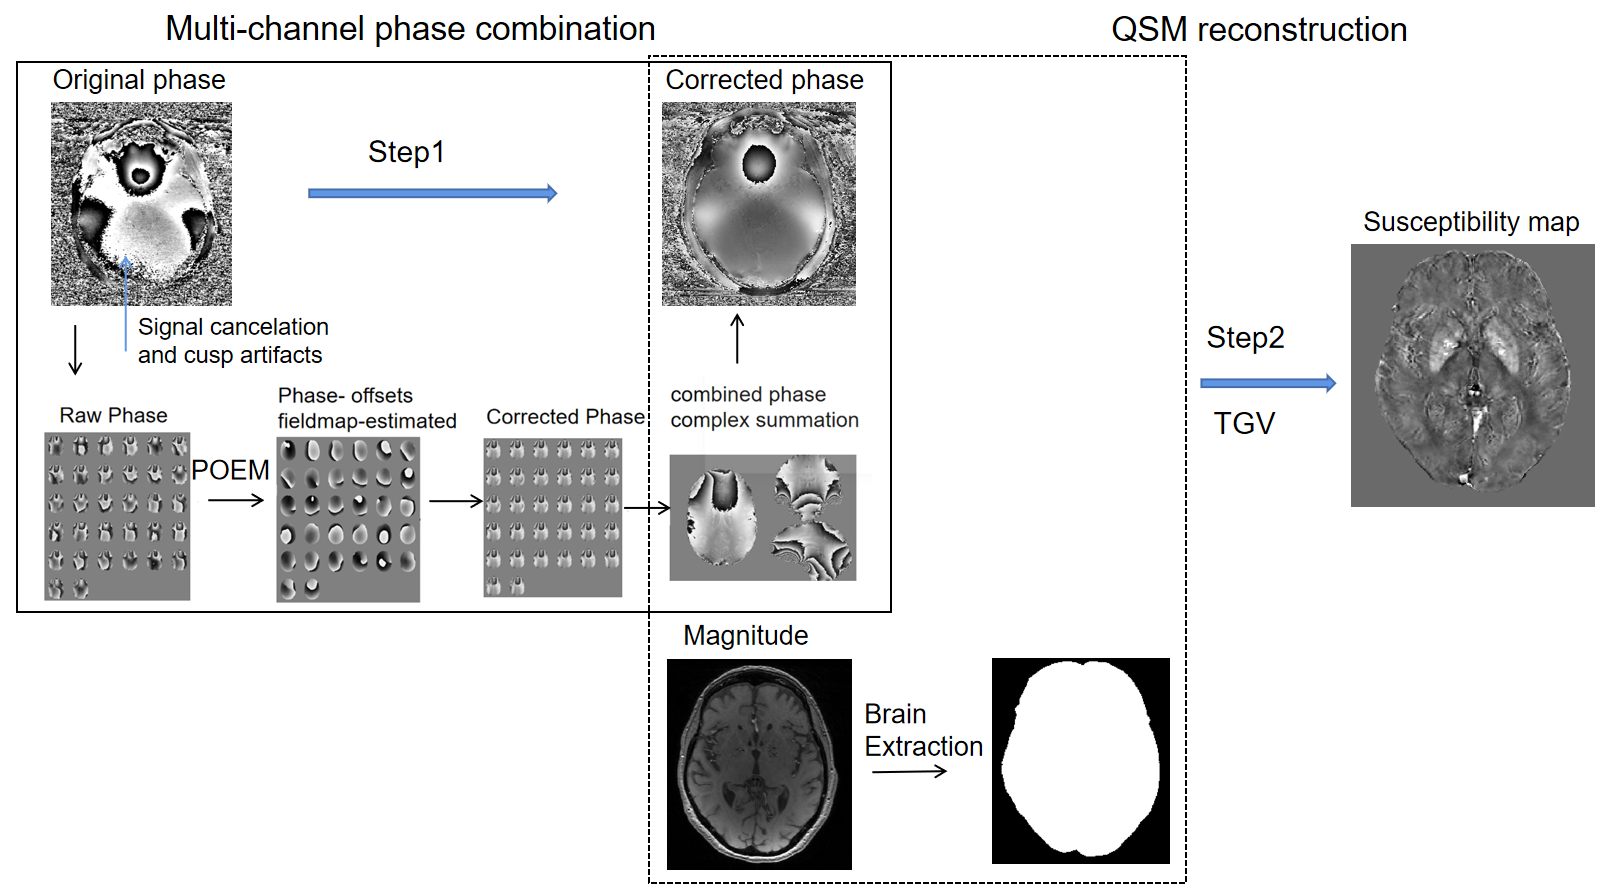
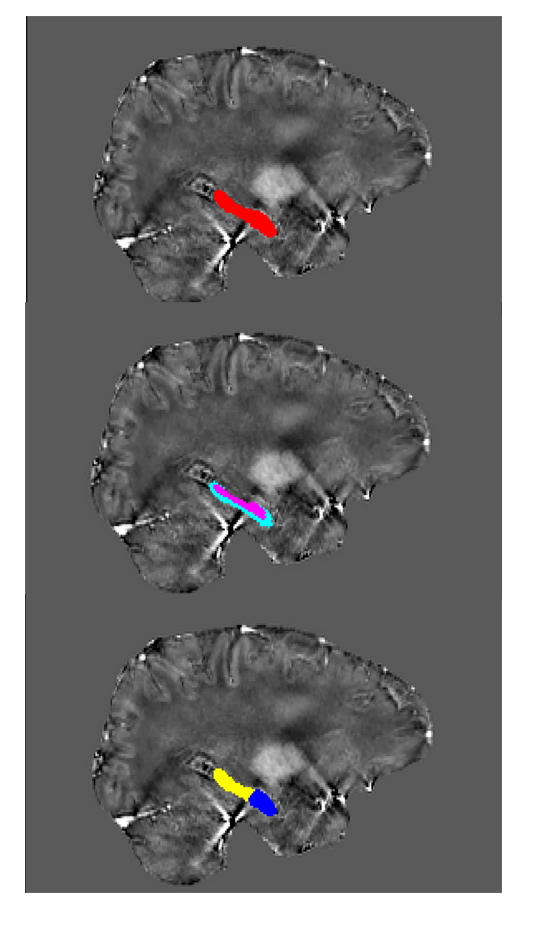
Image processing: For quantifying brain iron content, we combined the phase images from the 32 channel reception to obtain offset-corrected phase images using phase-offset estimation from multi-echo(POEM) method[7]. QSM maps were then reconstructed using a new total-generalized-variation (TGV) based method[8] (see Figure 1). QSM values were extracted from hippocampal ROIs (Figure 2). The hippocampus ROI was studied 1) as a whole, 2) as separate cytoarchitechtonic subfields (CA1, DG/CA3, Subiculum) and 3) along the long axis as anterior/posterior regions. Segmentations were performed using the Automatic Segmentation of Hippocampal Subfields (ASHS) package[9] with the T1w and T2w anatomical scans.
Data processing: Partial correlation analyses were performed to examine associations between iron content with memory performance, while controlling for age, sex, years of education, intracranial volume and corresponding ROI volume from the T1.
Results
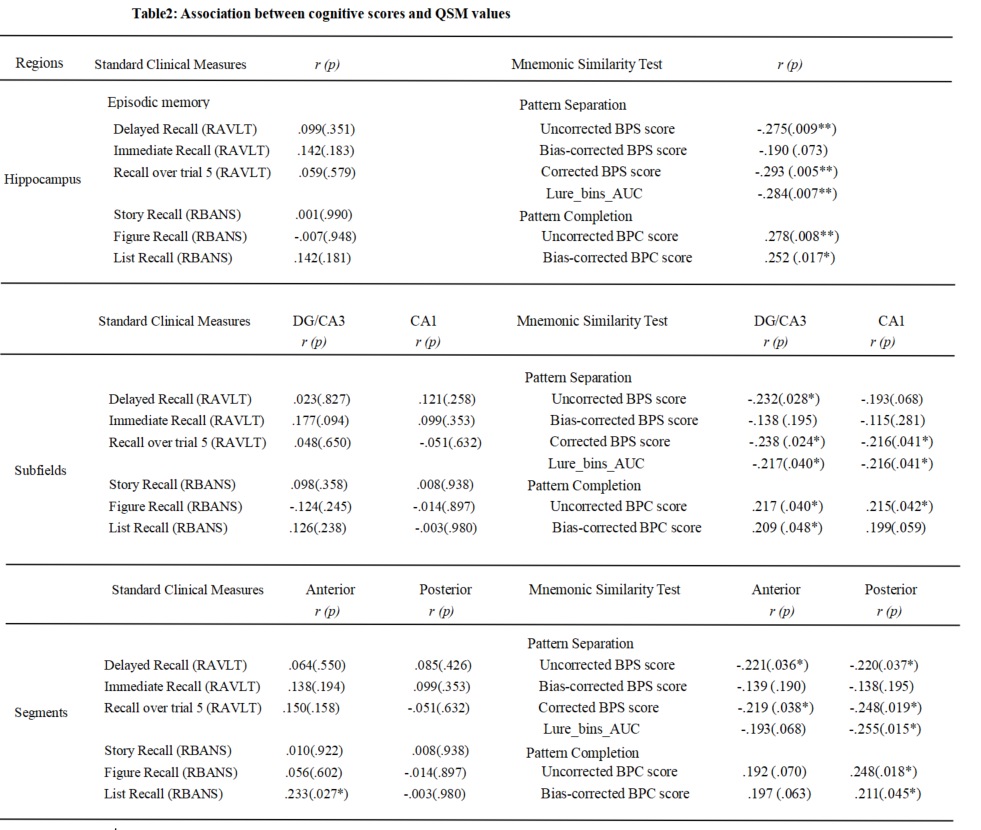
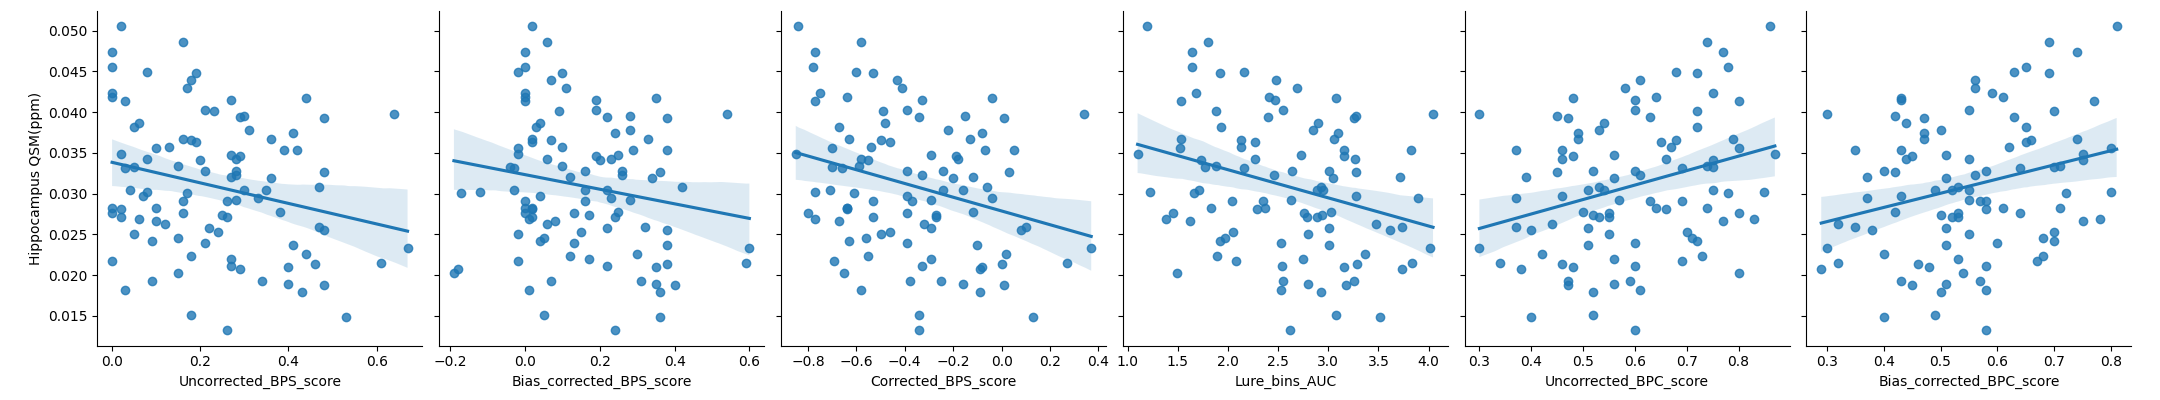
Associations between iron content, clinical episodic memory measures, as well as the MST are reported in Table 2. Overall, hippocampal iron was not reliably associated with clinical measures of episodic memory (p’s > .20). Hippocampal iron was negatively correlated with pattern separation. subfields and segments of the hippocampus did not reveal a specificity of this effect. Hippocampal iron was positively correlated with pattern completion, again, with no subfields or segments revealing a specificity of the effect. The area under the curve (AUC) for pattern separation across seven levels of mnemonic similarity was computed [e.g.10], and correlated with ROI iron content. A negative correlation between AUC was found for hippocampal iron. No subfields or segments revealed the specificity of the effect (Figure 3). Overall, whole hippocampal iron measures were most robustly associated with pattern separation and completion. Subregional and segment effects followed the same general trend and direction of hippocampal effects, but were weaker in magnitude and less statistically robust. Notably, hippocampal iron associations with MST performance were observed over and above any association with hippocampal volume.Conclusion
Our results demonstrated that elevated iron load in hippocampus in healthy older adults at elevated risk for AD is strongly associated with lower performance on behavioral tests specific to memory function, ie lower pattern separation scores and higher pattern completion scores, identifying a putative mechanism for pattern separation deficits in these clinical populations.Our findings suggest that hippocampal iron deposition may be a pathological mechanism resulting in poorer mnemonic discrimination in later life. Contrary to a recent related study[11], our findings revealed that standard clinical measures of episodic memory were relatively insensitive to hippocampal iron levels. This may be attributed to different acquisition parameters or reconstruction pipelines. Our findings suggest that more targeted measures of specific hippocampal processes may be necessary to identify the earliest, pre-clinical changes in memory functioning.
Among older adults at risk for AD, QSM- MRI may indicate that iron is a precursor to later MCI impairment.
Acknowledgements
This work was supported in part by grants from the Healthy Brains for Healthy Lives and NIA R01 AG068563.References
[1] Tao, Y., Wang, Y., Rogers, J. T., & Wang, F. (2014). Perturbed iron distribution in Alzheimer's disease serum, cerebrospinal fluid, and selected brain regions: a systematic review and meta-analysis. J Alzheimers Dis, 42(2), 679-690. doi: 10.3233/JAD-140396
[2] Ayton, S., Fazlollahi, A., Bourgeat, P., Raniga, P., Ng, A., Lim, Y. Y., . . . Bush, A. I. (2017). Cerebral quantitative susceptibility mapping predicts amyloid-beta-related cognitive decline. Brain, 140(8), 2112-2119. doi: 10.1093/brain/awx137
[3] Stark, S. M., Kirwan, C. B., & Stark, C. E. L. (2019). Mnemonic Similarity Task: A Tool for Assessing Hippocampal Integrity. Trends Cogn Sci, 23(11), 938-951. doi: 10.1016/j.tics.2019.08.003
[4] Berron, D., Schutze, H., Maass, A., Cardenas-Blanco, A., Kuijf, H, J., Kumaran, D., Duzel, E. (2016). Strong Evidence for Pattern Separation in Human Dentate Gyrus.J Neurosci, 36(29), 7569-7579. doi: 10.1523/JNEUROSCI.0518-16.2016
[5] Yassa, M. A., & Stark, C. E. (2011). Pattern separation in the hippocampus. Trends Neurosci, 34(10), 515-525. doi: 10.1016/j.tins.2011.06.006
[6] Bakker, A., Kirwan, C, B., Miller M, Stark C,E. (2008). Pattern separation in the human hippocampal CA3 and dentate gyrus. Science 319(5870), 1640–1642. doi: 10.1126/science.1152882
[7] Sun, H., Cleary, J. O., Glarin, R., Kolbe, S. C., Ordidge, R. J., Moffat, B. A., & Pike, G. B. (2020). Extracting more for less: multi-echo MP2RAGE for simultaneous T1 -weighted imaging, T1 mapping, R 2 * mapping, SWI, and QSM from a single acquisition. Magn Reson Med, 83(4), 1178-1191. doi: 10.1002/mrm.27975
[8] Langkammer, C., Bredies, K., Poser, B. A., Barth, M., Reishofer, G., Fan, A. P., . . . Ropele, S. (2015). Fast quantitative susceptibility mapping using 3D EPI and total generalized variation. NeuroImage, 111, 622-630. doi: 10.1016/j.neuroimage.2015.02.041
[9] Yushkevich,P,A., Pluta, J,B., Wang, H,. Xie, L.(2015). Automated volumetry and regional thickness analysis of hippocampal subfields and medial temporal cortical structures in mild cognitive impairment. Hum. Brain Map. 36, 256-287. doi: 10.1002/hbm.22627
[10] Stark, S. M., Yassa, M. A., Lacy, J. W., & Stark, C. E. (2013). A task to assess behavioral pattern separation (BPS) in humans: Data from healthy aging and mild cognitive impairment. Neuropsychologia, 51(12), 2442-2449. doi:10.1016/j.neuropsychologia.2012.12.014
[11] Chen, L., Soldan, A., Oishi, K., Faria, A., Zhu, Y., Albert, M., . . . Li, X. (2021). Quantitative Susceptibility Mapping of Brain Iron and beta-Amyloid in MRI and PET Relating to Cognitive Performance in Cognitively Normal Older Adults. Radiology, 298(2), 353-362. doi: 10.1148/radiol.2020201603
Figures