5324
Evaluation of the effect of microbiota on brain neural fiber bundles in germ-free common marmosets by structural connectome analysis
Chika Tokisugi1,2, Fumiko Seki2, Yuji Komaki2, Takashi Inoue2, and Junichi Hata1,2
1Tokyo Metropolitan University, Tokyo, Japan, 2Central Institute for Experimental Animals, Kawasaki, Japan
1Tokyo Metropolitan University, Tokyo, Japan, 2Central Institute for Experimental Animals, Kawasaki, Japan
Synopsis
Keywords: Brain Connectivity, Animals, microbiota
This study aimed to investigate the brain–gut correlation in common marmosets. We examined germ-free (GF) common marmoset in terms of brain connectivity between brain regions using magnetic resonance imaging. We performed three-dimensional diffusion-weighted imaging, generated whole-brain tractography, and created connectome weighted by mean fractional anisotropy (FA). We compared the difference between GF and control. In GF mice, mean FA between regions showed little difference; however, these were reduced in common marmoset compared with conventional ones. Studying the effect of microbiota on common marmoset brain might capture primate-specific characteristics and would help in exploring the microbiota effects on the human brain.Introduction
People experience gut discomfort when they are stressed, whereas they become anxious with gut upset. This interactive relationship between the brain and the gut is called the brain–gut connection. The gut microbiota was found to affect the brain, and the effects are gathering attention. To examine the effects of the microbiota on the brain, the study of germ-free (GF) animal brain is valuable. Previous mice studies have revealed that the microbiota influenced the morphological development and maturation of the white and gray matters and behavioral outcomes such as motor and cognitive functions1,2,3. Although the microbiota affected myelin development, few studies have focused on the structural connectivity between brain regions. Moreover, no studies have focused on primates that share more similar brain structures to humans than rodents, because no GF non-human primates are available. This study aimed to evaluate the effects of microbiota on the structural connectivity between brain regions in common marmoset (marmoset) (Callithrix jacchus), which we recently succeeded in generating as GF4.Methods
The experiments were conducted in brain specimens of marmoset using magnetic resonance imaging (MRI). A GF adult animal that underwent cesarean section and artificial nursing methods developed in the Central Institute for Experimental Animals (n = 1; age, 2.2 years) and a healthy adult animal (conventional control group) that has bacteria (n = 6; mean age, 2.8 years) were compared (Figure 1). Moreover, mouse brain specimens were used for primate and rodent comparison. The GF adult group (n = 11; mean age, 37 weeks) and the conventional adult control group (n = 11; mean age, 37 weeks) were compared. They are known to reach adulthood by 2 years (marmoset)5 and 8.6 weeks (mouse)6. 3D diffusion-weighted imaging (DWI) was performed using a 7.0-T Biospec 70/16 MRI scanner (Bruker BioSpin:Ettlingen, Germany) and 38-mm (marmoset) and 23-mm (mouse) solenoid coil (Takashima Seisakusho Ltd., Tokyo, Japan) with the following parameters (repetition time/echo time, 400/20 ms (marmoset) and 350/18 ms (mouse); number of b0, 5; b-value, 2000 s/mm2; motion probing gradient direction, 30; field of view, 36 × 26 × 22 mm (marmoset) and 18 × 13 × 9.6 mm (mouse); image matrix, 212 × 153 × 129 (marmoset) and 120 × 86 × 64 (mouse); spatial resolution, 0.17 × 0.17 × 0.17 mm (marmoset) and 0.15 × 0.15 × 0.15 mm (mouse)). From DWI, we created anatomical regions of interest for individual images, which allow dividing the whole-brain into 104 (marmoset) and 80 (mouse) regions using ANTs software7. By MRtrix3 software8, the constrained spherical deconvolution algorithm was performed to generate whole-brain tractography. Streamlines between regions were extracted, and the mean fractional anisotropy (FA) of each streamline was calculated and assigned to a node. We created the connectome matrix weighted by the mean FA. Finally, we calculated the average matrixes on the created connectome for each group and subtracted the GF matrixes from the control matrixes to detect the mean FA connecting two regions where the GF group had lower mean FA than the control group by subtracting the connectome.Results
MRI data are summarized in Figure 2. We compared the connectome between the GF group and control group (Figure 3). In mouse, the connectome subtraction results showed few connections if the mean FA was lower in the GF group than in the control group. By contrast, the mean FA differed brain regions in marmoset, such as V1 and hippocampus. The mean FA was low among regions connecting the occipital and limbic system to other regions. The visualization of the streamline also confirmed differences in the mean FA between regions (Figure 4).Discussion
A previous mice study reported that the FA was significantly lower in the GF group than in the control group in 4-week-old (juvenile) mice but not significantly different between the two groups of 12-week-old (adult) mice. Our results in mice were consistent with those in studies using adult brains. By contrast, the results for the marmoset showed differences in the mean FA between the two groups, even in 2-year-old animals (i.e., adulthood) (Figures 4 and 5). FA is a measure of anisotropic diffusion and reflects fiber density and myelin development in the white matter. Thus, the microbiota may affect the development of the fiber bundle between primate brain regions. Furthermore, this result indicates the effects of microbiota on fiber bundle may persist from the developmental stage to adulthood in marmosets unlike mice and that examining them in marmosets might be considerable data for humans. In this study, data were limited to GF animals alone because the specimen of GF marmoset brain is rare. Future studies will increase the number of GF marmosets and investigate the detailed effects of microbiota on the primate brain by periodical in vivo MRI by comparing the difference between GF and control marmoset brain to observe maturation-induced changes.Conclusion
The study demonstrated that the microbiota may affect the development of fiber bundles between brain regions in primates and marmoset. The effect of microbiota on fiber bundles may differ between rodents and primates. This study can be the first step in explaining the effects of microbiota on primate brains.Acknowledgements
This work was the result of using research equipment shared in MEXT Project for promoting public utilization of advanced research infrastructure(Program for advanced research equipment platforms MRI platform)Grant Number JPMXS0450400022 and this work was supported by JSPS KAKENHI Grant in Aid for Scientific Research C Number 22K07925.References
- Jing Lu, Sylvia Synowiec, Lei Lu, et al. Microbiota influence the development of the brain and behaviors in C57BL/6J mice. PLoS One. 2018 Aug 3;13(8):e0201829.2.
- Pauline Luczynski, Seán O Whelan, Colette O’Sullivan, et al. Adult microbiota-deficient mice have distinct dendritic morphological changes: differential effects in the amygdala and hippocampus. Eur J Neurosci. 2016 Nov;44(9):2654-2666.3.
- A E Hoban, R M Stilling, F J Ryan, et al. Regulation of prefrontal cortex myelination by the microbiota. Transl Psychiatry. 2016 Apr 5;6(4):e774.4.
- Inoue T, Okahara N, Okahashi N, et al. Generation of germ-free common marmosets. ResearchSquare. 2021 Jun 24. DOI: 10.21203/rs.3.rs-428622/v15.
- David H Abbott, Deborah K Barnett, Ricki J Colman, et al. Aspects of common marmoset basic biology and life history important for biomedical research. Comp Med. 2003 Aug;53(4):339-50.6.
- Gil Sharon, Timothy R Sampson, Daniel H Geschwind, et al. The Central Nervous System and the Gut Microbiome. Cell. 2016 Nov 3;167(4):915-932.7.
- Brian B Avants, Nicholas J Tustison, Gang Song, et al. A reproducible evaluation of ANTs similarity metric performance in brain image registration. Neuroimage. 2011 Feb 1;54(3):2033–2044.8.
- J-Donald Tournier, Robert Smith, David Raffelt, et al. MRtrix3: A fast, flexible and open software framework for medical image processing and visualisation. Neuroimage. 2019 Nov 15;202:116137.
Figures
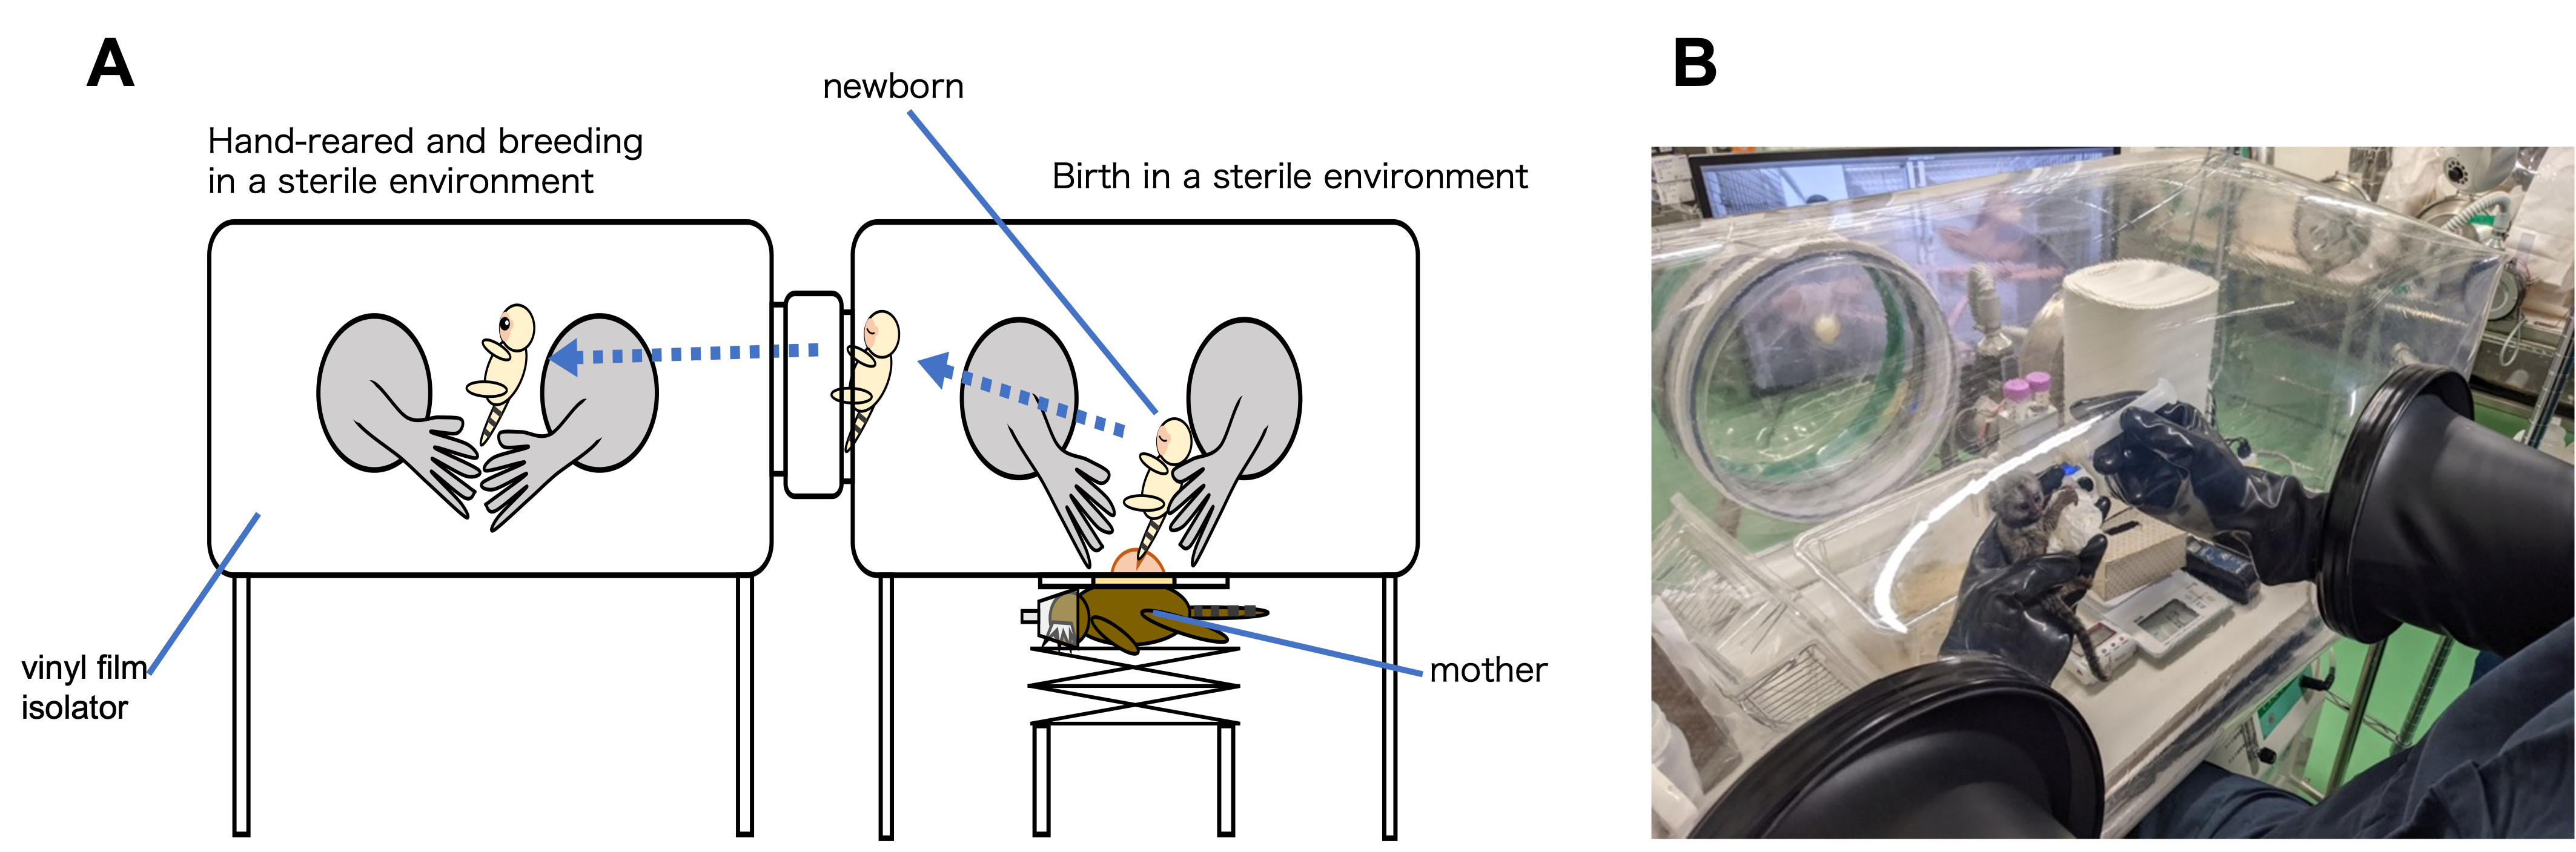
Figure 1. Cesarean section,(A), and neonatal care environment (B) developed in the CIEA. A flexible vinyl film isolator was used to create a sterile environment in which the space and all breeding equipment, etc. were sterilized. The cesarean section was performed in a sterile environment to obtain a newborn infant. Newborns were hand-reared while maintaining sterile conditions. They weaned at about 2 months of age and moved to a large isolator for rearing with feeding sterilized diet.
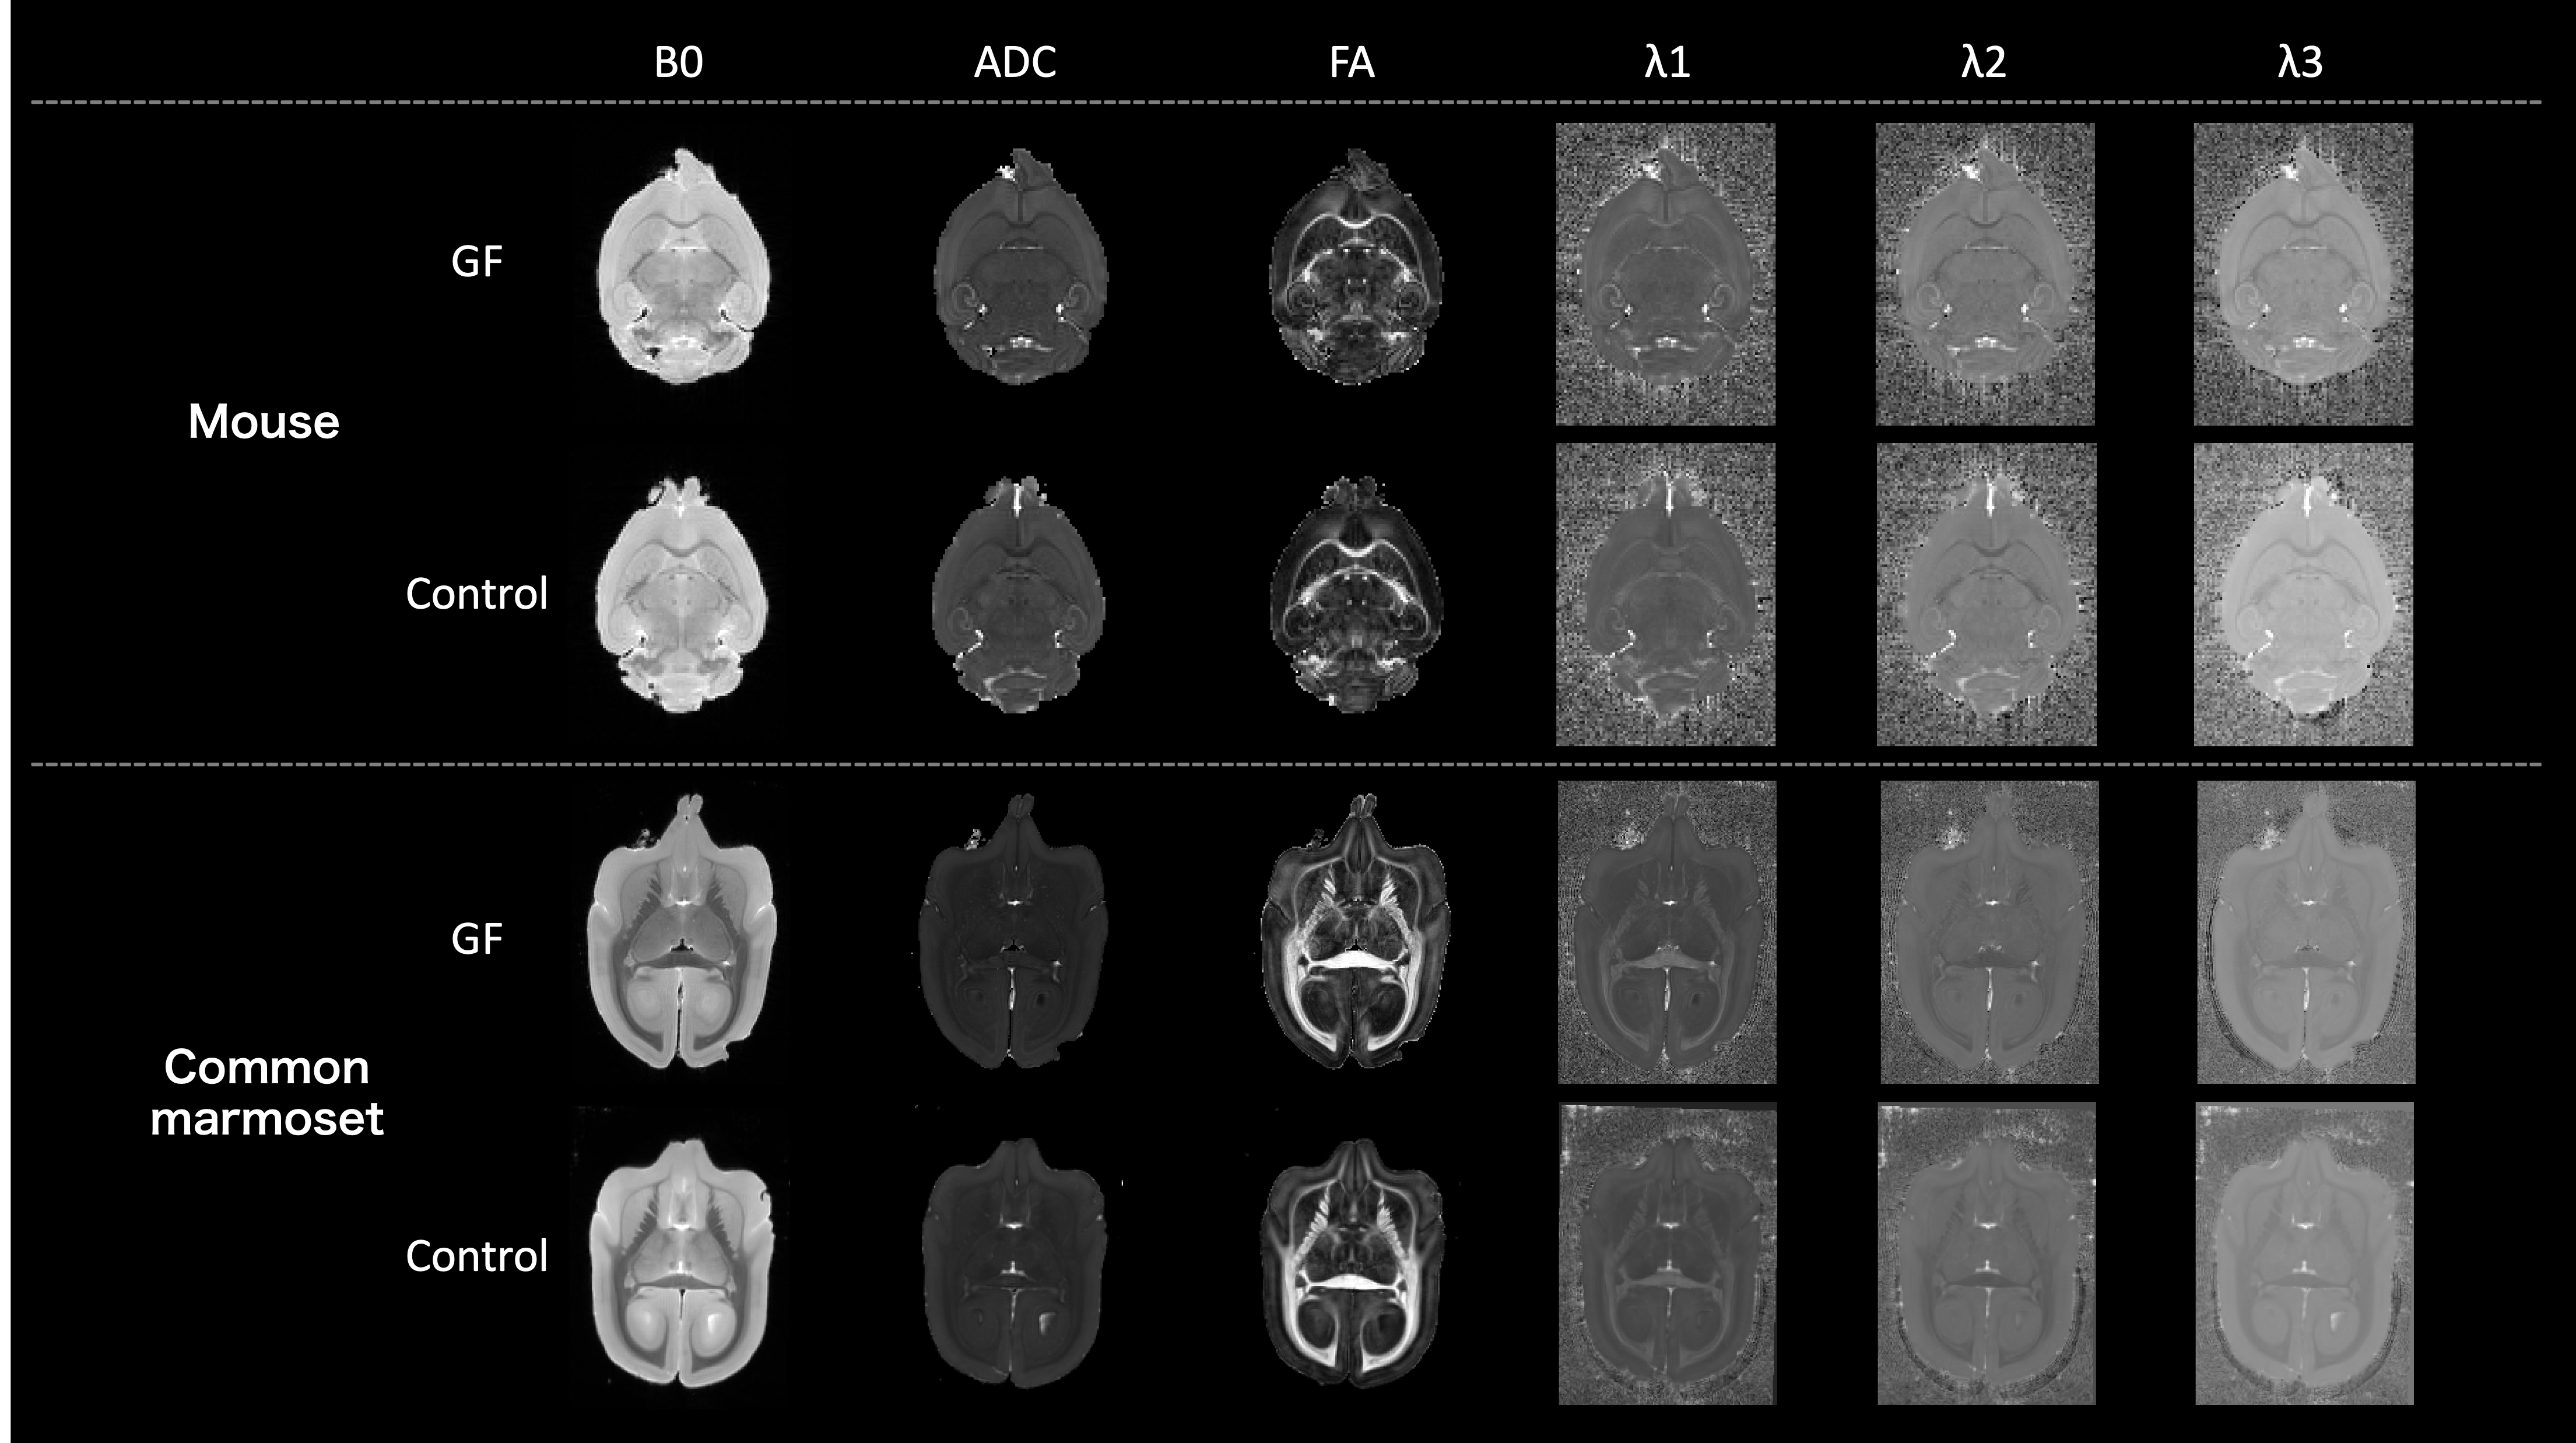
Figure 2. Diffusion-tensor images (DTI). Cross-section image in an axial image. Above: mice; below, common marmosets. From left to right, B0/ ADC/ FA/ λ1/ λ2/ λ3 in DTI analysis are presented. λ1, λ2, and λ3 are the eigenvalue of the diffusion tensor and represent the diffusion coefficients along the x-, y-, and z-axes. ADC is a measure of the magnitude of diffusion itself, and it is the average of λ1, λ2, and λ3. FA are a measure of the strength of anisotropic diffusion.
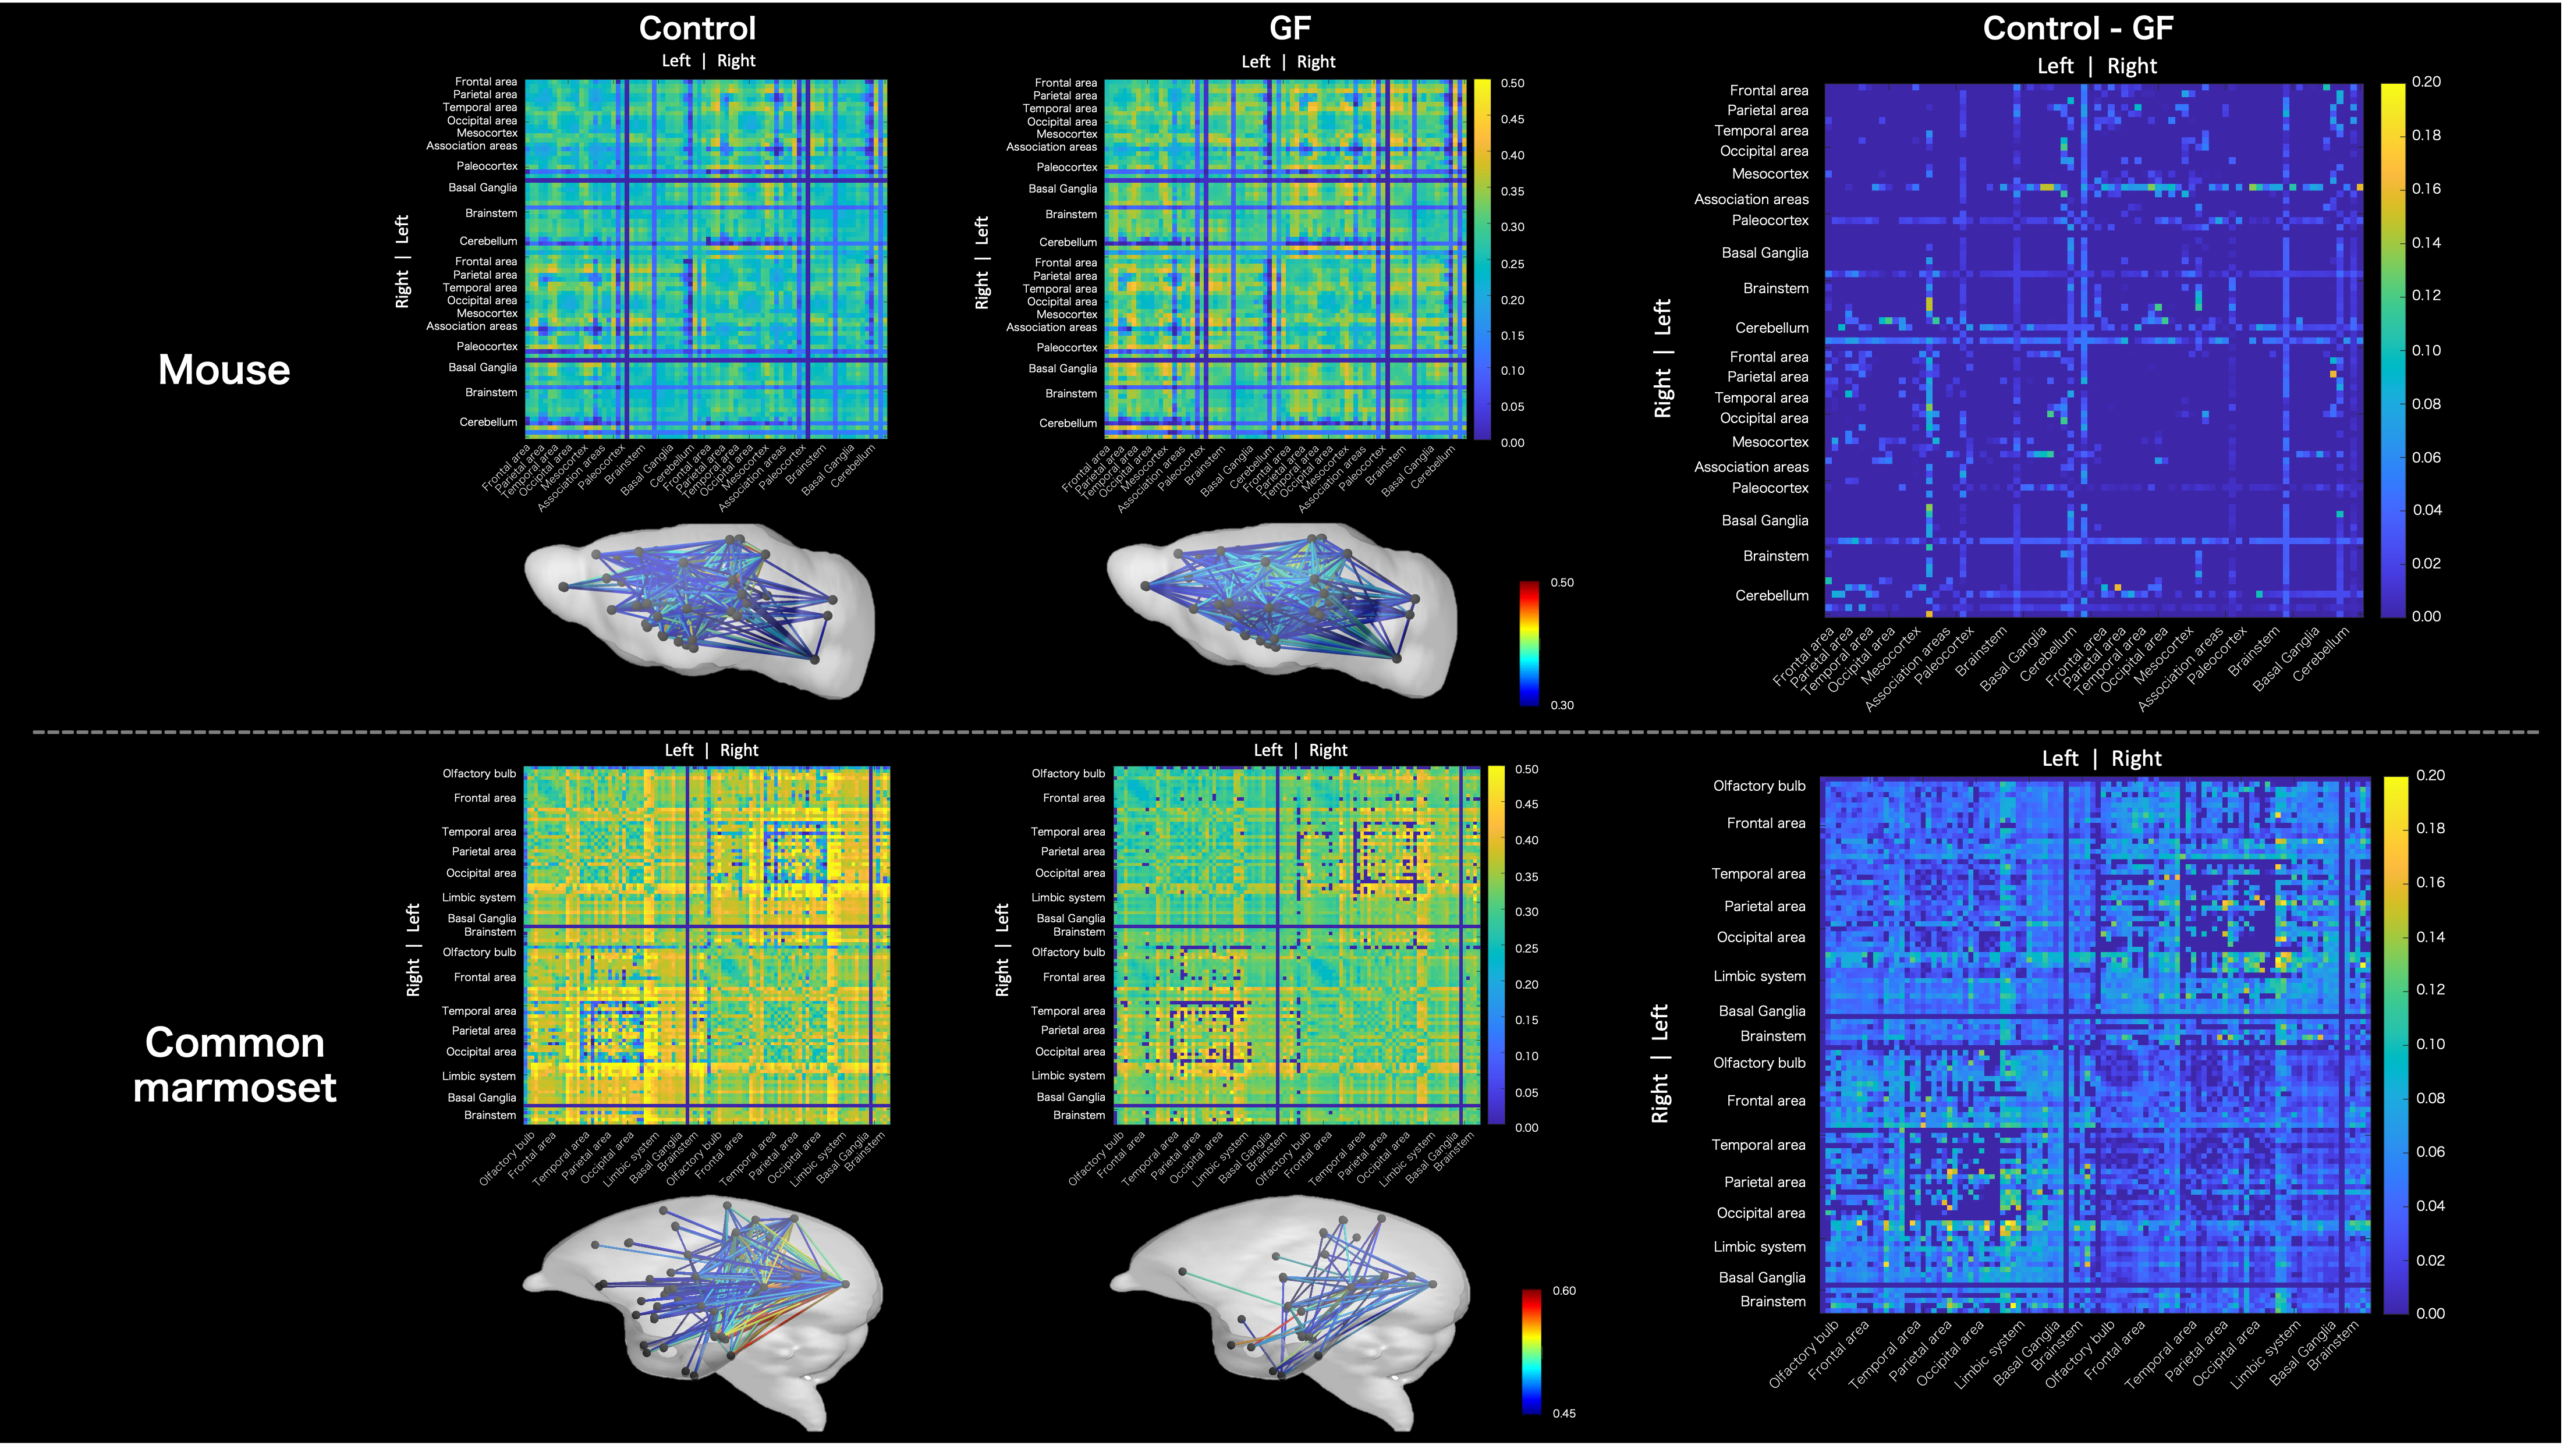
Figure 3. Results of the connectome matrix weighted by mean FA obtained from the CSD analysis. Above: mice; below, common marmosets. From left to right, control/GF/control–GF are presented. Below the connectome matrices, the structural brain network was visualized to represent connections with high mean FA in the connectome. The color scale bar indicates mean FA. The control–GF results show that GF has lower FA than controls across brain regions in the common marmoset.
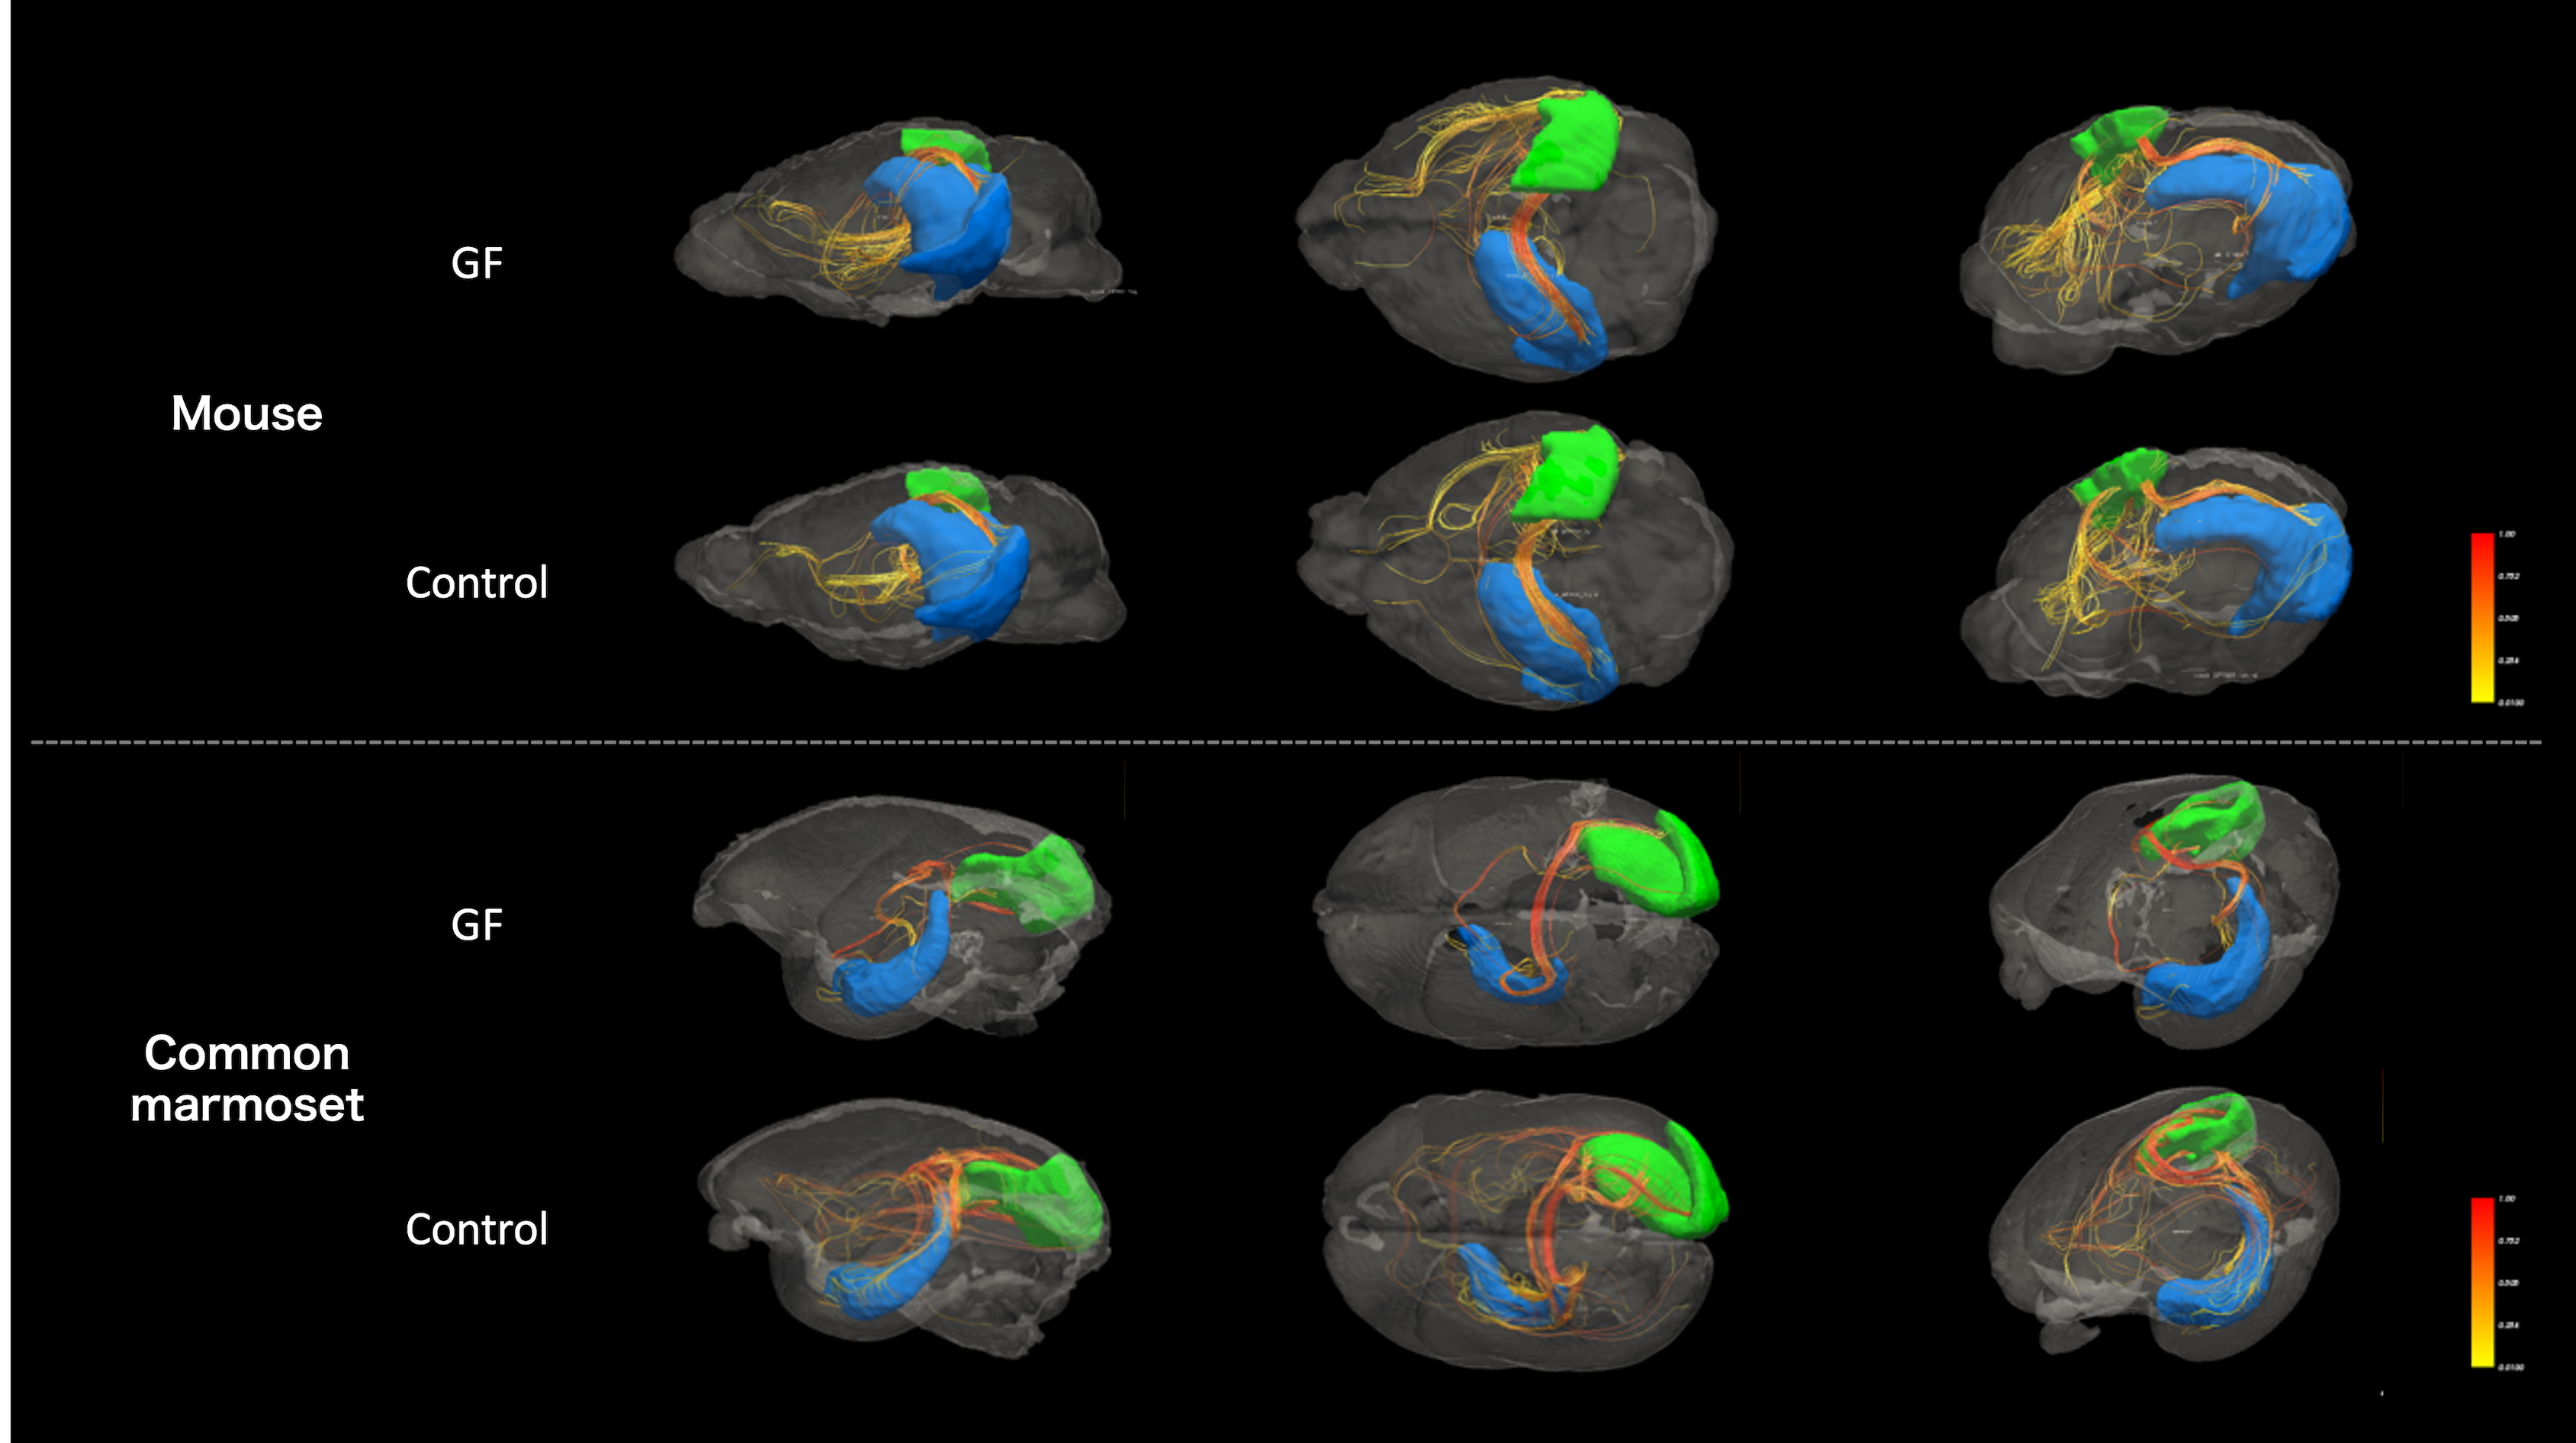
Figure 4. Visualization of the streamline using diffusion-weighted imaging with regions of interest in the right V1 and contralateral hippocampus, where were a difference in mean FA in connectome of the common marmoset. Above, mice; below, marmosets. Brain region, blue; left hippocampus, green; right V1. The streamline is colored to reflect the mean FA. It is visually evident that there is a difference in streamline between GF and control in the common marmoset.
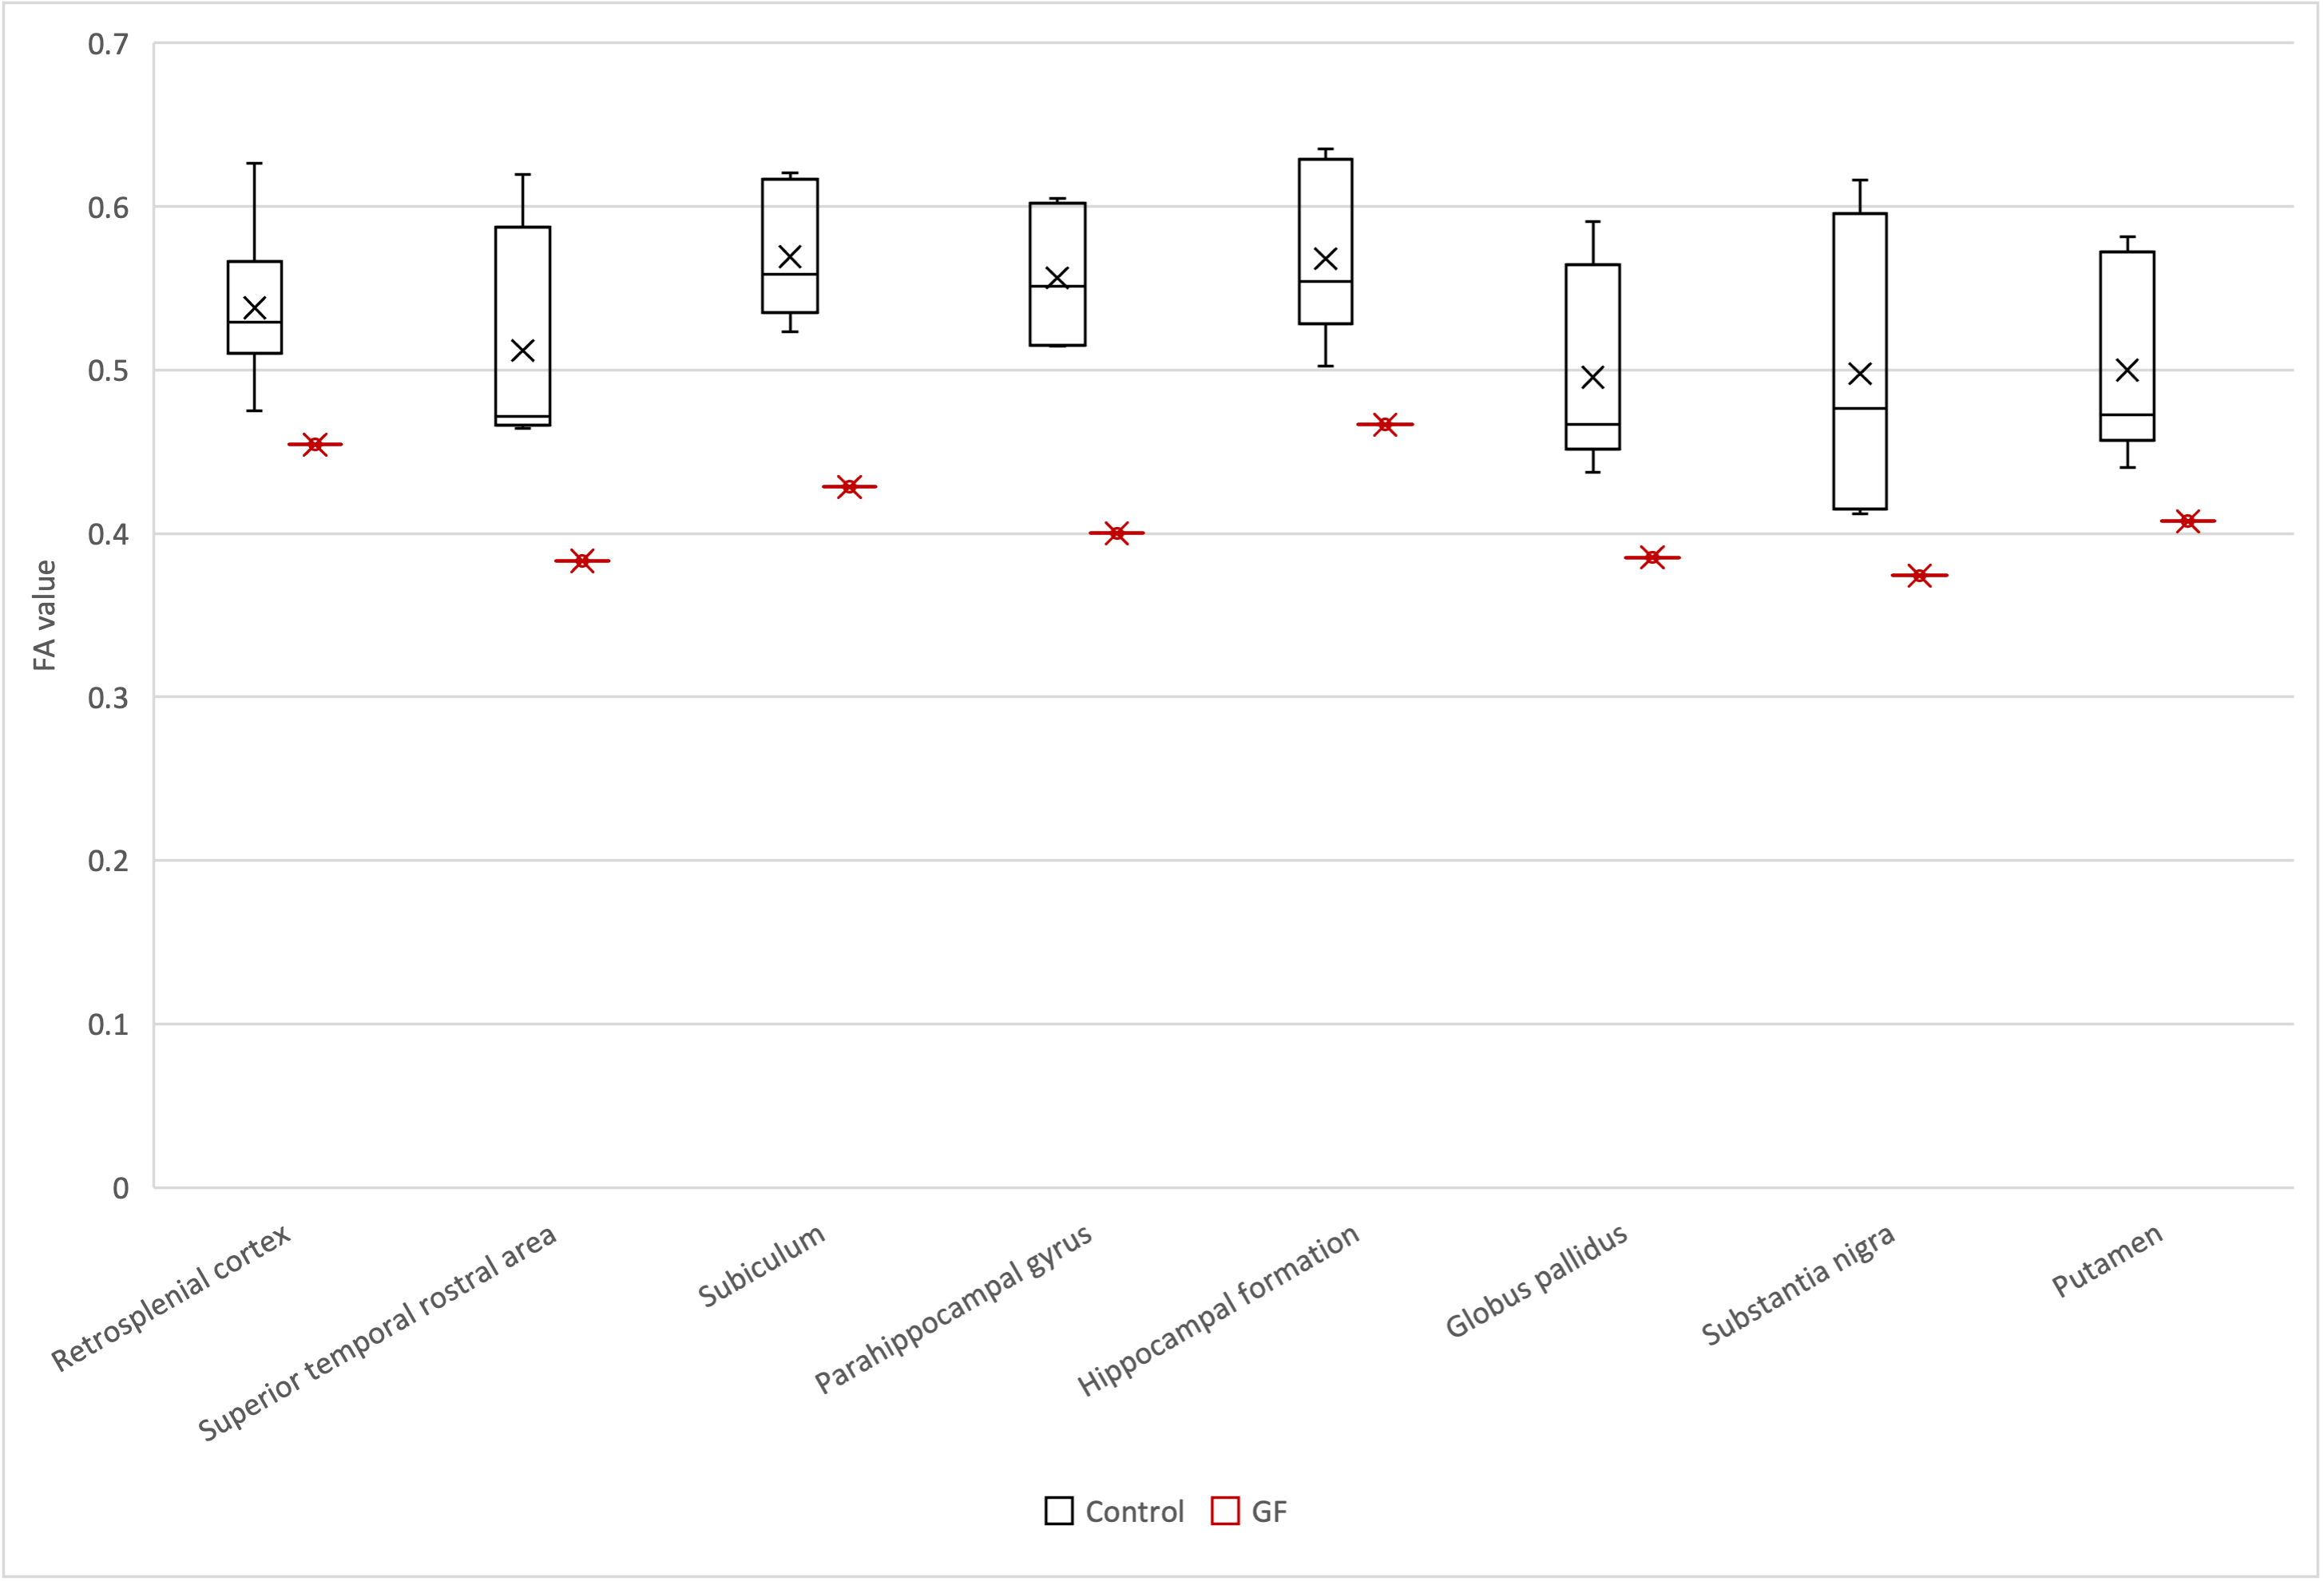
Figure 5. FA of the streamline connecting the right V1 and the contralateral brain region in the common marmoset (black, control; red, germ-free) plotted in the boxplot. The boxplot consisted of straight line called the whisker and rectangle called the box. The lower end of the whisker, minimum; the upper end of the whisker, maximum; the bottom of the box, first quartile; the top of the box, third quartile; the line inside the box, median; the cross, average. The vertical axis shows the mean FA, and the horizontal axis shows the brain regions.
DOI: https://doi.org/10.58530/2023/5324