5323
Comparing reliability of BOLD cerebrovascular reactivity of end-tidal pCO2 versus mean cerebellar signal regression in pediatric moyamoya.1Cerebrovascular Surgery and Interventions Center, Boston Children's Hospital, Boston, MA, United States, 2University of Texas Southwestern Medical Center, Dallas, TX, United States
Synopsis
Keywords: Blood vessels, Pediatric, Cerebrovascular, reactivity, CVR, moyamoya
We compared the reliability of BOLD CVR (cerebrovascular reactivity) between two regression approaches – etpCO2 signal and average cerebellar signal – in pediatric moyamoya patients. We estimated CVR using a lagged optimized GLM model, conducted cortical parcellation, and compared left-right hemispheric CVR differences to clinical and imaging reports. We found that etpCO2 had poorer fits during regression compared to the cerebellar approach (p<0.0001) and incorrectly identified disease laterality in 2/8 patients. These effects were strongly observed in subjects with poor breath-hold task compliance, indicating that the cerebellar approach is more reliable for studies of young pediatric moyamoya patients.Introduction
Clinical management of children with moyamoya disease may be improved by the development of robust and reliable hemodynamic metrics of brain health. One such metric is cerebrovascular reactivity (CVR), which is the ability for brain vasculature to increase blood flow in response to vasodilatory stimuli.1 In blood-oxygen level dependent (BOLD) CVR, there are many methods both to evoke vasodilatation as well as to analyze the hemodynamic change.2,3 Breath-hold induced CVR is one such method, and when analyzed with a general linear model regressor of the average cerebellar signal, it has been shown to provide clinical utility as a predictor for ischemic stroke in pediatric moyamoya.4,5However, task compliance and breath-hold tolerance vary greatly in young pediatric patients. and previous studies of reliability of CVR are often limited to healthy subjects.1,6 Our objective was to compare the reliability of detecting breath-hold BOLD-CVR changes in cases of pediatric moyamoya disease using two different regressors in the analysis: the average cerebellar BOLD signal, and end-tidal pCO2 (etpCO2). We hypothesized that, in the setting of sufficiently compliant breath-hold task performance, etpCO2-based CVR would more reliably correlate with presenting clinical symptoms and angiographic findings.
Methods
Subjects underwent an MRI before undergoing revascularization surgery as part of an IRB approved study. The MRI protocol included T1-weighted anatomical imaging (TR=2500ms, TE=1.69-7.27ms, FOV=256x256mm2 , resolution=1mm isotropic) and CVR mapping via breath-hold BOLD imaging (TR=1150ms, TE=30ms, FOV=234x234mm2, resolution=3mm isotropic, SMS=3) with continuous acquisition during a breath-hold challenge consisting of five 20s breath holds with post-hold exhalation and self-paced recovery breathing.4 Induced hypercapnia was monitored using a capnometer sampling through a nasal cannula with mouth scoop.BOLD data was pre-processed using fMRIPREP 20.2.6.7 Parameter maps of CVR (%BOLD/mmHg for etpCO2 CVR and Δ%BOLD/BOLD for cerebellar CVR) were calculated using a lagged optimized regression approach.8 CVR values for maps were considered significant based on the critical T-statistic >1.96 (p<0.05), similar to previous approaches.9 Parcellations from the FreeSurfer analysis in fMRIPREP were used for comparison between the two analyses.10 Interhemispheric differences in CVR were determined by conducting T-tests between left and right groups of whole brain and the cerebral cortex voxels. These comparisons were cross-referenced to disease laterality described in each subject’s angiography and neurology reports.
Results
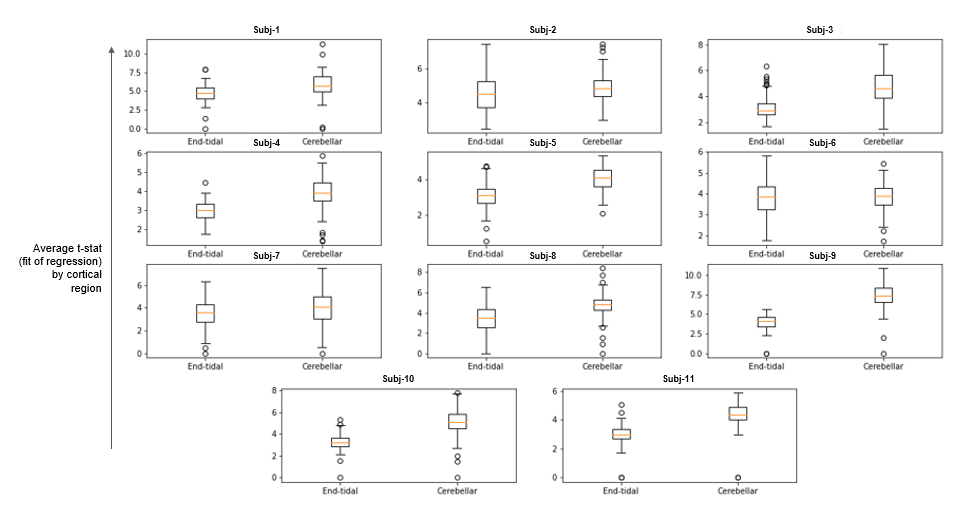
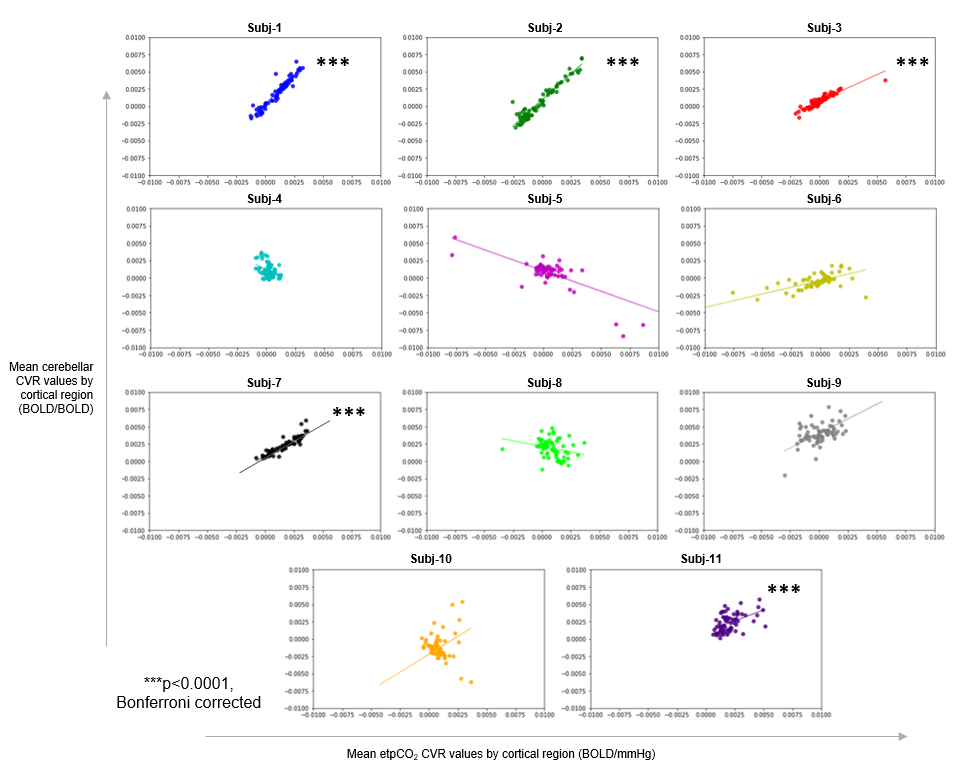
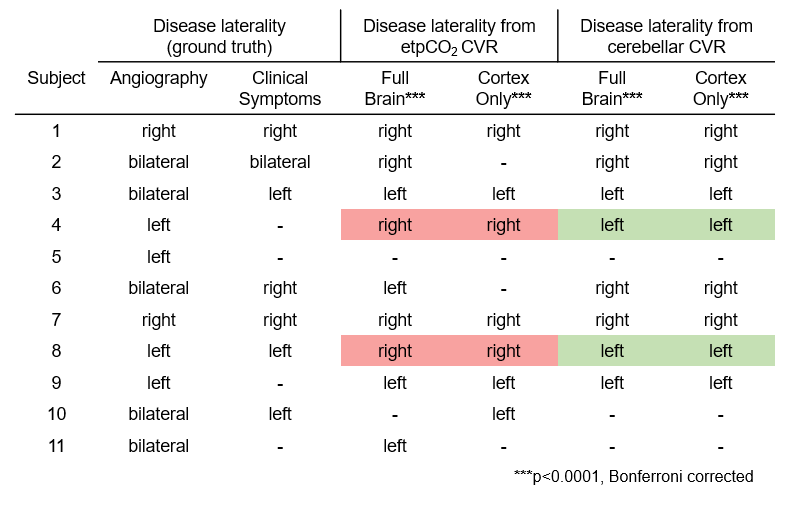
For the 11 pediatric moyamoya patients (7 female, mean age: 13.4 yrs, ranging 10-20 yrs) the mean gray matter CVR across subjects with the etpCO2 analysis is 0.087 %BOLD/mmHg (SD: 0.10) and the cerebellar analysis is 0.13 %BOLD/BOLD (SD: 0.16). During calculation of parameter maps, for all patients, the etpCO2 analysis had more voxels that did not meet the threshold for significance compared to the cerebellar approach (p<0.0001), with a mean of 3% more of each parcellated brain region being removed. Example parameter maps are shown in Figure 1.Left-right hemispheric differences in CVR were found in 8/11 patients in both end-tidal and cerebellar approaches (p<0.0001, Bonferroni corrected). The cerebellar analysis found corresponding laterality to angiography and clinical history in 8/8 patients, but the end-tidal approach was only consistent for 6/8 patients (see Table 1). Correlating mean CVR values for each cortical parcel between both analyses found significant positive linear associations in only 5/11 patients (p<0.0001, Bonferroni corrected) (see Figure 3).
Discussion
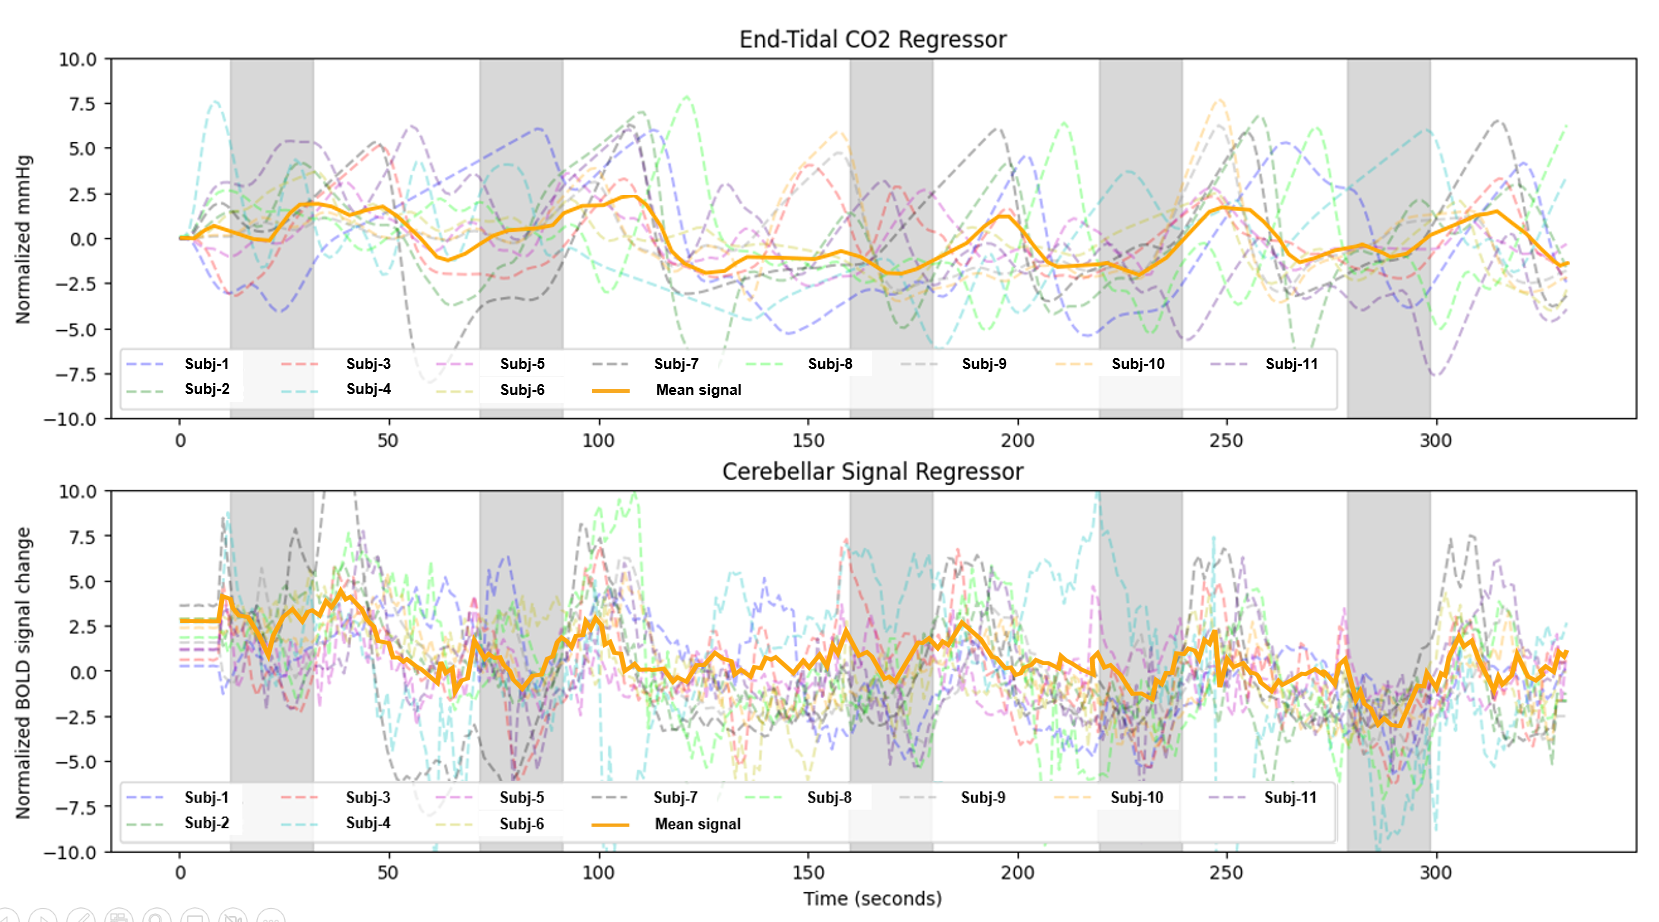
We explored two analysis approaches for breath-hold CVR in a cohort of children with moyamoya disease. Lower mean t-statistic (GLM fit) by cortical parcel (Figure 2) and fewer voxels retained for significance in the etpCO2 approach implies worse fits for regression compared to the cerebellar approach. Worse correspondence between clinical reports and etpCO2-CVR also suggests reduced potential clinical utility.Overall agreement between the two approaches is only good in some cases (see Figure 3). Subjects without good correlation between the approaches appeared to have poorer breath hold performance (see Figure 4). Subjects in our study were less consistent in their breath holds compared to previous studies of breath-hold performance in adults.11,12,9 Overall our findings suggest that the etpCO2 analysis approach may not be appropriate for breath-hold CVR in pediatric moyamoya disease. Defining a metric of breath hold compliance would be the next step in exploring the difference between analysis approaches. Future work should pinpoint the threshold at which the etpCO2 approach to CVR analysis deteriorates for subjects who do not consistently obey breathing cues.
Conclusion
Using etpCO2 for CVR analysis led to poorer consistency between CVR findings and disease symptoms. This is because subjects were unable to perform the task with high fidelity, and therefore this study supports previous cerebellar CVR approaches to pediatric moyamoya for effective clinical utilization.3Acknowledgements
The Thrasher Research Fund provided funds supporting this work. Special thanks to Stefano Moia at EPFL for his advice in using his CVR analysis tool, phys2cvr.References
1. Bright, Molly G., and Kevin Murphy. 2013. “Reliable Quantification of BOLD fMRI Cerebrovascular Reactivity despite Poor Breath-Hold Performance.” NeuroImage 83 (December): 559.
2. Dlamini, N., P. Shah-Basak, J. Leung, F. Kirkham, M. Shroff, A. Kassner, A. Robertson, et al. 2018. “Breath-Hold Blood Oxygen Level-Dependent MRI: A Tool for the Assessment of Cerebrovascular Reserve in Children with Moyamoya Disease.” AJNR. American Journal of Neuroradiology 39 (9): 1717–23.
3. Dlamini, N., M. Slim, F. Kirkham, M. Shroff, P. Dirks, M. Moharir, D. MacGregor, A. Robertson, G. deVeber, and W. Logan. 2020. “Predicting Ischemic Risk Using Blood Oxygen Level-Dependent MRI in Children with Moyamoya.” AJNR. American Journal of Neuroradiology 41 (1): 160–66.
4. Esteban, Oscar, Christopher J. Markiewicz, Ross W. Blair, Craig A. Moodie, A. Ilkay Isik, Asier Erramuzpe, James D. Kent, et al. 2019. “fMRIPrep: A Robust Preprocessing Pipeline for Functional MRI.” Nature Methods 16 (1): 111–16.
5. Fierstra, J., O. Sobczyk, A. Battisti-Charbonney, D. M. Mandell, J. Poublanc, A. P. Crawley, D. J. Mikulis, J. Duffin, and J. A. Fisher. 2013. “Measuring Cerebrovascular Reactivity: What Stimulus to Use?” The Journal of Physiology 591 (23): 5809–21.
6. Koep, Jodie L., Alan R. Barker, Rhys Banks, Rohit R. Banger, Kate M. Sansum, Max E. Weston, and Bert Bond. 2020. “The Reliability of a Breath-Hold Protocol to Determine Cerebrovascular Reactivity in Adolescents.” Journal of Clinical Ultrasound: JCU 48 (9): 544–52.
7. Fisher, Joseph A., Lashmi Venkatraghavan, and David J. Mikulis. 2018. “Magnetic Resonance Imaging-Based Cerebrovascular Reactivity and Hemodynamic Reserve.” Stroke; a Journal of Cerebral Circulation 49 (8): 2011–18.
8. Moia, Stefano, Rachael C. Stickland, Apoorva Ayyagari, Maite Termenon, Cesar Caballero-Gaudes, and Molly G. Bright. 2020. “Voxelwise Optimization of Hemodynamic Lags to Improve Regional CVR Estimates in Breath-Hold fMRI.” Conference Proceedings: Annual International Conference of the IEEE Engineering in Medicine and Biology Society. IEEE Engineering in Medicine and Biology Society. Conference 2020 (July): 1489–92.
9. Stickland, Rachael C., Kristina M. Zvolanek, Stefano Moia, Apoorva Ayyagari, César Caballero-Gaudes, and Molly G. Bright. 2021. “A Practical Modification to a Resting State fMRI Protocol for Improved Characterization of Cerebrovascular Function.” NeuroImage 239 (October): 118306.
10. Reuter, M., Schmansky, N.J., Rosas, H.D., Fischl, B. 2012. Within-Subject Template Estimation for Unbiased Longitudinal Image Analysis. Neuroimage 61 (4), 1402-1418.
11. Pinto, Joana, Molly G. Bright, Daniel P. Bulte, and Patrícia Figueiredo. 2020. “Cerebrovascular Reactivity Mapping Without Gas Challenges: A Methodological Guide.” Frontiers in Physiology 11: 608475.
12. Zvolanek, Kristina M., Rachael C. Stickland, Molly G. Bright. 2020. “Feasibility of a cued deep breathing task to map cerebrovascular reactivity in healthy and clinical pediatric cohorts”. Conference Proceedings: ISMRM & SMRT Conference 2020. International Society for Magnetic Resonance in Medicine. 2020 (August): 4603.
Figures