5317
Characterising the lifespan trajectory of six essential neurometabolites in a cohort of 100 participants.1Department of Forensic and Neurodevelopmental Sciences, Institute of Psychiatry, King's College London, London, United Kingdom, 2MRC Centre for Developmental Neurobiology, King's College London, London, United Kingdom, 3Centre for the Developing Brain, King's College London, London, United Kingdom, 4Department of Radiology and Radiological Science, The Johns Hopkins University School of Medicine, Baltimore, MD, United States, 5Department of Neurology and Neurosurgery, McGill University, Montreal, QC, Canada
Synopsis
Keywords: Normal development, Spectroscopy, GABA, Normative, metabolites, childhood, adolescence, adult
We characterised the normative lifespan trajectories of brain neurometabolites, as measured by 1H-Magnetic Resonance spectroscopy (1H-MRS) from the posterior parietal cortex across 100 individuals (aged 5-40 yrs). Glutamate + glutamine (Glx), N-acetylaspartate (NAA), gamma-aminobutyric acid (GABA+) and glutathione (GSH) showed non-linear trajectories, decreasing steeply in childhood/adolescence before a gradual, significant, decline across early adulthood. Results suggest age associated changes in brain composition may contribute to the observed trajectories. Importantly, a non-linear regression modelling approach was found to be more appropriate for neurometabolite trajectories than a linear regression model and should be considered in future to prevent simplification of data trends.
Introduction
Proton magnetic resonance spectroscopy (1H-MRS) can provide valuable insights into the developmental trajectories of brain neurometabolites that regulate the structural and functional changes of normative brain development1-3. In turn, this can feasibly provide biomarkers of atypical neurodevelopment4. Surprisingly, studies to date have used linear modelling approaches for neurometabolite trajectories, which are highly implausible5, and often focus on aging, or specific age-categories. Here we aim to better characterise the trajectory of six essential brain neurometabolites, as measured by edited 1H-MRS across childhood, adolescence, and adulthood, using non-linear modelling. We then explore how differences in brain composition with development and ageing contribute to the characterised trajectories.Methods
MRI/1H-MRSData were collected from 100 healthy participants (5 – 40 years; 43F/47M). MRI and 1H-MRS was performed on a Philips 3T ‘Achieva’. For all scans, a 32-channel head coil was used for receive, and body coil for transmit. First, a T1-weighted (MP-RAGE) image was used to guide voxel placement. MEGA-PRESS data were obtained from a 27cm3 voxel positioned over the posterior parietal cortex (Figure 1A) with the following parameters: 320 transients, 160 ON/160 OFF, TE/TR 68/2000 ms, editing pulses placed at 1.9 ppm in the ON acquisitions, VAPOR water suppression. Interleaved water reference was applied to mitigate scanner drift.
Data processing
Edited 1H-MRS data were analysed using OSPREY 6. Raw data were eddy current-corrected followed by spectral averaging, Fourier transformation and water signal removal, resulting in difference and sum spectra (Figure 1B). Average metabolite spectra were modelled using a simulated basis set with a flexible spline baseline and assumed macromolecular baseline7. We report neurometabolite ratios relative to creatine and in institutional units relative to the unsuppressed water, accounting for findings driven by reference compound. Given this was secondary data analysis, we did not have access to T1 images for segmentation and tissue correction and thus used tissue fraction in the statistical model.
Data analysis
Data were processed in Rstudio. Analysis of covariance tests (ANCOVA) observed the impact of age-category/gender on data quality (in line with MRSinMRS8) and neurometabolite concentrations (with fit residuals as covariate). Tukey HSD was used for post-hoc testing. Linear regression and non-linear Locally Weighted Scatter-plot Smoother fitting (LOESS) regression functions were used to estimate trajectories of neurometabolites over time using the lm and LOESS function. Predicted data were correlated with actual data to obtain a pseudo R2 for each LOESS model. Pearson correlation coefficients were calculated for neurometabolite pairs, voxel tissue fractions and neurometabolite concentrations/age.
Results
Figure 2 shows that age group significantly influenced all neurometabolite concentrations (excluding choline). Concentrations significantly decreased from childhood to adulthood. Figure 3 shows linear regression and non-linear LOESS regression models used to fit the trajectories of creatine scaled neurometabolite concentrations over time. GABA+, Glx, NAA and GSH decrease steeply in childhood and/or adolescence, then continue to gradually decrease in early adulthood. Choline concentrations remain relatively stable throughout the lifespan. For all neurometabolites pseudo R2 (non-linear) were greater than R2 (linear) values. Water referenced data are entirely consistent but were not tissue corrected at this stage (data not shown). Figure 4 shows that correlations between creatine scaled neurometabolites appear weaker in adulthood when compared to childhood and adolescence but show the same pattern. NAA, Glx, Glu and GABA strongly correlate in childhood and adolescence. Glx and glutamate correlate more strongly than Glx and Gln in all age groups. Figure 5 shows GM negatively correlated, while WM positively correlated with age. Glx, NAA, GSH and GABA+ concentrations correlate positively (and significantly) with voxel GM fraction and negatively with WM voxel fraction (for Glx and NAA this is significant). When statistically accounting for tissue in our LOESS analysis, the non-linear trajectory remains consistent and significant (data not shown).Discussion
Measured concentrations of GABA+, Glx, NAA and GSH were significantly greater in children/adolescents than adults, with linear regression models showing a significant negative trajectory between neurometabolite concentration (creatine scaled) and age. Non-linear (LOESS) regression modelling showed a sharp decrease in late childhood, before a more gradual decline in adulthood. For all neurometabolites, non-linear modelling better explained the variance of concentrations overtime compared to linear models as shown by the higher R2. Of note, GABA and Glx trajectories are highly similar, their concentrations strongly correlating throughout the lifespan. This likely reflects their metabolic association and possibly consistency in homeostasis between excitation and inhibition. Results suggest that changes in brain tissue composition with age (increasing WM and decreasing GM) may contribute to the observed neurometabolite trajectories; Glx, GABA+, GSH and NAA concentrations positively correlated with voxel GM fraction and negatively correlated with voxel WM fraction. However, voxel composition changes linearly with age and so other biological factors must contribute to the non-linear changes in neurometabolite concentrations over the lifespan which we continue to investigate further. For example, tissue- and metabolite relaxation likely differ across the lifespan. Overall, this work provides an essential characterisation of the normative developmental trajectory of key neurometabolites in a single large developmental sample. Future work should extend the age range of the characterised trajectories to build upon these findings.Acknowledgements
This study was supported by the Johns Hopkins Therapeutic Cognitive Neuroscience Fund (XJC and RL; Grant Number: 80026224).References
1.Madhavarao, C. N., Arun, P., Moffett, J. R., Szucs, S., Surendran, S., Matalon, R., Garbern, J., Hristova, D., Johnson, A., Jiang, W., & Namboodiri, M. A. (2005). Defective N-acetylaspartate catabolism reduces brain acetate levels and myelin lipid synthesis in Canavan's disease. Proceedings of the National Academy of Sciences of the United States of America, 102(14), 5221–5226.
2.Serrano-Regal, M. P., Luengas-Escuza, I., Bayón-Cordero, L., Ibarra-Aizpurua, N., Alberdi, E., Pérez-Samartín, A., Matute, C., & Sánchez-Gómez, M. V. (2020). Oligodendrocyte Differentiation and Myelination Is Potentiated via GABAB Receptor Activation. Neuroscience, 439, 163–180.
3.Ghisleni, C., Bollmann, S., Poil, S. S., Brandeis, D., Martin, E., Michels, L., O'Gorman, R. L., & Klaver, P. (2015). Subcortical glutamate mediates the reduction of short-range functional connectivity with age in a developmental cohort. The Journal of neuroscience : the official journal of the Society for Neuroscience, 35(22), 8433–8441. https://doi.org/10.1523/JNEUROSCI.4375-14.2015
4.Blüml, S., Wisnowski, J. L., Nelson, M. D., Jr, Paquette, L., Gilles, F. H., Kinney, H. C., & Panigrahy, A. (2013). Metabolic maturation of the human brain from birth through adolescence: insights from in vivo magnetic resonance spectroscopy. Cerebral cortex (New York, N.Y. : 1991), 23(12), 2944–29 https://doi.org/10.1093/cercor/bhs283
5.Porges, E. C., Jensen, G., Foster, B., Edden, R. A., & Puts, N. A. (2021). The trajectory of cortical GABA across the lifespan, an individual participant data meta-analysis of edited MRS studies. eLife, 10, e62575. https://doi.org/10.7554/eLife.62575
6.Oeltzschner, G., Zöllner, H. J., Hui, S., Mikkelsen, M., Saleh, M. G., Tapper, S., & Edden, R. (2020). Osprey: Open-source processing, reconstruction & estimation of magnetic resonance spectroscopy data. Journal of neuroscience methods, 343, 108827.
7.Provencher S. W. (2001). Automatic quantitation of localized in vivo 1H spectra with LCModel. NMR in biomedicine, 14(4), 260–264. https://doi.org/10.1002/nbm.698
8.Lin A, Andronesi O, Bogner W, Choi IY, Coello E, Cudalbu C, Juchem C, Kemp GJ, Kreis R, Krššák M, Lee P, Maudsley AA, Meyerspeer M, Mlynarik V, Near J, Öz G, Peek AL, Puts NA, Ratai EM, Tkáč I, Mullins PG; Experts' Working Group on Reporting Standards for MR Spectroscopy. Minimum Reporting Standards for in vivo Magnetic Resonance Spectroscopy (MRSinMRS): Experts' consensus recommendations. NMR Biomed. 2021 May;34(5):e4484. doi: 10.1002/nbm.4484. Epub 2021 Feb 9. PMID: 33559967; PMCID: PMC8647919
Figures
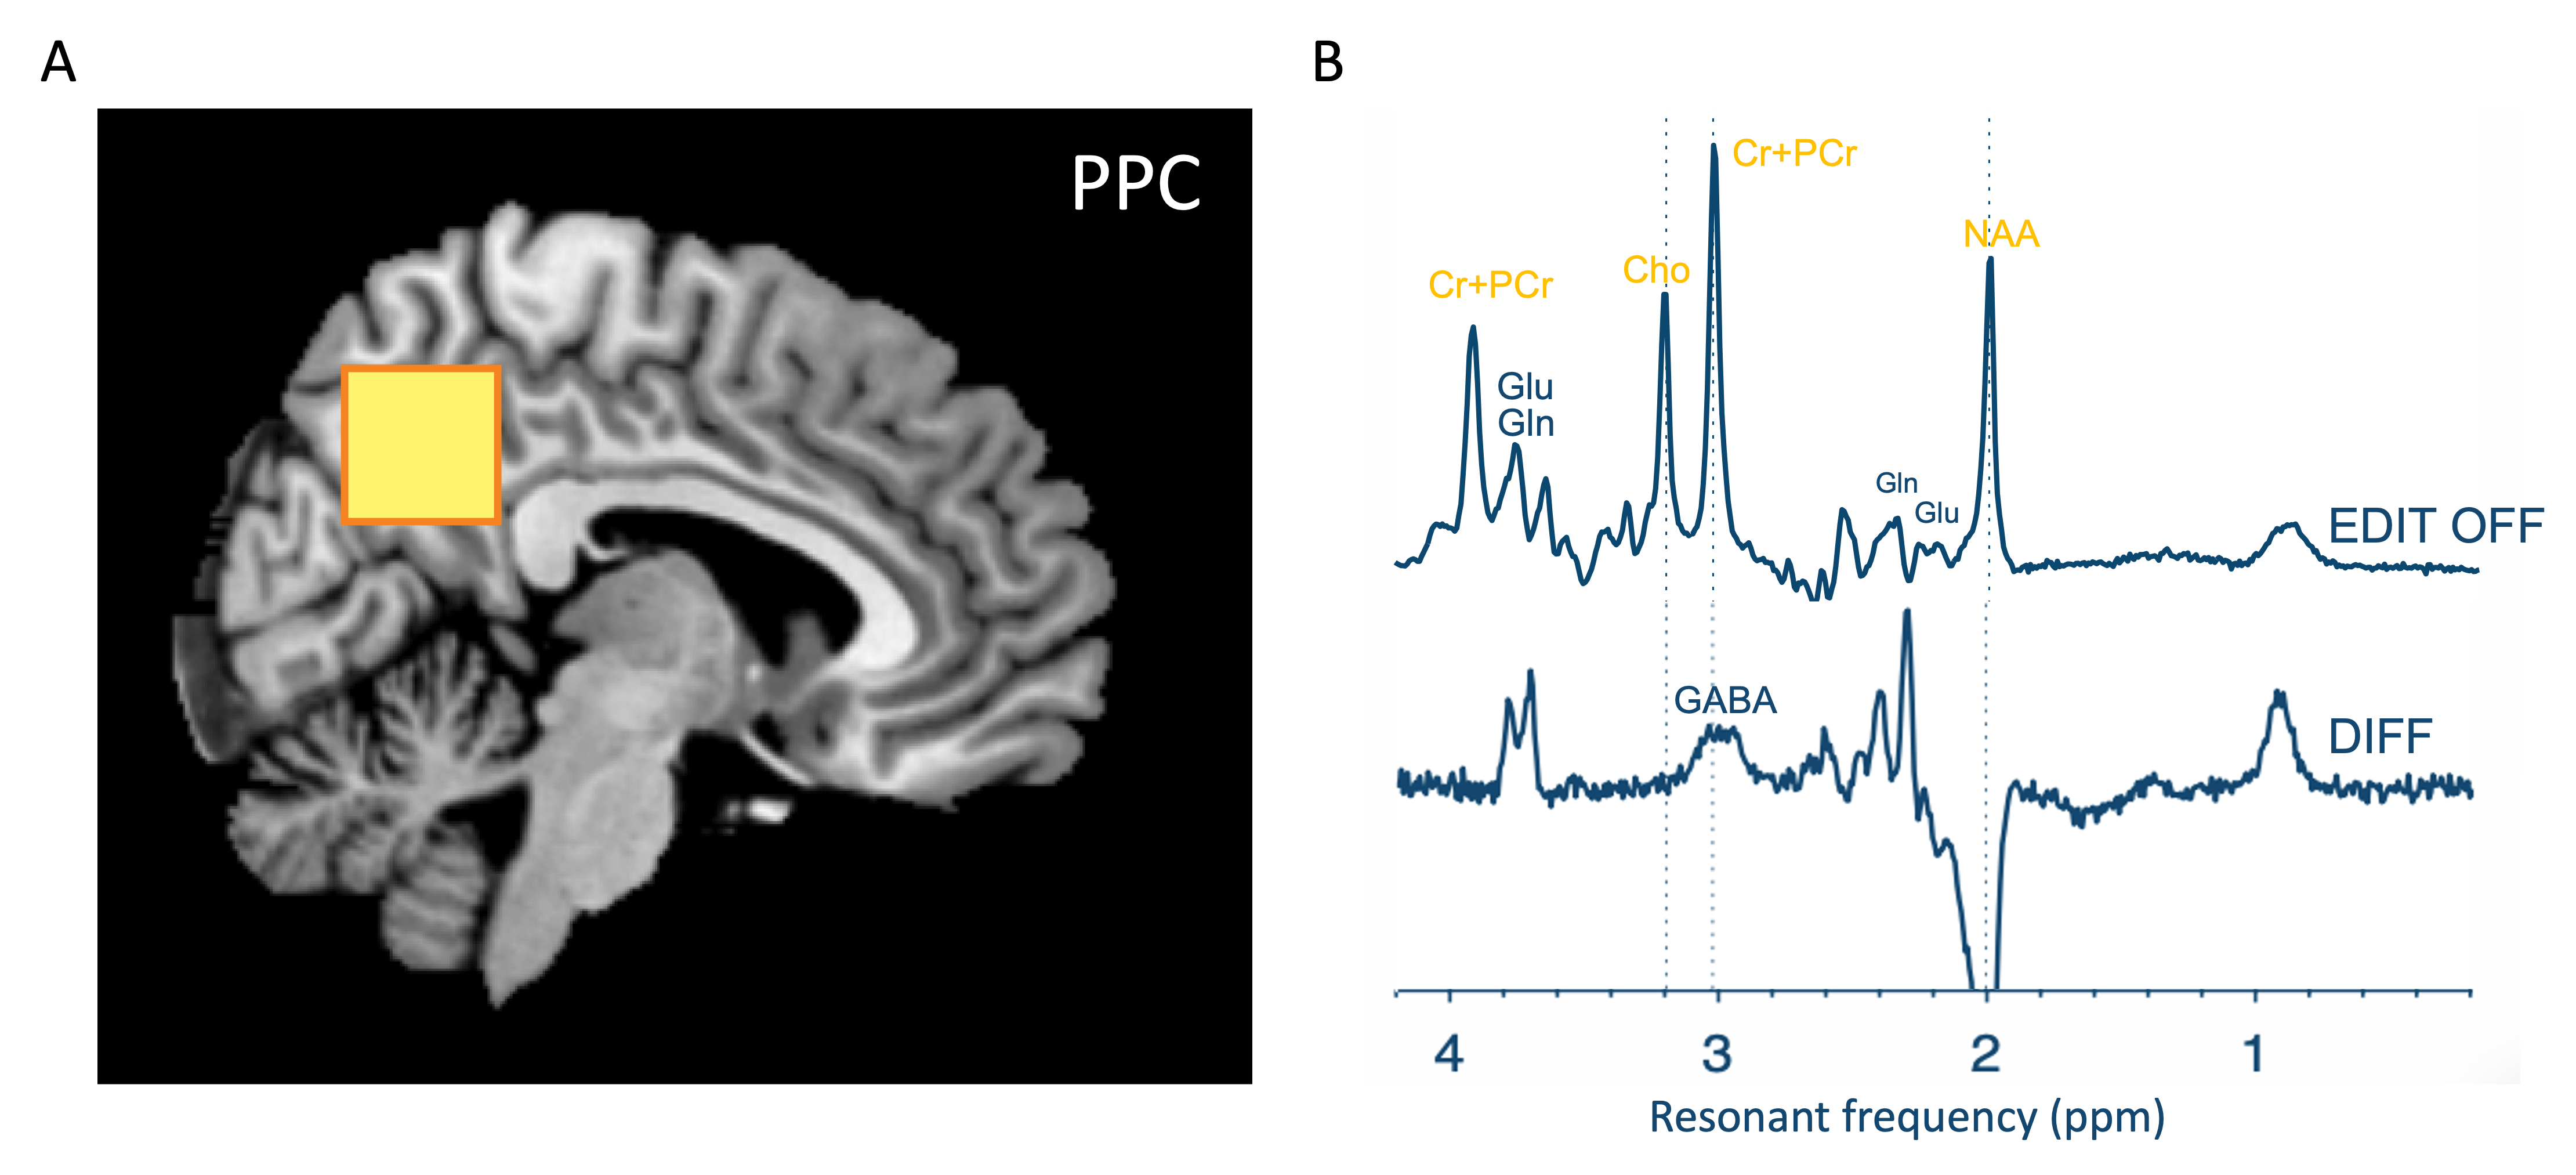
Figure 1. (A) A voxel was placed over the posterior parietal cortex (27ml) for acquisition of in vivo MRS spectra from 100 participants across a 40-year age range. (B) MEGA-PRESS was used to resolve GABA. EDIT-OFF spectrum models non-edited metabolites such as choline-containing compounds, creatine, and NAA. Difference (DIFF) spectrum reveals edited metabolites (e.g.GABA) and in this figure is inflated as these are low-concentration signals.
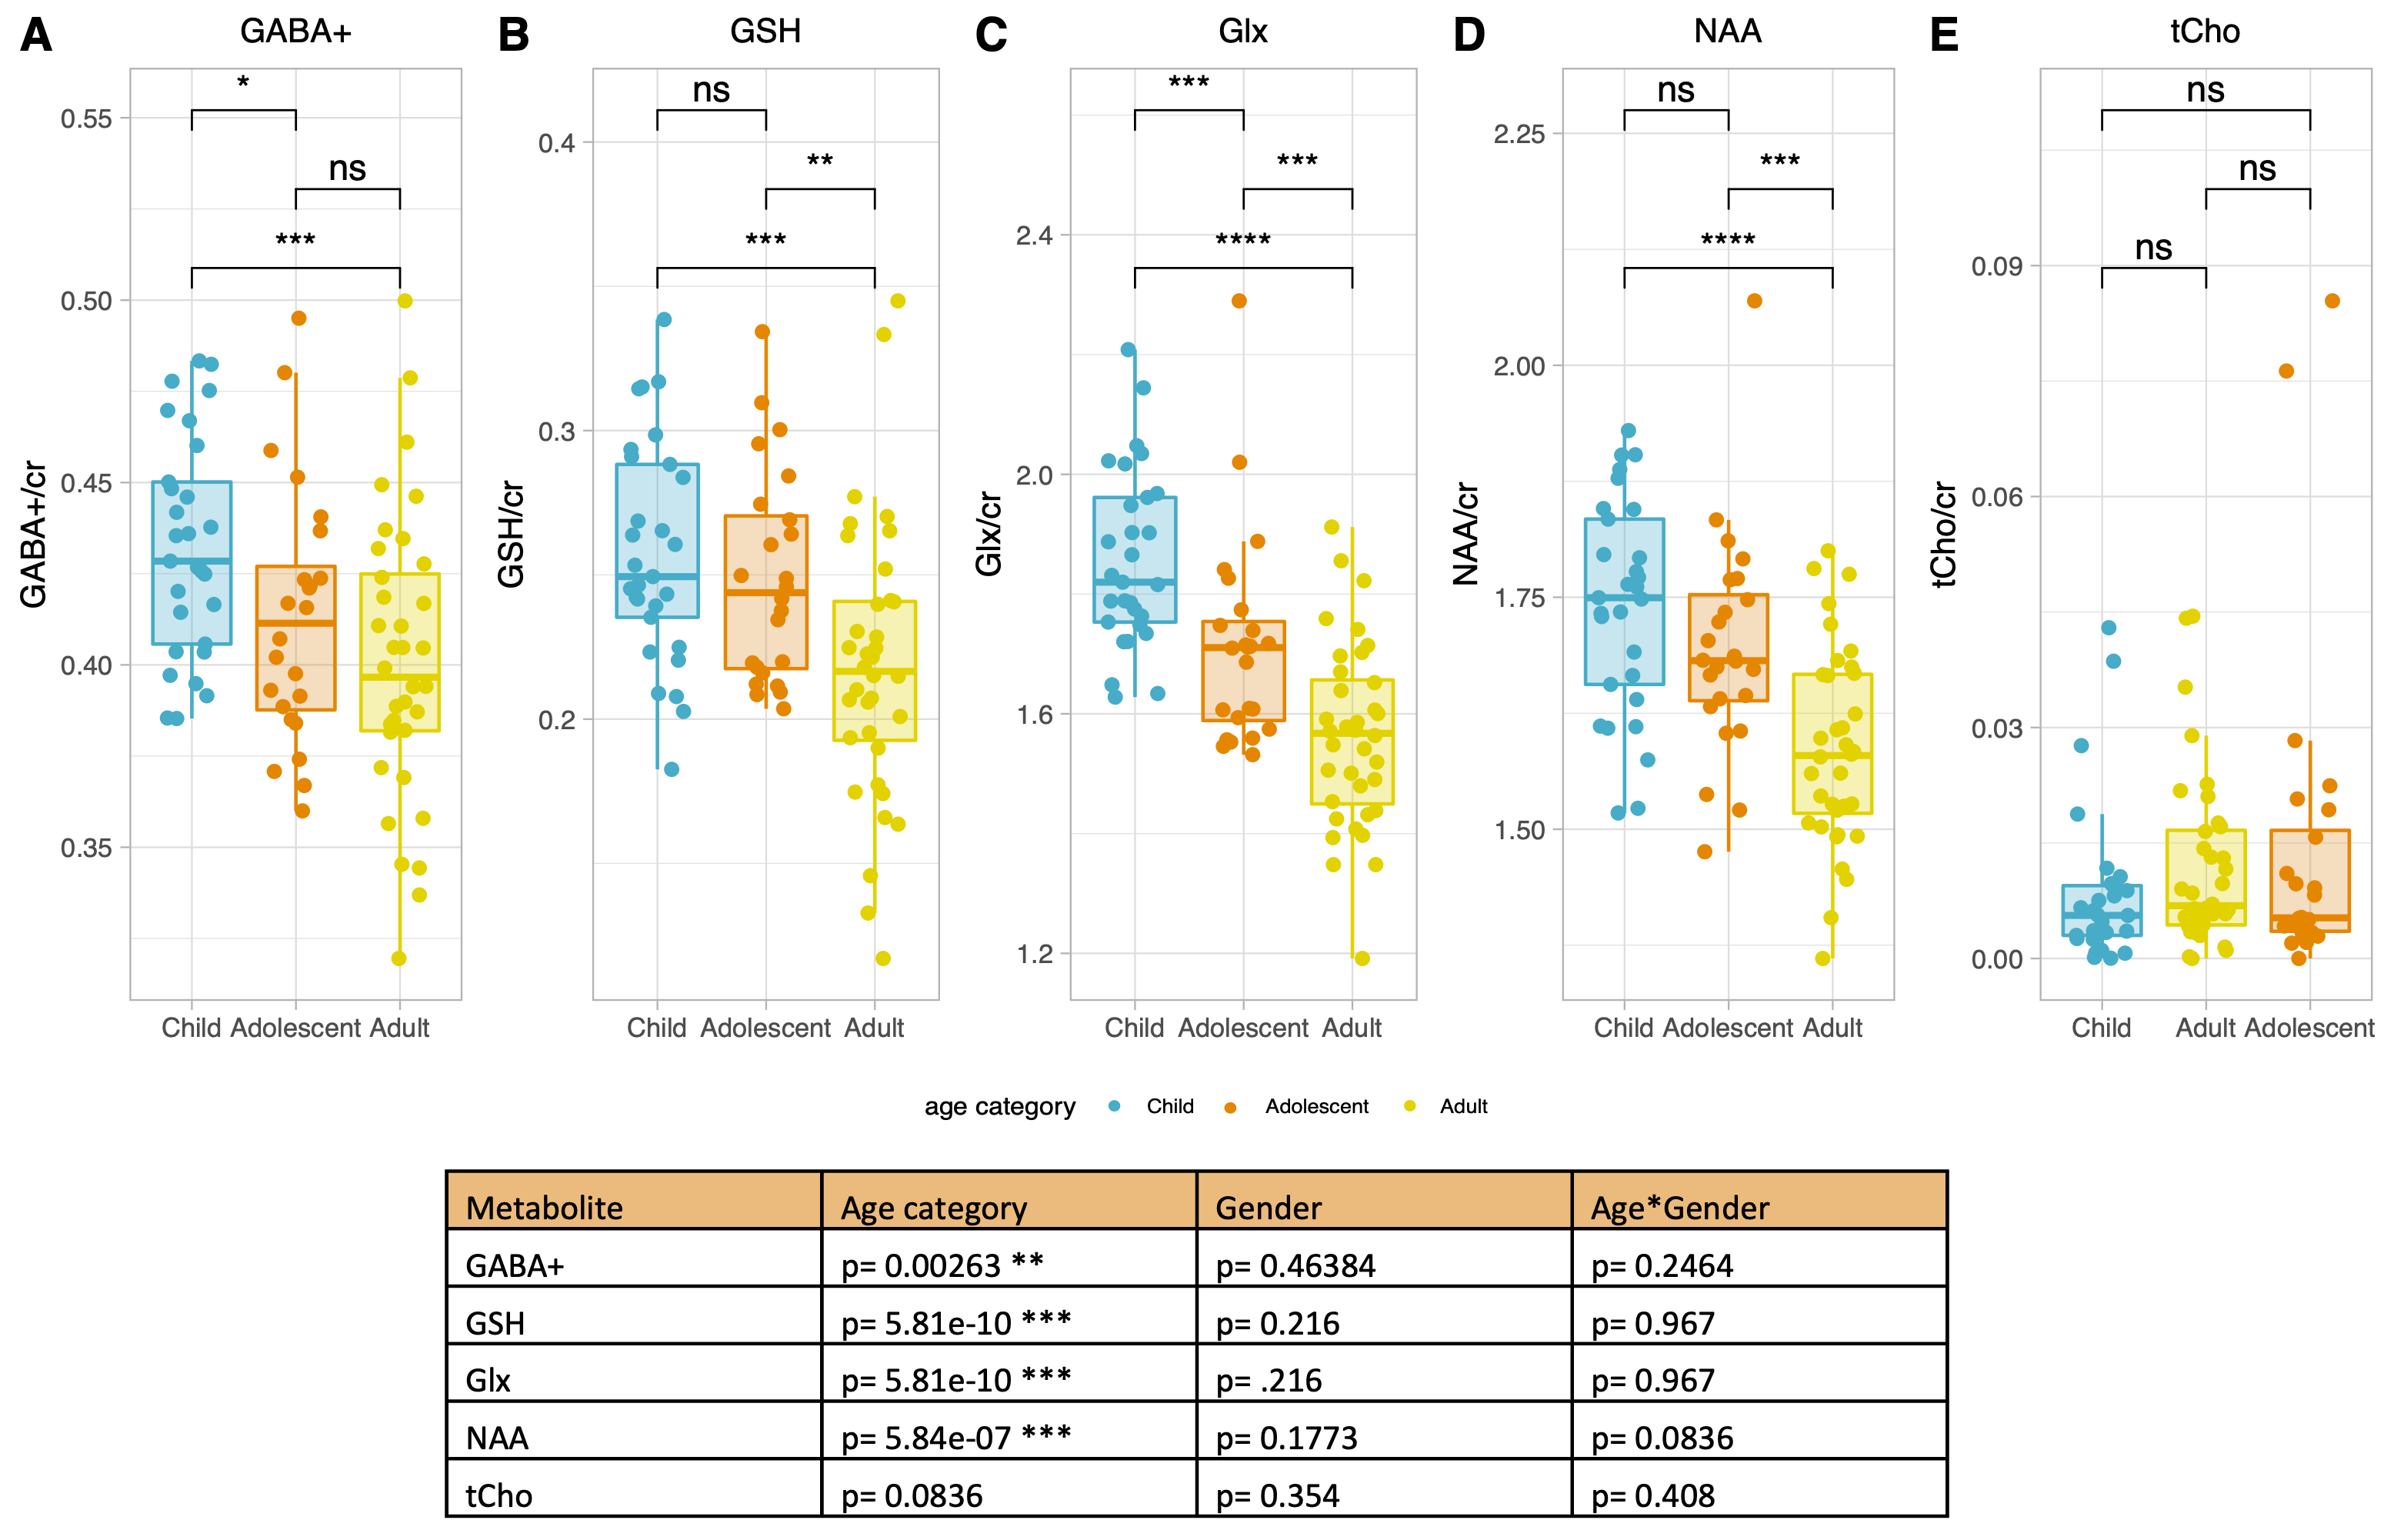
Figure 2. Table shows example p values obtained from ANCOVA’s to test for interaction between age and/or gender on metabolite concentrations (creatine scaled). Age had a significant main effect on all metabolites excluding choline.
(A-E) Tukey post-hoc correction was used to isolate significant differences in neurometabolite concentrations between age groups for creatine scaled data. *P<0.05, **P<0.005, ***P<0.001, ****P<0.0001.
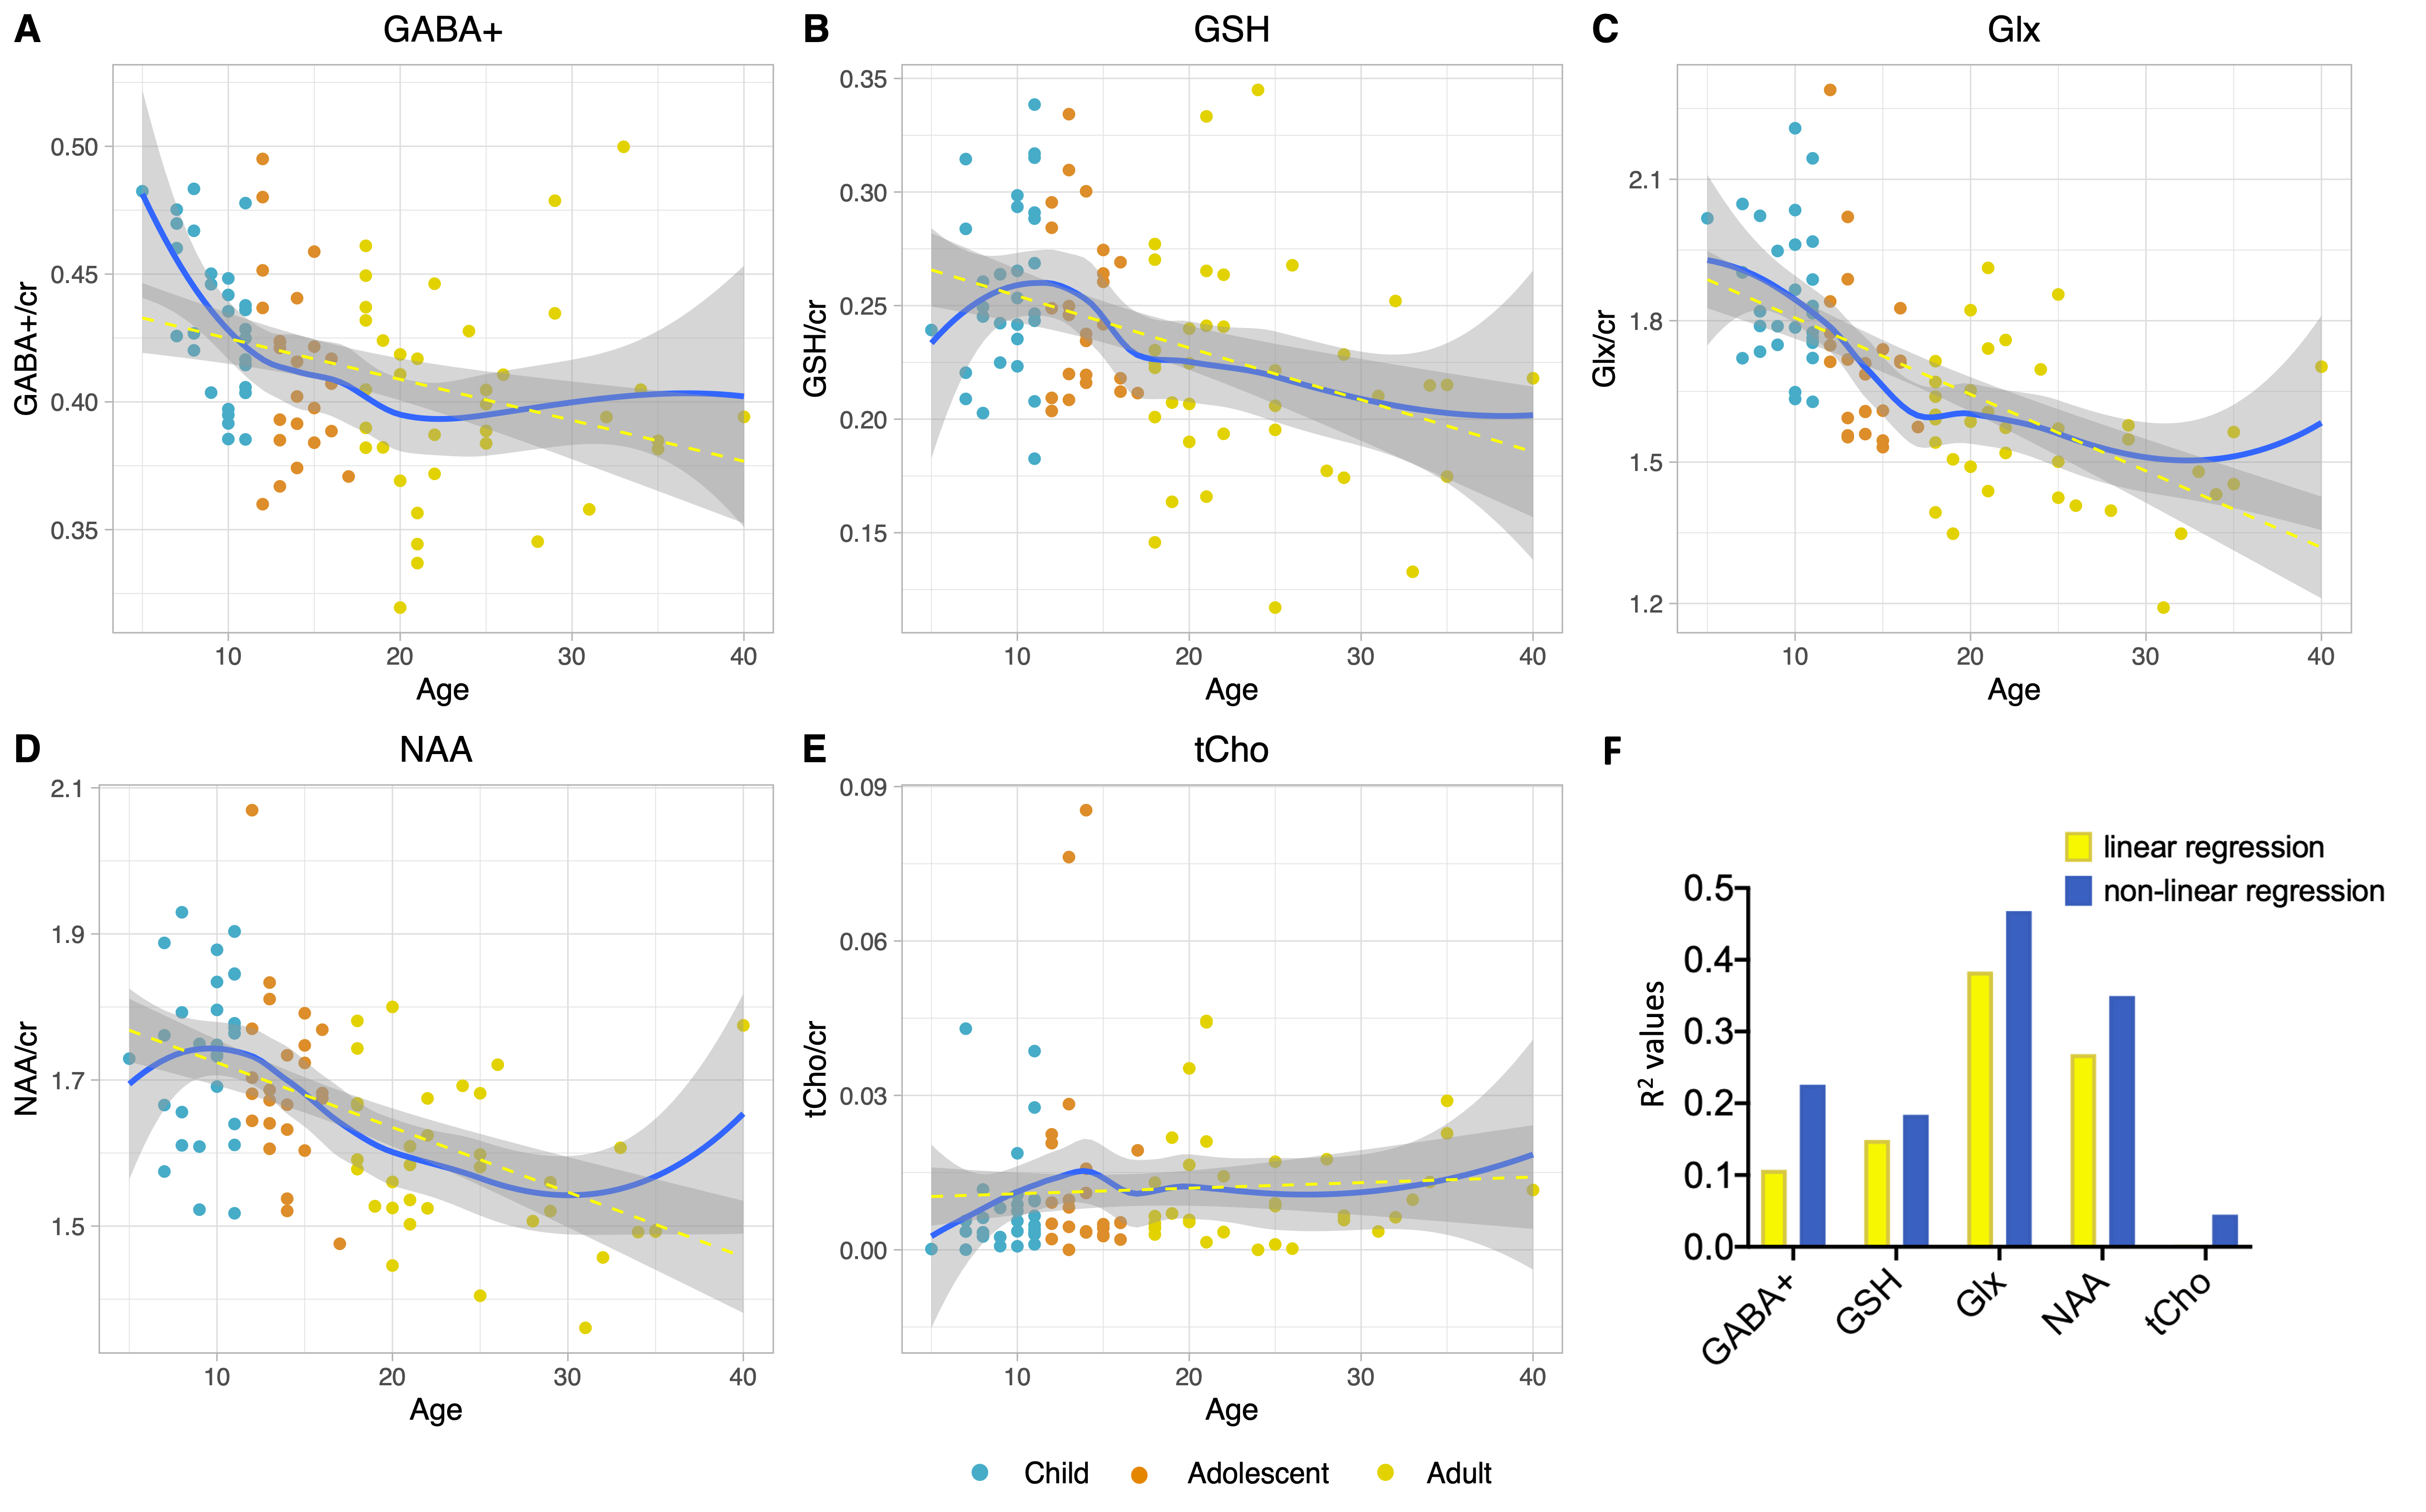
Figure 3. (A-E) Linear (yellow) and non-linear (LOESS; blue) regression modelling of creatine-scaled neurometabolite concentrations across the lifespan, with fit residuals and age as covariates. (F) R2 values obtained from linear regression and pseudo R2 values obtained from non-linear (LOESS) regression for creatine scaled data. The same results were obtained for water referenced data (not shown).
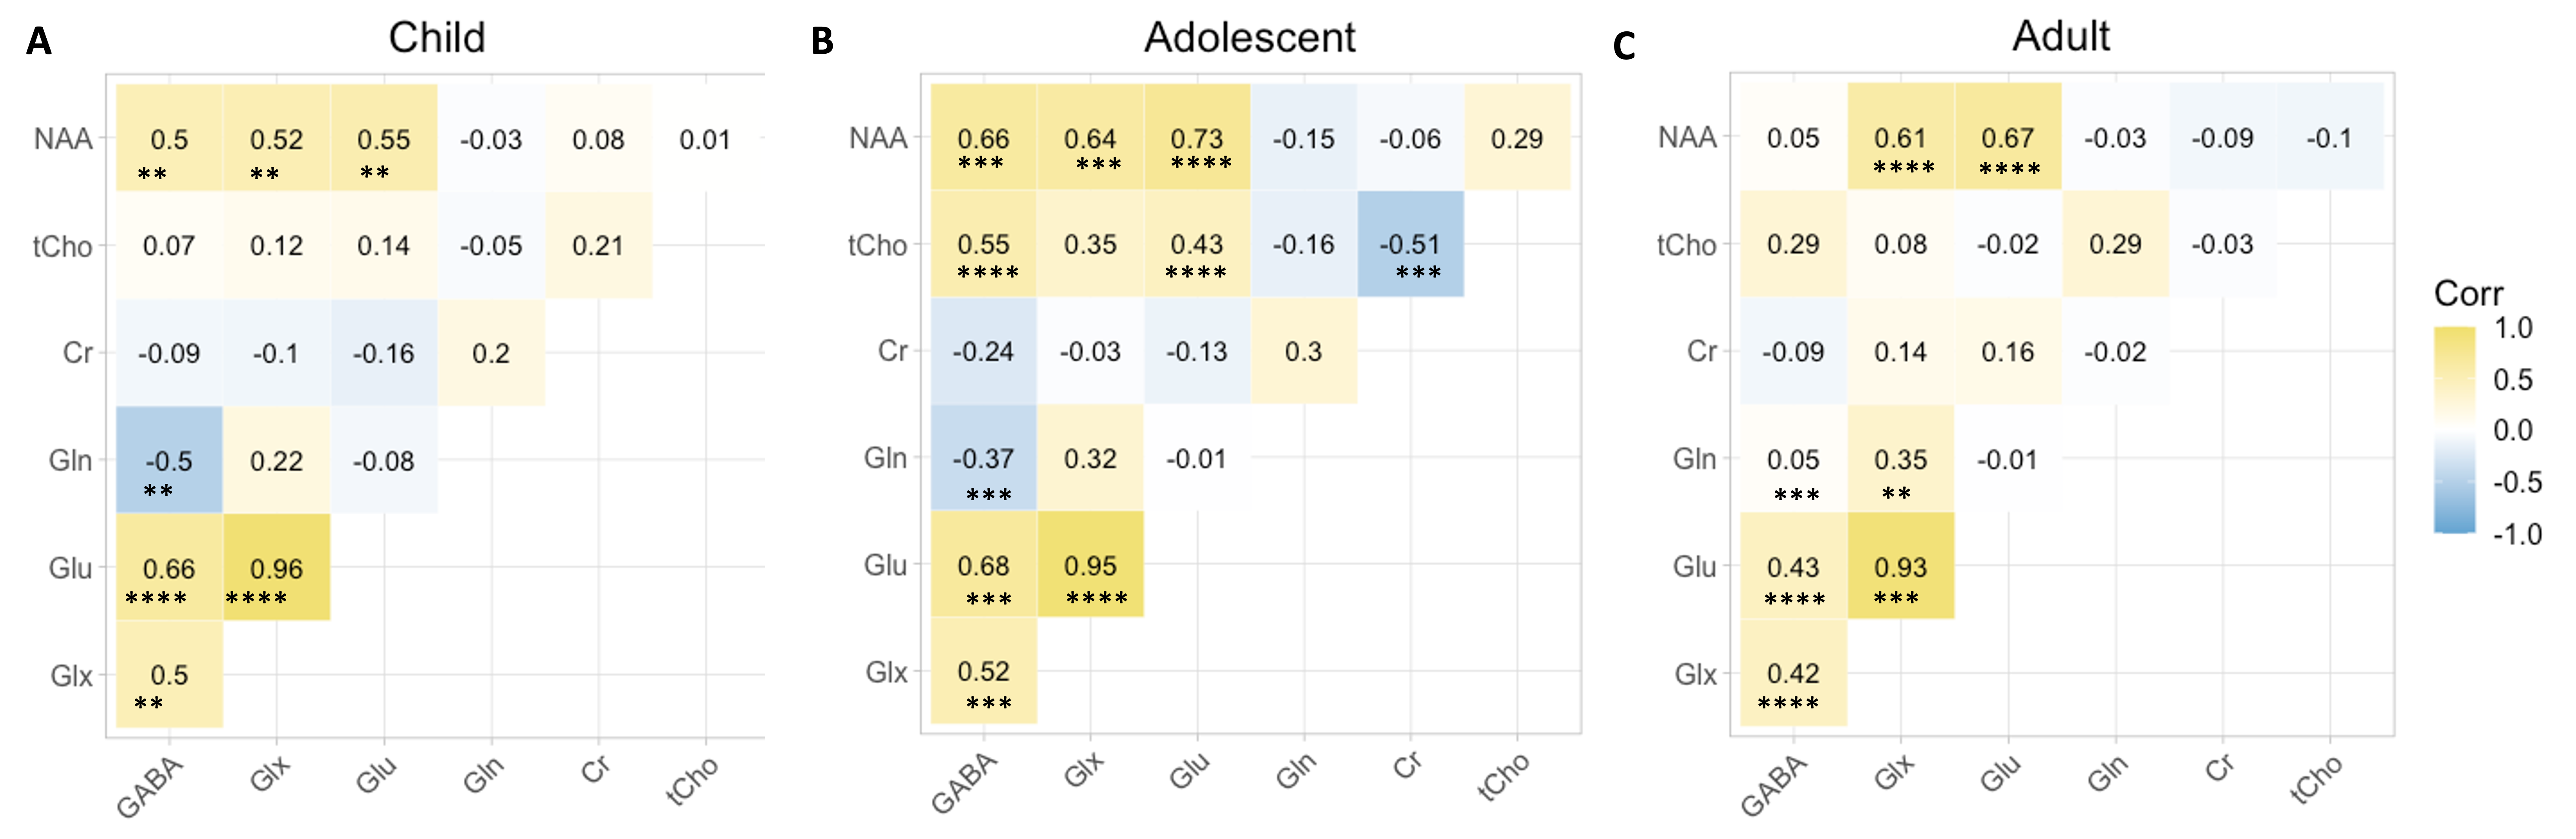
Figure 4. Correlation matrices show neurometabolite interactions (creatine-scaled) for each age group. Yellow =positive correlation, blue = negative correlation and white = no correlation. Pearson correlation coefficients (r) and significance of p values are shown; *P<0.05, **P<0.005, ***P<0.001, ****P<0.0001.
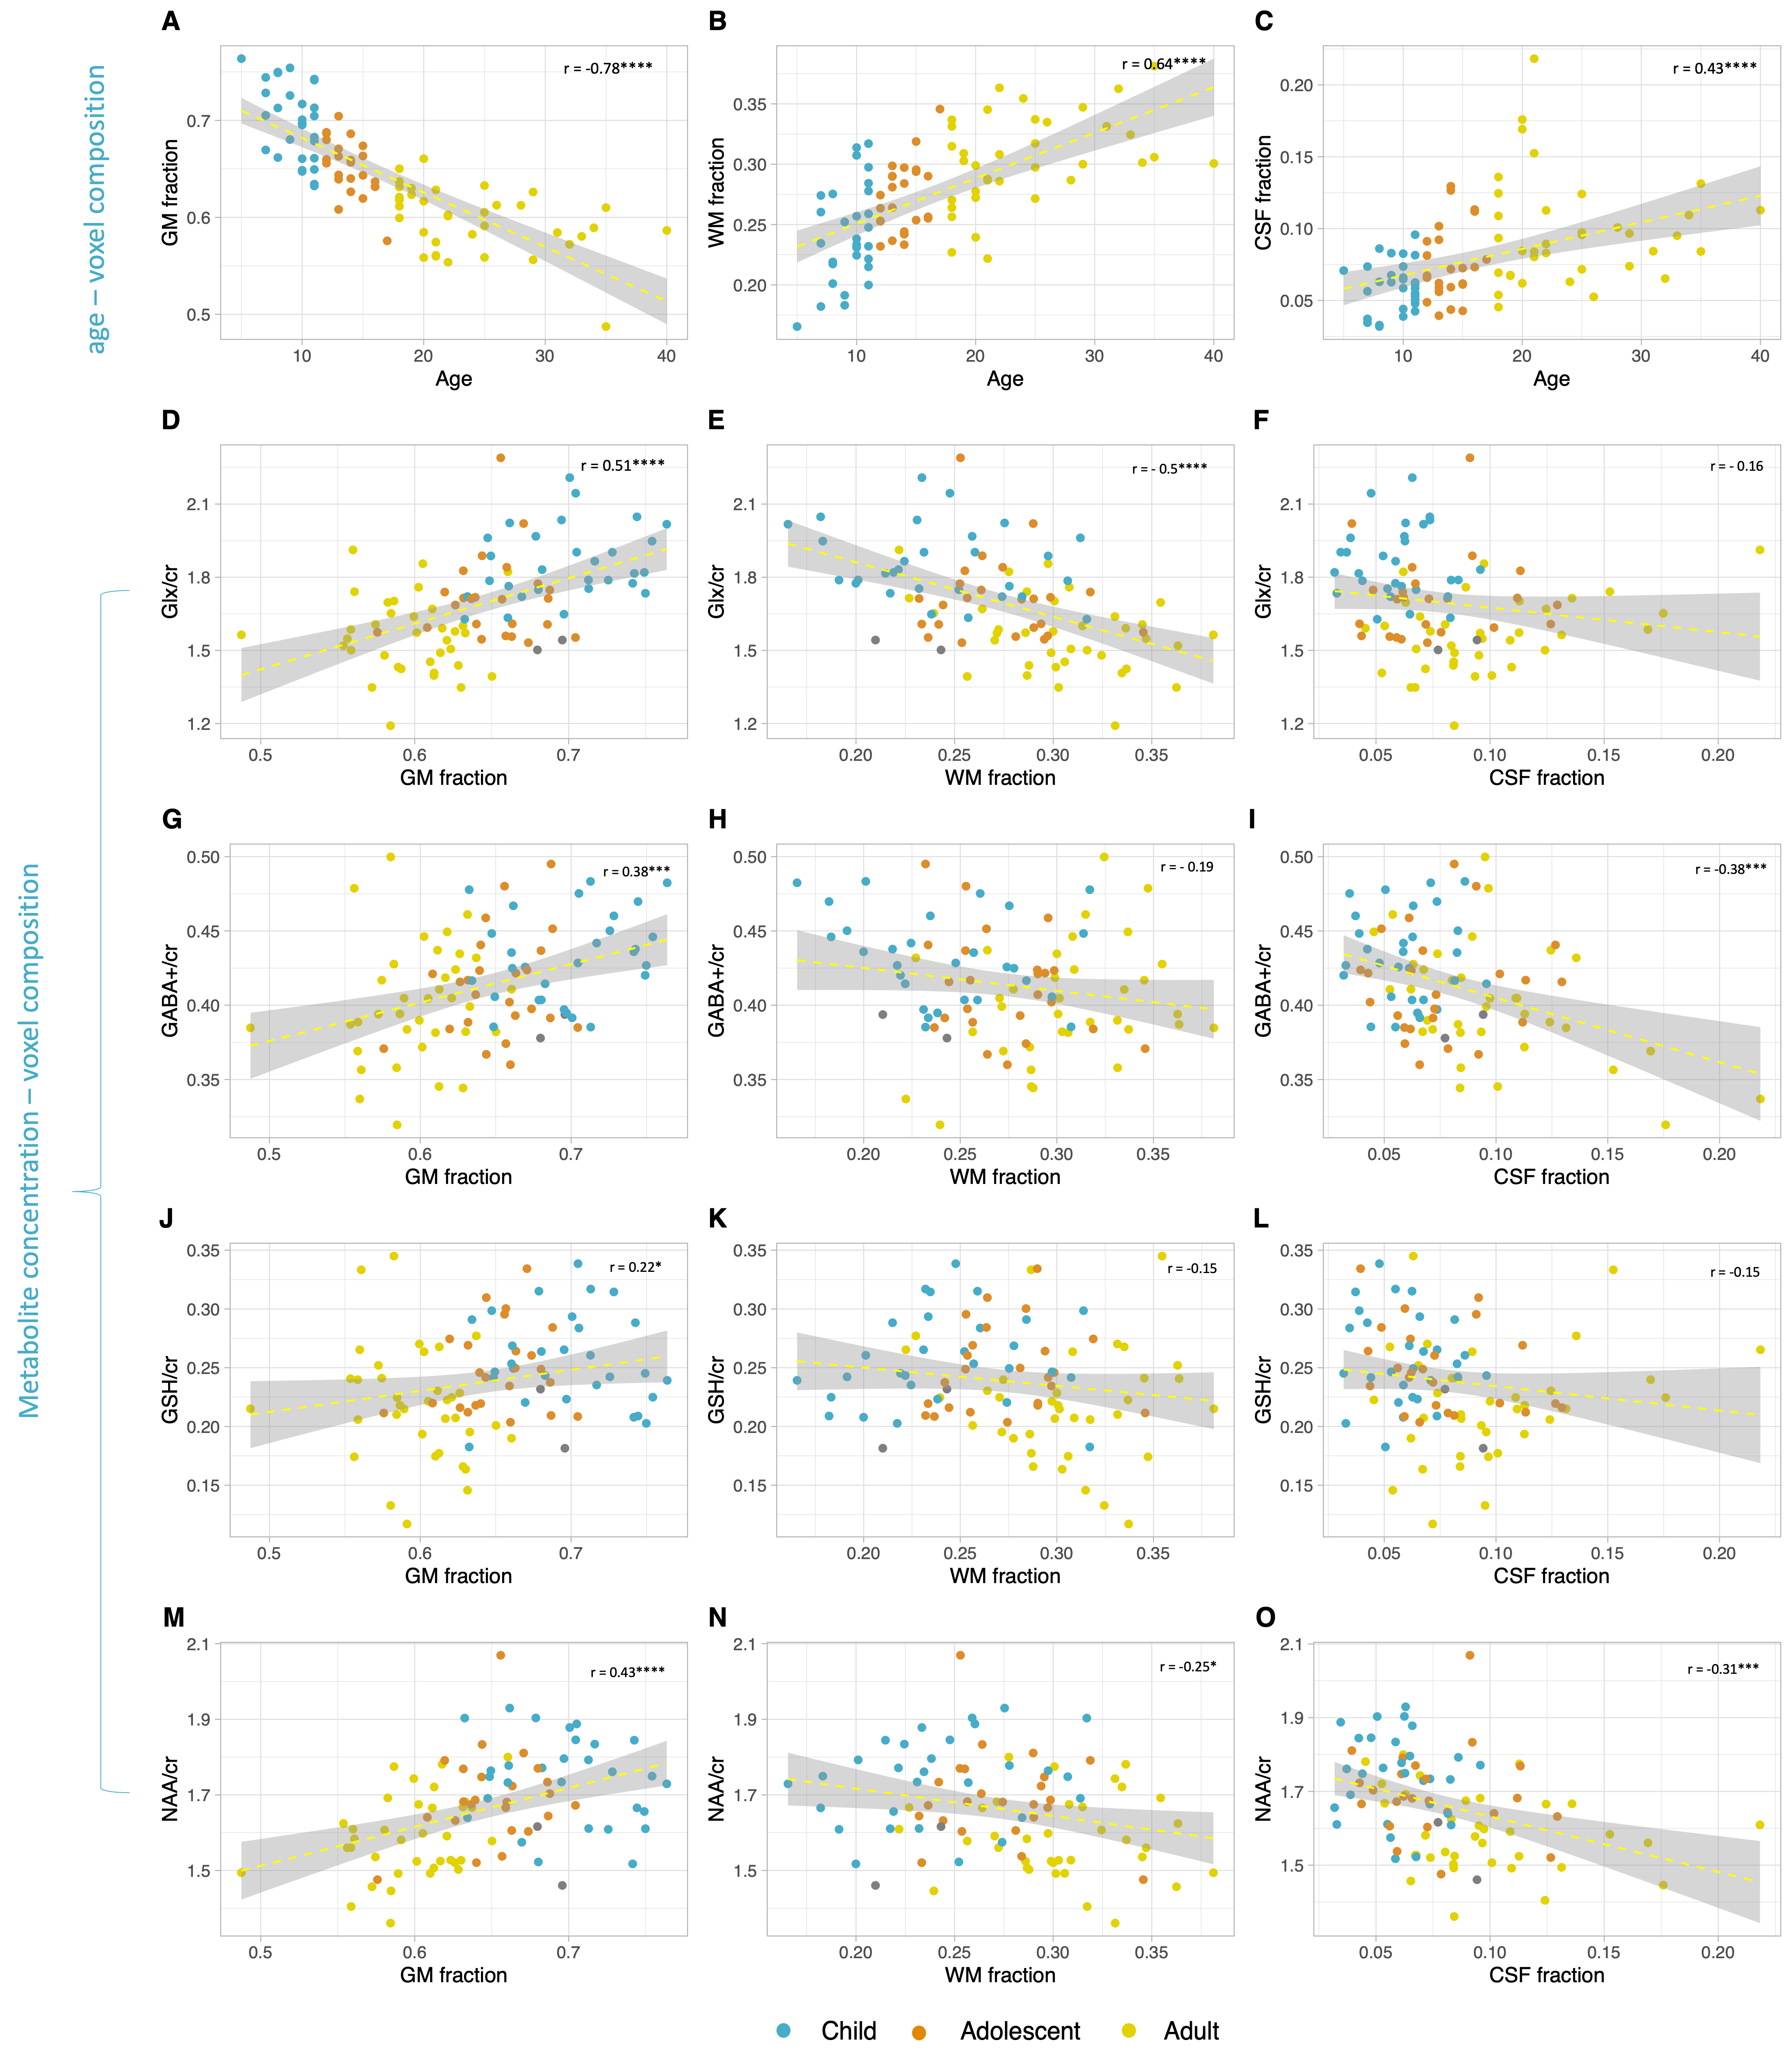
Figure 5. The relationship between gray matter (GM), white matter (WM) and cerebrospinal fluid (CSF) fractions in the PPC voxel and (A-C) age or (D-O) neurometabolite concentrations (creatine scaled). Pearson correlation coefficient (r) and significance of p values are shown. For tCho no significant correlations were observed. * P<0.05, ** P<0.005, ***P<0.001, ****P<0.0001.