5314
Comparison of brain quantitative susceptibility mapping between preterm and full-term newborns1Weill Cornell Medicine, New York, NY, United States
Synopsis
Keywords: Neonatal, Quantitative Susceptibility mapping
Quantitative susceptibility mapping (QSM) is an emerging technique and may be utilized to assess neurodevelopmental disabilities characterized by insufficient iron content and myelination. In this study, a total of 23 full-term and 12 preterm newborns were studied using QSM. Compared to full-term, mean regional susceptibility of preterm newborns was significantly higher in the parietal white matter and was significantly lower in the frontal gray matter. This may be indicative of a regional deficit in iron deposition and myelination of the preterm newborn brain, and suggest that QSM may be used to identify early evidence of impaired neurodevelopment.Introduction
Quantitative susceptibility mapping (QSM) is a relatively new technique for investigating tissue composition, and may be used to evaluate neurodevelopment characterized by progression of iron deposit and myelination. While the technique has been applied in healthy full-term infants and those born preterm1-4, there is currently a lack of studies comparing susceptibilities between preterm and full-term infants, particularly in the early postnatal period. The purpose of the present study is to compare magnetic susceptibilities of the brain between preterm and full-term newborns, which may reflect the neurodevelopmental impairment in infants born preterm.Methods
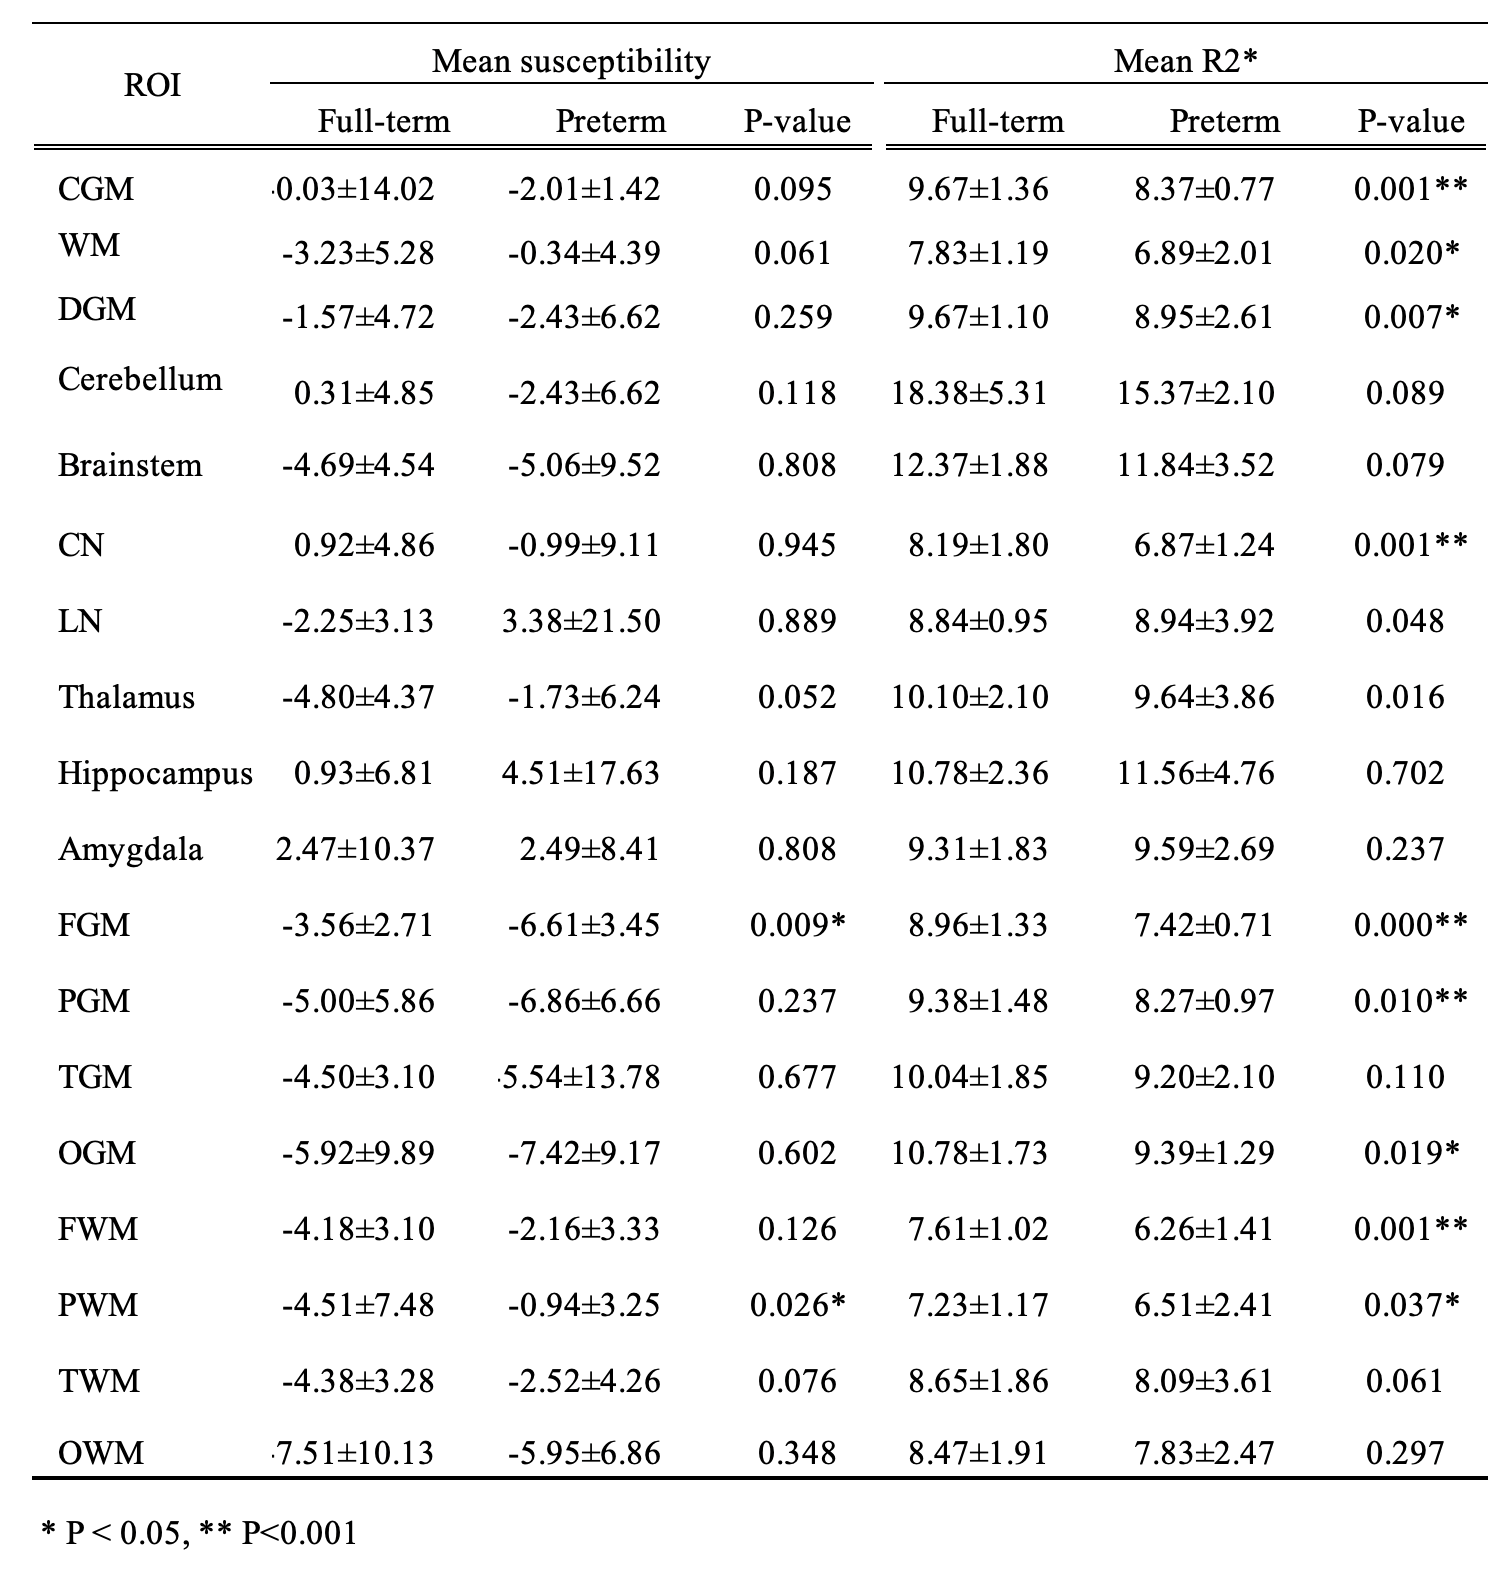
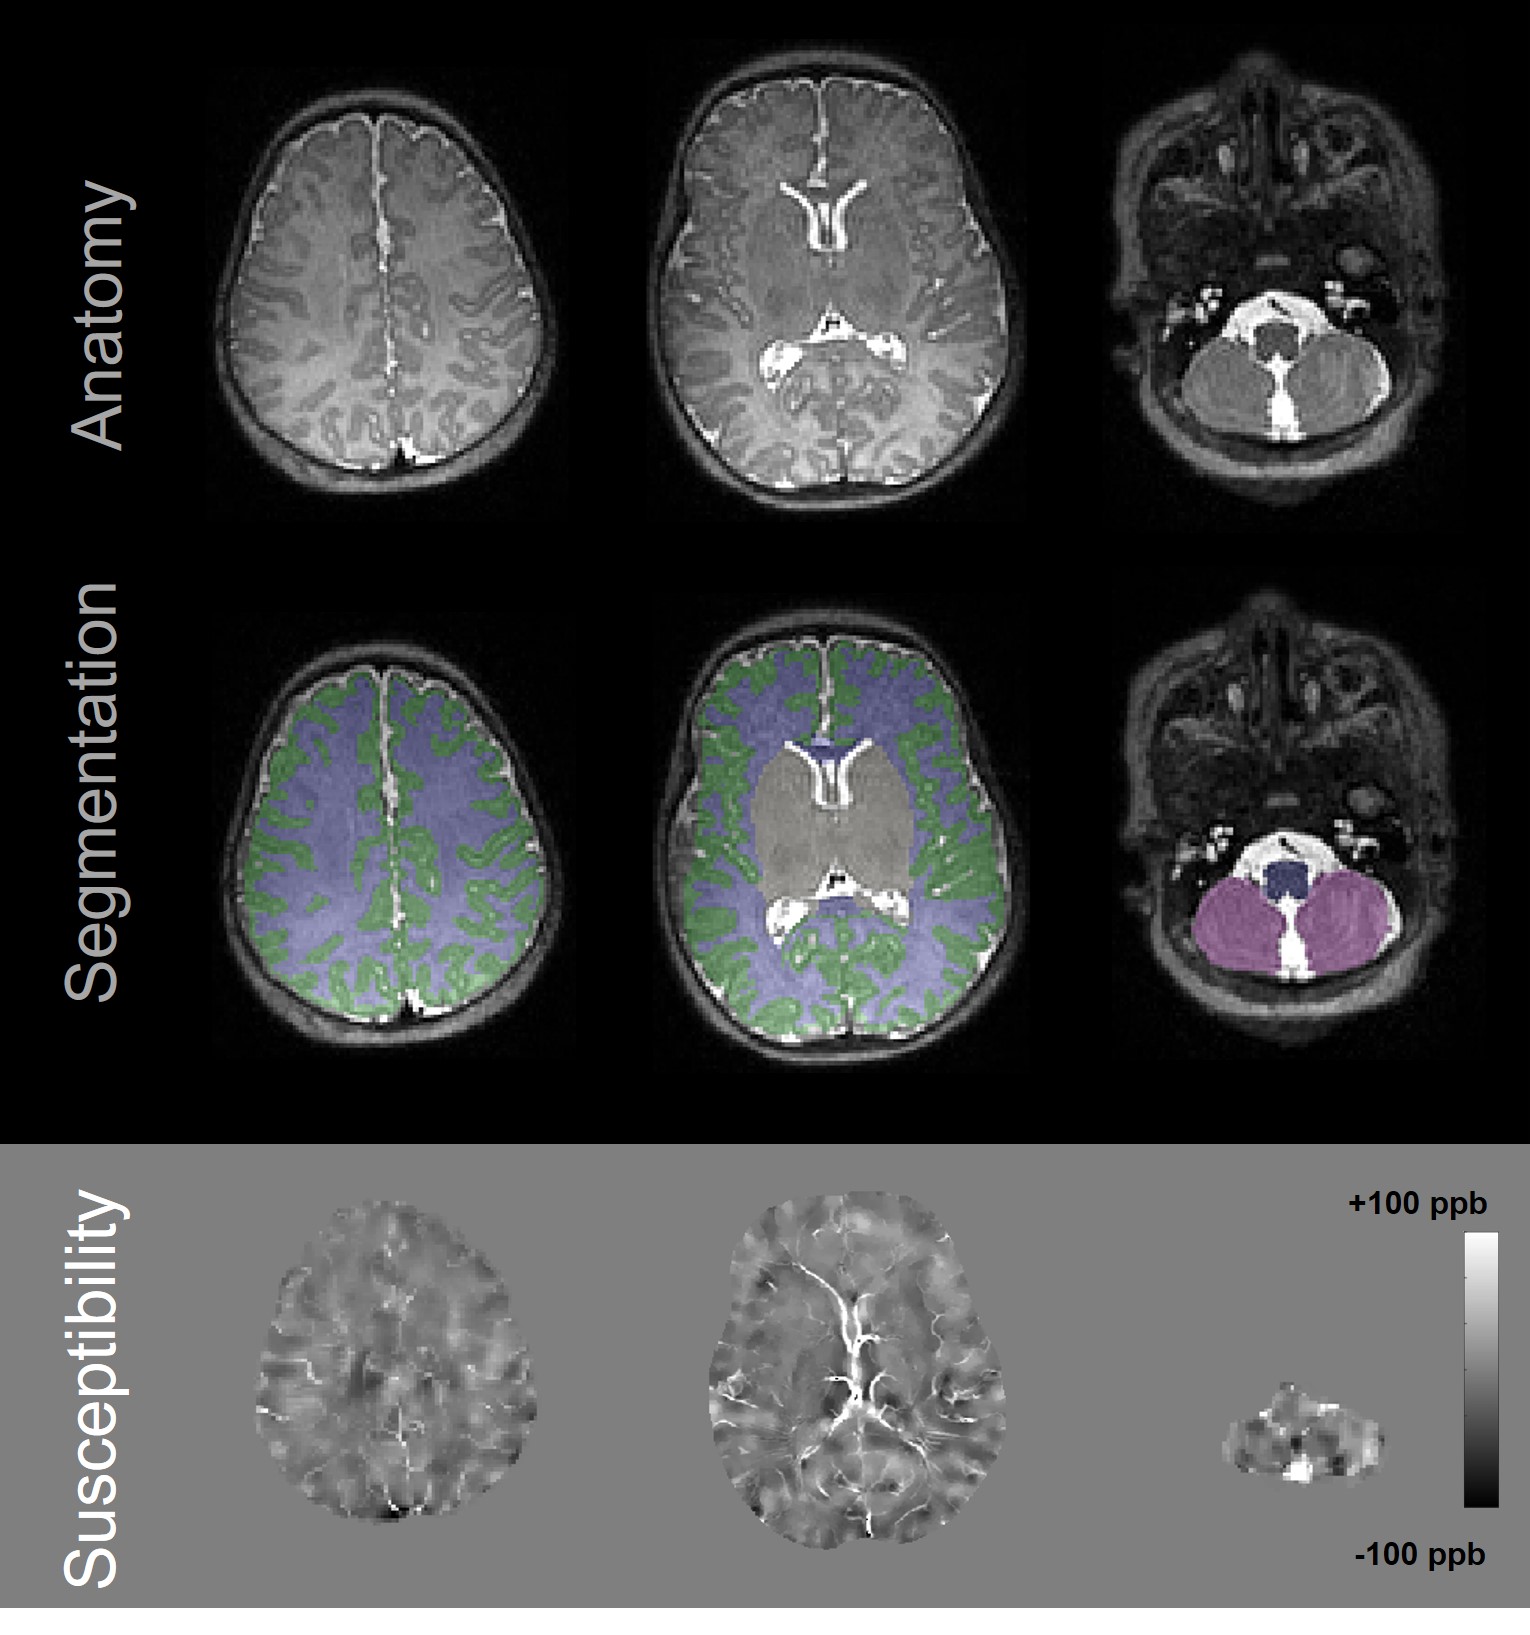
In this retrospective study approved by our institutional review board, newborns who underwent MRI within the first two months of life between April 2012 and September 2020 were included. Inclusion criterion for preterm infants was gestational age at birth less than 37 weeks. MRI scans were performed on GE (GE Healthcare, Waukesha, WI, USA) or Siemens scanners (Siemens Healthcare, Erlangen, Germany), both at 3 T. For QSM, 3D multi-echo gradient echo (GRE) imaging was performed. Imaging parameters included TR of 44-82 ms, longest TE of 33-62 ms, matrix size of 256x256x40x-416x320x104, and slice thickness of 2-3 mm. Total scan time of 3D GRE was approximately 4-5 min. T2-weighted anatomical images were acquired using 3D fast spin echo sequences. QSM reconstruction was performed using the morphological enabled dipole inversion (MEDI) algorithm5-6 and R2* was measured using the fast monoexponential fitting algorithm based on auto-regression on linear operations7. Brain tissue segmentation was performed using Draw-EM to generate following regions-of-interest (ROIs): cortical gray matter (CGM), white matter (WM), deep gray matter (DGM), cerebellum, brainstem, frontal gray matter (FGM), occipital gray matter (OGM), temporal gray matter (TGM), parietal gray matter (PGM), frontal white matter (FWM), occipital white matter (OWM), temporal white matter (TWM), parietal white matter (PWM), thalamus, hippocampus, amygdala, caudate nucleus (CN), and lentiform nucleus (LN). Susceptibility and R2* maps were registered to anatomical images using ANTs. An example of segmentation and registration is illustrated in Figure 1. Mean susceptibility and R2* were measured within each ROI of infant. Pearson’s correlation coefficients were calculated to examine associations of mean susceptibility or R2* with postmenstrual age (PMA) at MRI. The differences in mean susceptibility and R2* values between full-term and preterm newborns were assessed using the Mann-Whitney U test. No adjustments were made for multiple comparisons as we considered this study to be exploratory and hypothesis-generating.Results
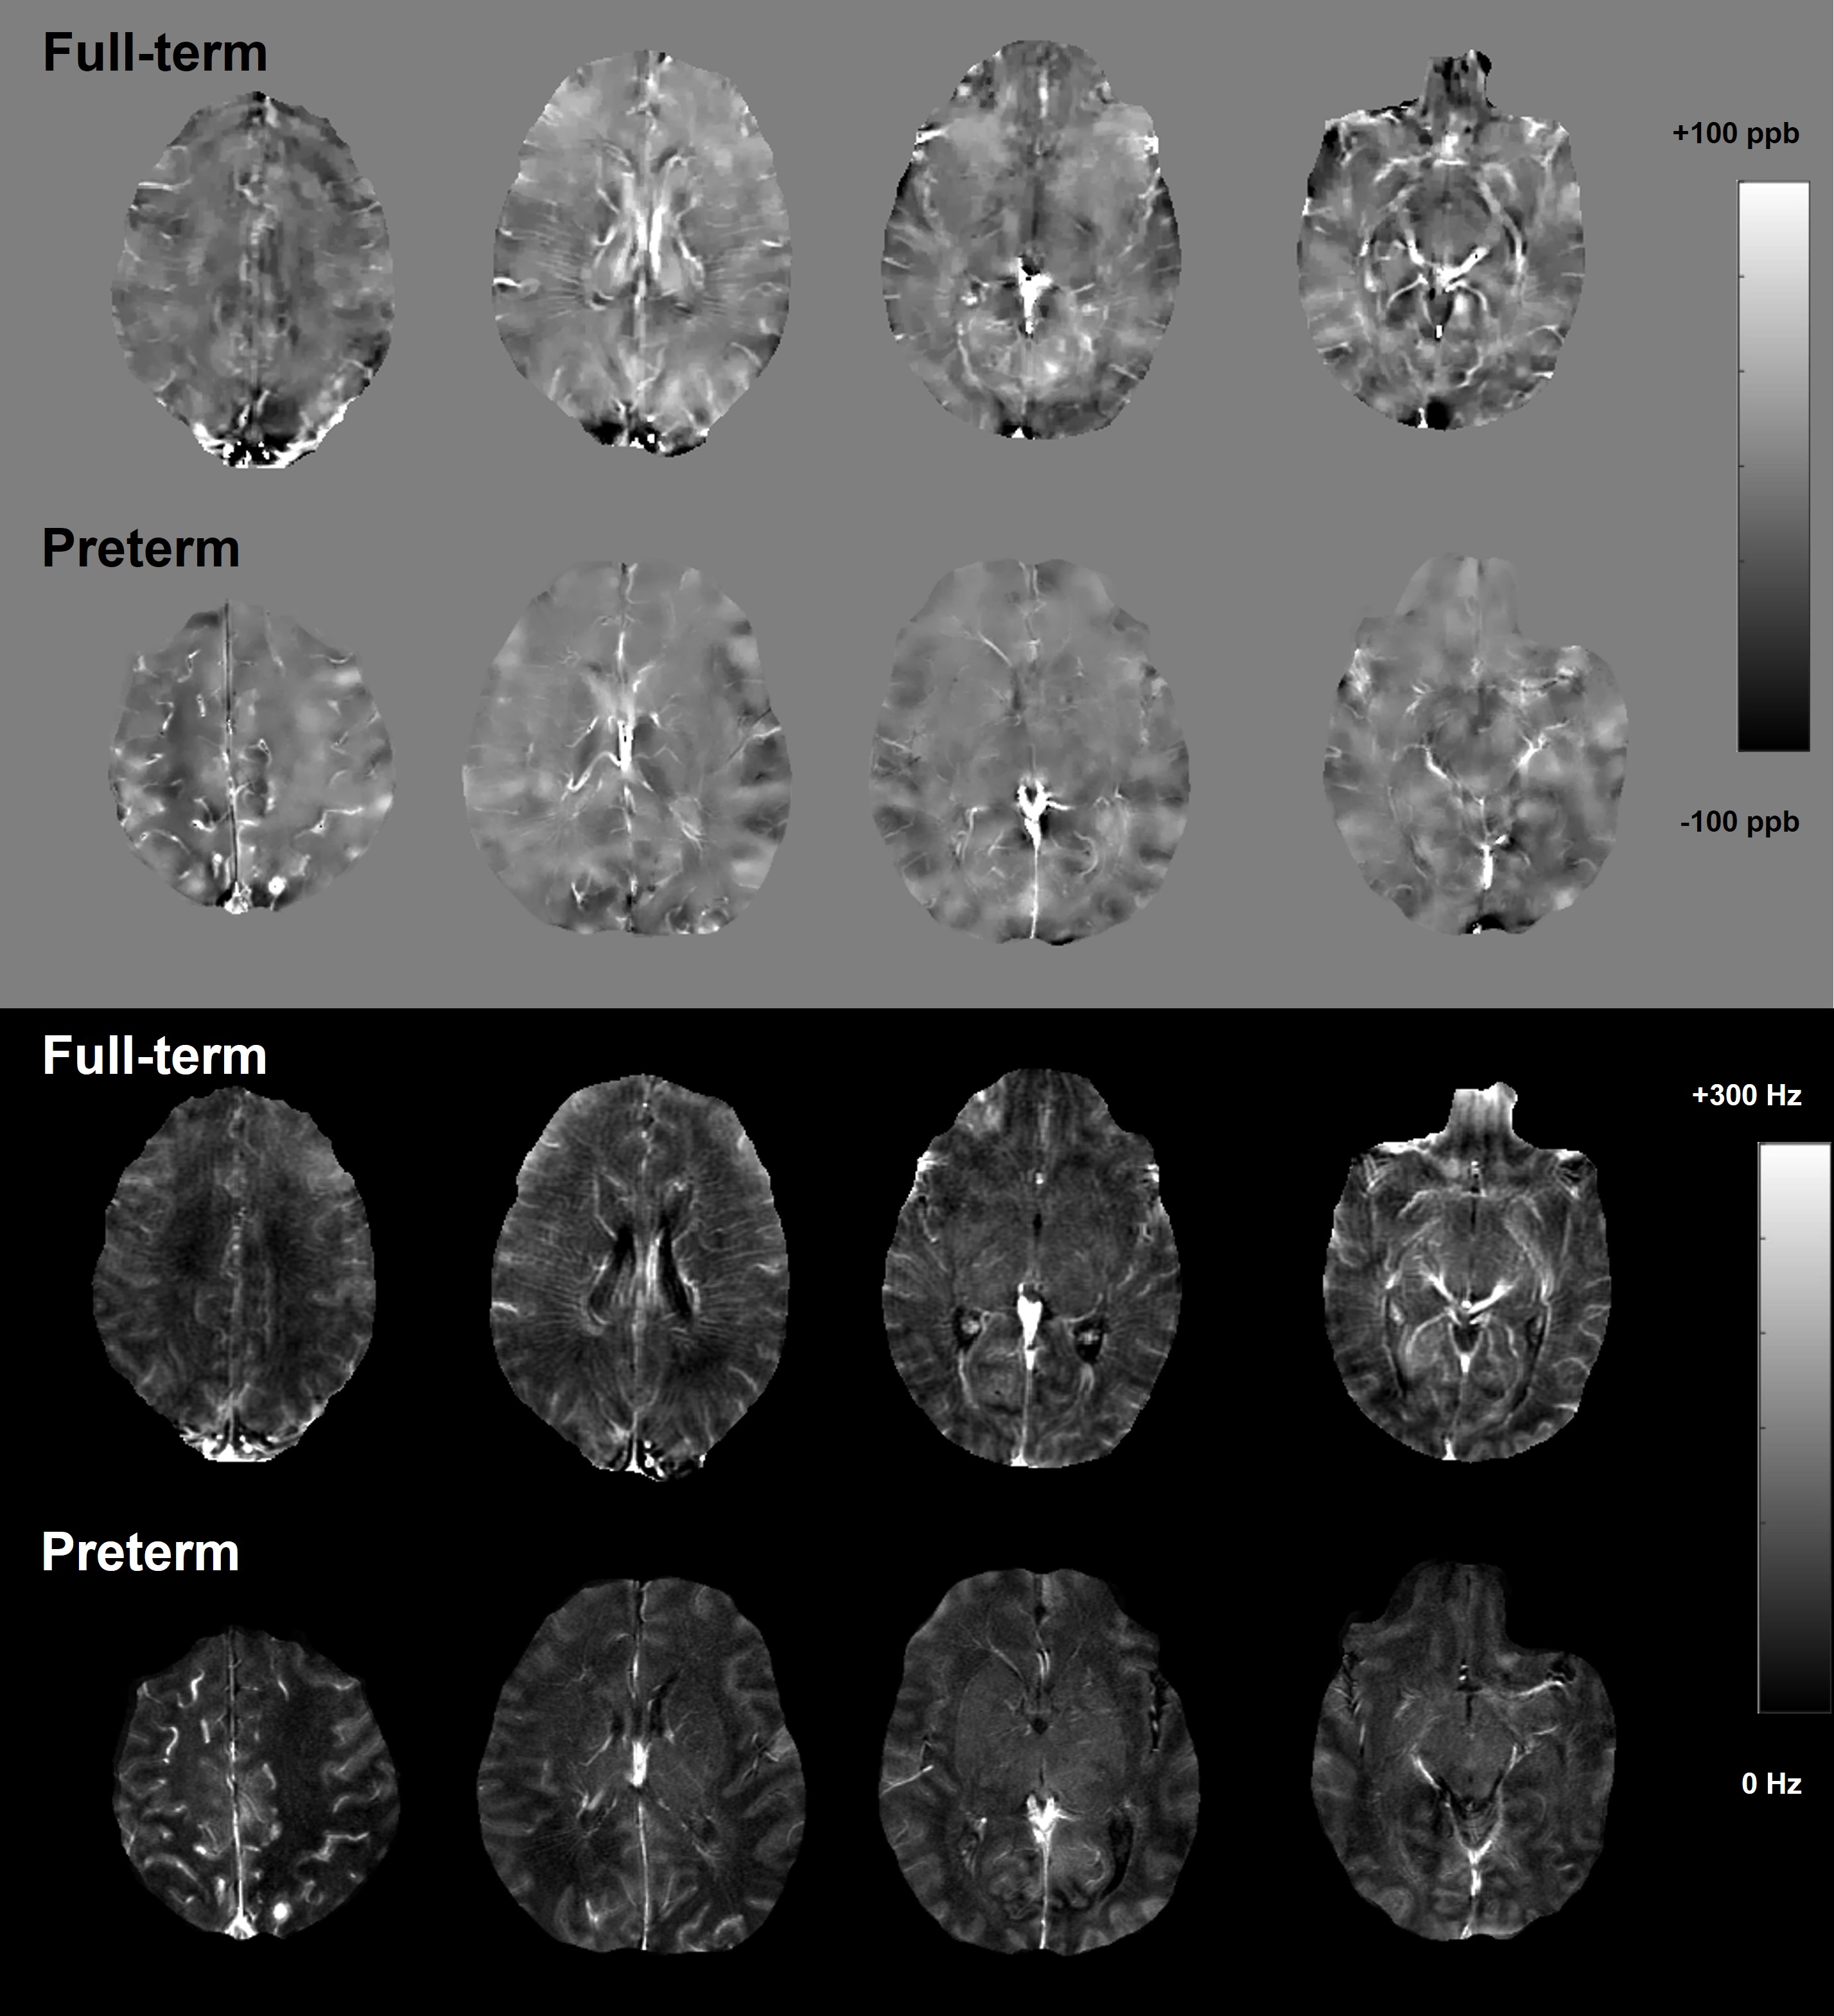
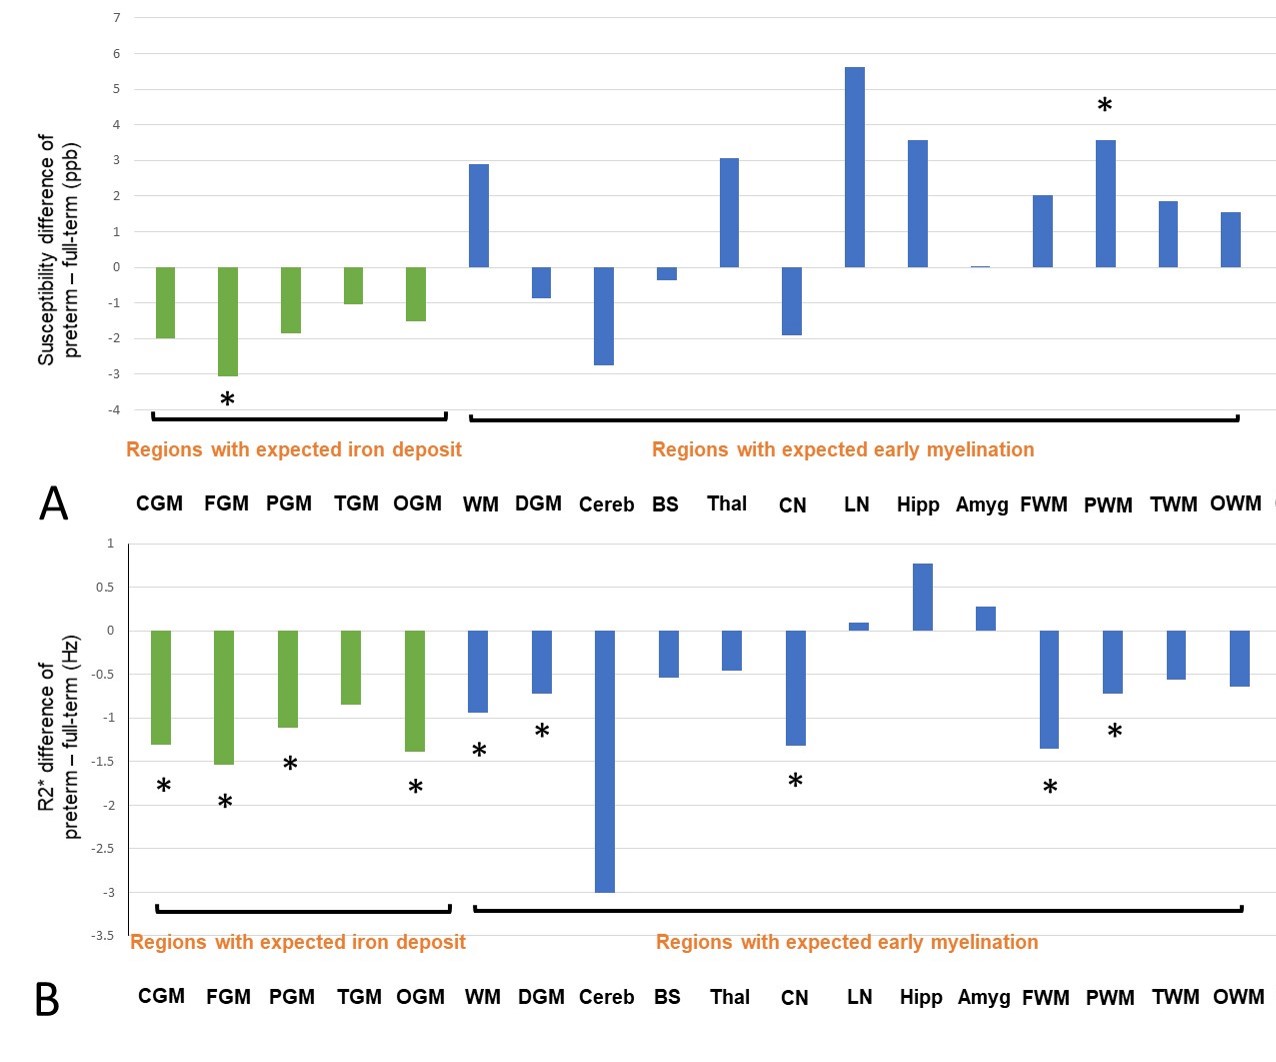
A total of 44 infants were initially included. Of these, 9 infants were excluded due to insufficient image quality for analysis in either GRE or anatomical images. As a result, 23 full-term infants (mean PMA at MRI, 42.0 ± 2.3 weeks; 12 males) and 12 preterm infants (mean PMA at MRI, 37.0 ± 2.8 weeks; 7 males) were studied. Figure 2 shows susceptibility and R2* maps acquired in representative full-term and preterm infants, both with PMA at MRI of 38 weeks. All regional mean susceptibility and R2* measurements are summarized in Table 1. As shown in Figure 3, preterm newborns showed lower mean susceptibilities than full-term mostly in the regions with expected iron deposit and higher mean susceptibilities mostly in the regions with expected early myelination. Particularly, mean susceptibility of preterm infants was significantly lower in the FGM, and was significantly higher in the PWM. On the other hand, preterm newborns showed lower mean R2* in most regions. Regions with a significant difference included CGM, WM, DGM, CN, FGM, PGM, OGM, FWM, and PWM, with all lower mean R2* in preterm infants than full-term. All regions showed no association of mean susceptibility with PMA at MRI except for the LN of full-term newborns (p=0.003, r=-0.586).Discussion
We found significantly higher mean susceptibility in the PWM of preterm newborns compared to full-term, which may be indicative of disrupted myelination in this region8. Lower mean susceptibility in the FGM of the preterm brain may suggest insufficient iron deposition9. Although statistically not significant, mean susceptibility of preterm newborns was lower in most regions associated with iron deposit (e.g., cortical regions) and was higher in most regions with early myelination (e.g., subcortical regions, deep brain nuclei). Our interpretation of the results (i.e., higher susceptibility due to less diamagnetism and lower susceptibility due to less paramagnetism) was supported by lower mean R2* in most regions in the preterm brain. This study may provide a new insight into impaired neurodevelopment in preterm infants due to premature exposure to the extrauterine environment. Further studies are warranted to relate magnetic susceptibilities to assessment of iron content and myelination in this high-risk population.Acknowledgements
R01HD100012, R01NS123576, R01NS095562, R01DK116126, R01NS105144References
1. Zhang Y, Shi J, Wei H, Han V, Zhu WZ, Liu C. Neonate and infant brain development from birth to 2 years assessed using MRI-based quantitative susceptibility mapping. Neuroimage. 2019;185:349-360.
2. Ning N, Liu C, Wu P, et al. Spatiotemporal variations of magnetic susceptibility in the deep gray matter nuclei from 1 month to 6 years: A quantitative susceptibility mapping study. J Magn Reson Imaging. 2019;49:1600-1609.
3. Tortora D, Severino M, Sedlacik J, et al. Quantitative susceptibility map analysis in preterm neonates with germinal matrix-intraventricular hemorrhage. J Magn Reson Imaging. 2018;48:1199-1207.
4. Zhang Y, Rauscher A, Kames C, Weber A. Quantitative analysis of punctate white matter lesions in neonates using quantitative susceptibility mapping and R2* relaxation. American Journal of Neuroradiology. 2019;40:1221-1226.
5. Liu T, Khalidov I, de Rochefort L, et al. A novel background field removal method for MRI using projection onto dipole fields (PDF). NMR Biomed. 2011;24:1129-1136.
6. Liu J, Liu T, de Rochefort L, et al. Morphology enabled dipole inversion for quantitative susceptibility mapping using structural consistency between the magnitude image and the susceptibility map. Neuroimage. 2012;59:2560-2568.
7. Pei M, Nguyen TD, Thimmappa ND, et al. Algorithm for fast monoexponential fitting based on auto-regression on linear operations (ARLO) of data. Magn Reson Med. 2015;73:843-850.
8. Counsell SJ, Maalouf EF, Fletcher AM, et al. MR imaging assessment of myelination in the very preterm brain. American Journal of Neuroradiology. 2002;23:872-881.
9. Volpe JJ, Inder TE, Darras BT, et al. Volpe's neurology of the newborn e-book: Elsevier Health Sciences; 2017.
Figures