5312
QSM Based Decreased Iron Deposition Correlates with Reduced Neurodevelopmental Status in Children with Autism Spectrum Disorder
Lei Du1, Fang Ye2, and Bing Liu1
1Radiology, China-Japan Friendship Hospital, Beijing, China, 2Pediatrics, China-Japan Friendship Hospital, Beijing, China
1Radiology, China-Japan Friendship Hospital, Beijing, China, 2Pediatrics, China-Japan Friendship Hospital, Beijing, China
Synopsis
Keywords: Normal development, Neuro, autism spectrum disorder, Gesell Developmental Schedules, Autism Behavior Checklist, iron, child
To investigate potential correlations between the susceptibility values of certain brain regions and the severity of disease or neurodevelopmental status in children with autism spectrum disorder (ASD). 18 ASD children and 15 healthy controls (HC) were recruited. 11 brain regions as regions of interest. Pearson and Spearman partial correlation analysis was used to depict the correlations between the susceptibility values, the ABC scores, and the GDS scores in ASD group. We found that the susceptibility value of the right globus pallidus was positively correlated with the GDS-fine motor scale score.Purpose
To investigate potential correlations between the susceptibility values of certain brain regions and the severity of disease or neurodevelopmental status in children with autism spectrum disorder (ASD).Methods
Eighteen children with ASD and 15 healthy controls were recruited, and demographic and clinical information was collected. The neurodevelopmental status was assessed by Gesell Developmental Schedules (GDS) and the severity of the disease was evaluated by Autism Behavior Checklist (ABC). Eleven brain regions were selected as regions of interest (ROIs) and the susceptibility values were measured by quantitative susceptibility mapping (QSM)1-4. The susceptibility values obtained from the left side and the right side were compared using the paired t-test or Wilcoxon test. The values obtained from the ASD and control groups were compared using a two-sample t-test or Mann-Whitney test. To evaluate the diagnostic capacity of susceptibility values in distinguishing ASD children and healthy controls, a receiver operating characteristic (ROC) curve and the area under the curve (AUC) were computed. Pearson or Spearman partial correlation analysis was used to depict the correlations between the susceptibility values, the ABC scores, and the GDS scores in children with ASD.Results
Compared to the control group, the susceptibility values of the bilateral red nucleus, bilateral frontal white matter, and the left temporal white matter were decreased in the ASD group (P < 0.05 for all). ROC curves indicated that the susceptibility values of the left and right frontal white matter had a larger AUC in ASD group (AUC = 0.863, and 0.833, respectively). In addition, the susceptibility values of the caudate nucleus and thalamus were asymmetric in the ASD group, whereas in the control group, this asymmetry was only observed in the thalamus. The susceptibility value of the right globus pallidus was positively correlated with the GDS-fine motor scale score.Conclusions
The susceptibility values of the bilateral frontal white matter may be potential imaging biomarkers for early diagnosis of ASD, and the susceptibility value of the right globus pallidus might be a viable imaging biomarker for the evaluation of neurodevelopmental status in children with ASD. These findings may provide new insights to further investigate the pathophysiology of pediatric ASD.Acknowledgements
We thank all children who participate in this research. Thanks to Dr. Lizhi Xie from GE Healthcare for solving QSM technical problems.References
1. Lai MC, Lombardo MV, Baron-Cohen S. Autism. Lancet (London, England). 2014; 383: 896-910.
2. Ecker C, Bookheimer SY, Murphy DG. Neuroimaging in autism spectrum disorder: brain structure and function across the lifespan. The Lancet. Neurology. 2015; 14: 1121-1134.
3. Wing L. The autistic spectrum. Lancet (London, England). 1997: 350: 1761-1766.
4. Tang S, Xu Y, Liu X, et al. Quantitative susceptibility mapping shows lower brain iron content in children with autism. European radiology. 2021: 31: 2073-2083.
Figures
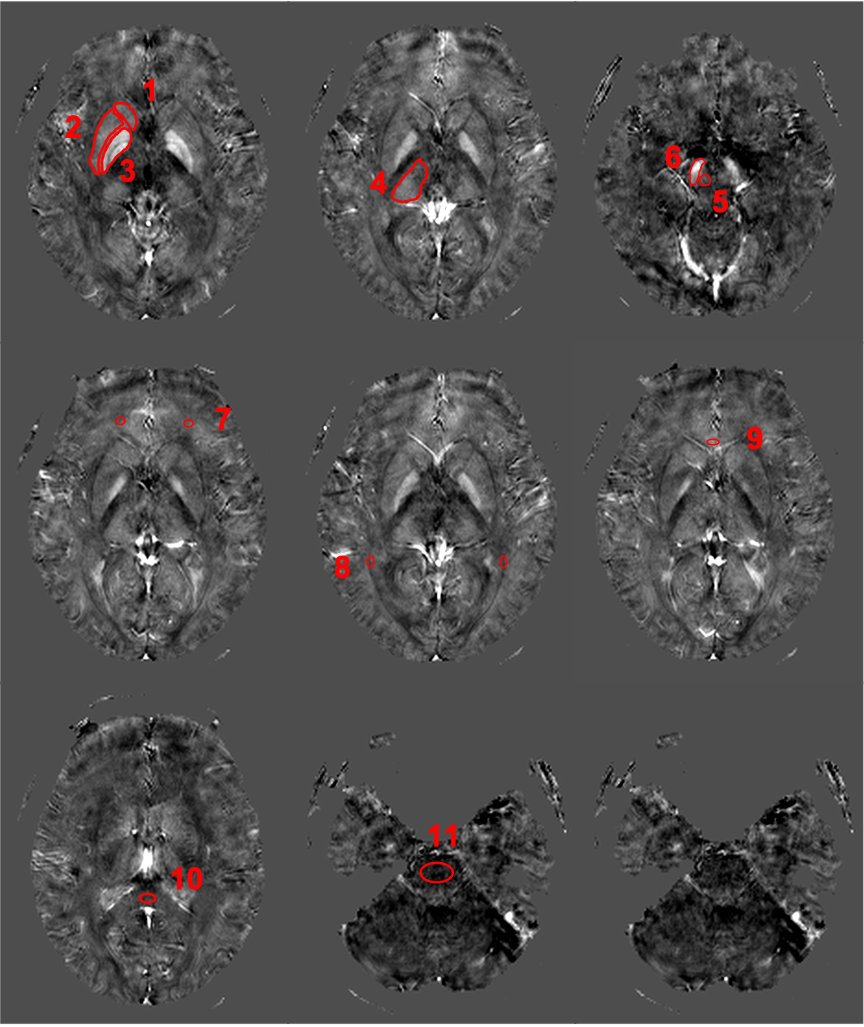
Figure 1. An
8-year-old healthy control male. The 11 regions of interest are outlined in the
red line in QSM imaging, including the caudate nucleus, putamen, globus
pallidus, thalamus, red nucleus, substantia nigra, frontal white matter,
temporal white matter, genu of the corpus callosum, splenium of the corpus
callosum, and pons.
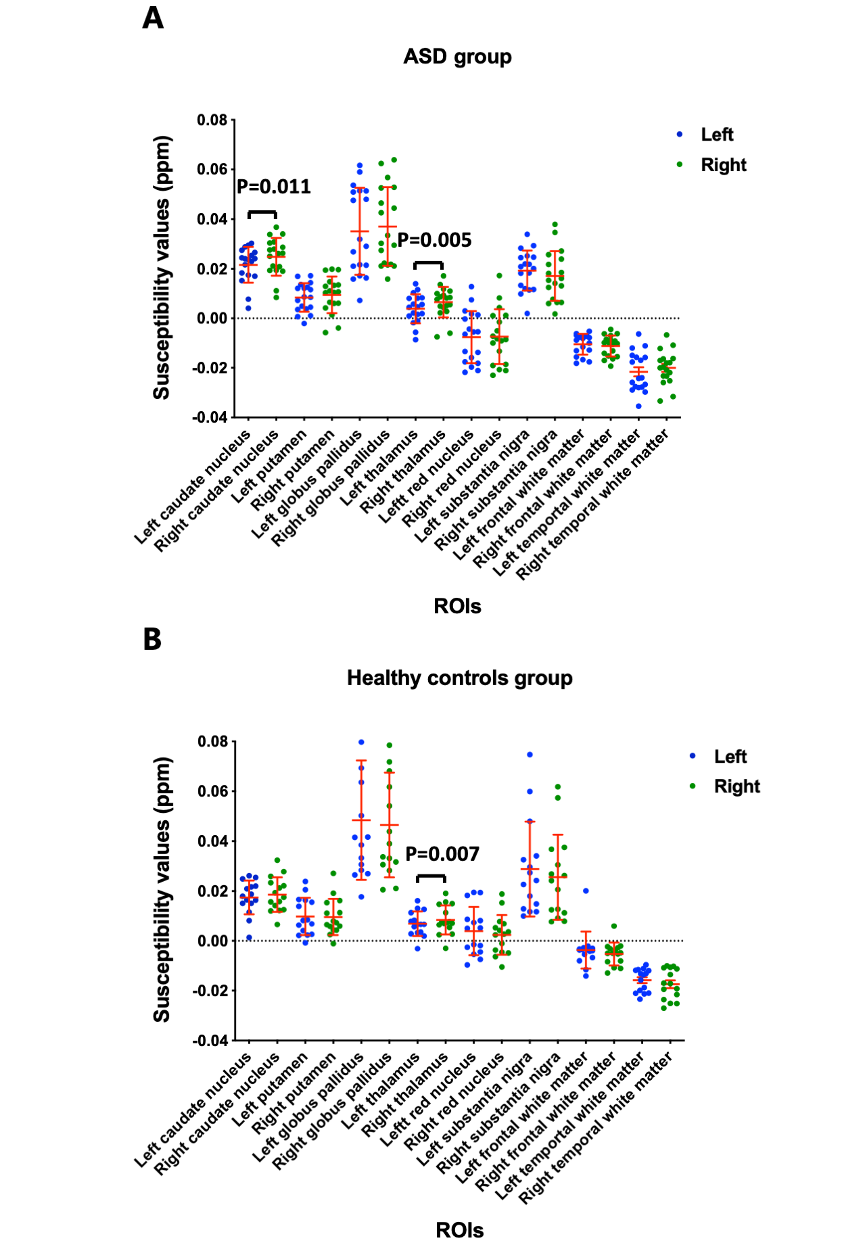
Figure 2. Comparisons
the left and right ROIs both in ASD group (A) and healthy controls group (B). The
susceptibility value of left-side thalamus was significantly lower than that of
right-side in the controls group, while this
asymmetry was observed both in thalamus and caudate nucleus in the ASD group.
ROI, region of interest; ASD, autism spectrum disorder.
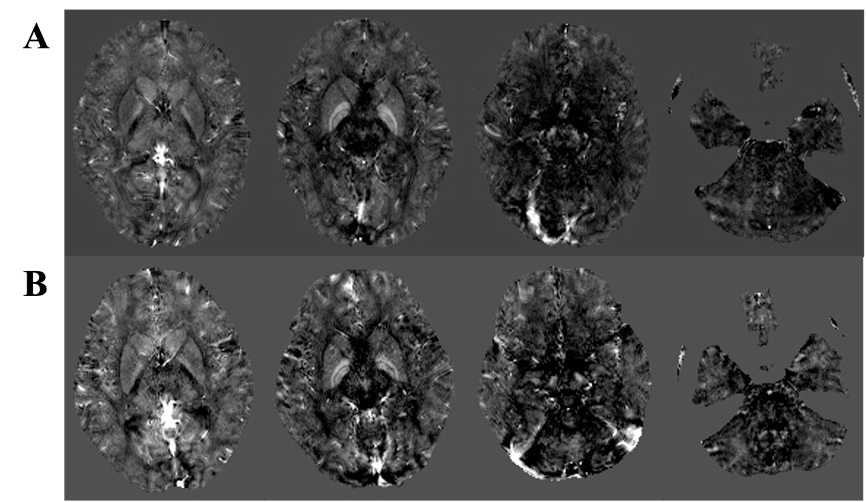
Figure 3. Comparisons
of susceptibility values between the ASD and HC. The representative QSM imaging
of a 5 year-old ASD children (A) and a 4-year-old HC (B). The difference of
iron deposition in brain regions was not obvious to the naked eye. ASD, autism
spectrum disorder; HC, healthy control; QSM, quantitative susceptibility
mapping.
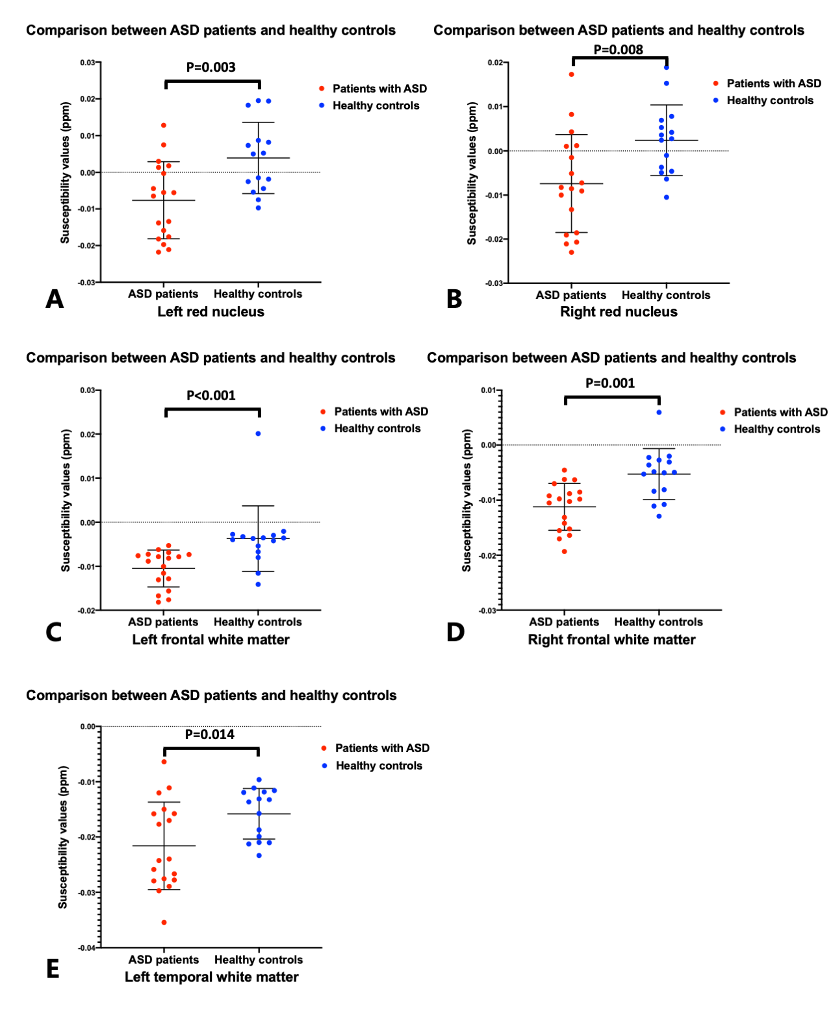
Figure 4. Comparisons
between ASD group and healthy controls group in left red nucleus (A), right red
nucleus (B), left frontal white matter (C), right frontal white matter (D), and
left temporal white matter (E). The results showed that the susceptibility
values of the bilateral red nucleus, bilateral frontal white matter, and left
temporal white matter in the ASD group were lower than those in the healthy
control group (P= 0.003, 0.008, <0.001, 0.001, 0.014 ). ASD,
autism spectrum disorder.
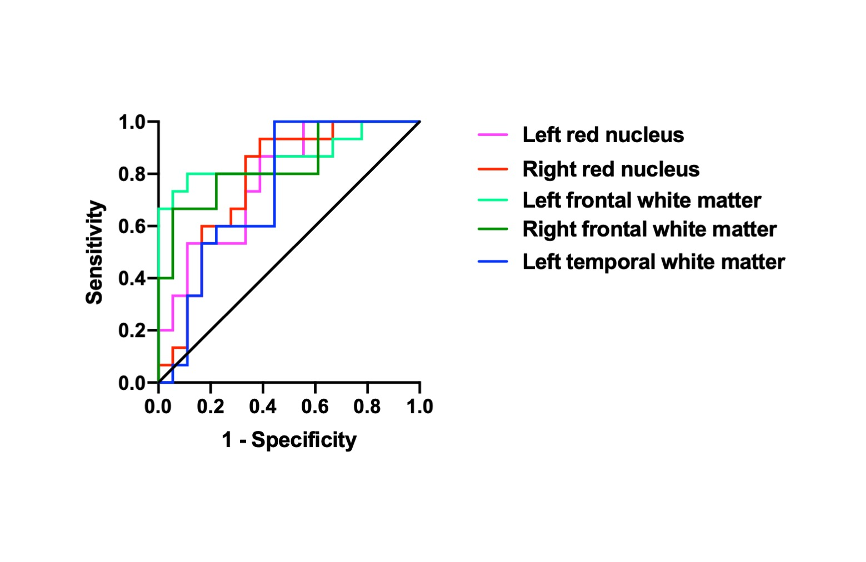
Figure 5. The
ROC curve was generated using the bilateral red nucleus, bilateral frontal
white matter, and the left temporal white matter for distinguishing patients
with ASD and healthy controls. The AUC of the five brain regions were 0.778,
0.774, 0.863, 0.833, and 0.741. ROC, receiver operating characteristic; ASD,
autism spectrum disorder; AUC, area under the curve.
DOI: https://doi.org/10.58530/2023/5312