5310
Attention network dysconnectivity and impaired visual search in individuals with early developmental brain injury
Marie Drottar1, Claire E Manley2, Lotfi B Merabet2,3, and Corinna Bauer1,3
1Lab for Neuroimaging and Vision Science, Gordon Center for Medical Imaging at Mass General Hospital, Boston, MA, United States, 2Schepens Eye Research Institute,Massachusetts Eye and Ear Infirmary, Boston, MA, United States, 3Department of Ophthalmology, Harvard Medical School, Boston, MA, United States
1Lab for Neuroimaging and Vision Science, Gordon Center for Medical Imaging at Mass General Hospital, Boston, MA, United States, 2Schepens Eye Research Institute,Massachusetts Eye and Ear Infirmary, Boston, MA, United States, 3Department of Ophthalmology, Harvard Medical School, Boston, MA, United States
Synopsis
Keywords: Neuro, Brain Connectivity, multimodal
This study investigated the relationship between structural and functional disconnectivity of the dorsal and ventral attention networks and performance on a visual conjunction search task in individuals with early developmental brain injury (EDBI). Individuals with EDBI performed significantly worse than controls on the conjunction search task, as indicated by increased mean search time, higher y-intercept, and increased search time as a function of task difficulty (i.e. steeper slope). Each of these behavioural outcomes was positively correlated with connectivity measures in the dorsal and ventral attention networks, suggesting that aberrant functional and structural connectivity may underlie the observed visual search impairments.Introduction
Individuals with early developmental brain injury (EDBI) often incur damage to the peri-trigonal white matter. Multiple key white matter pathways traverse this region, including those central to the dorsal and ventral attention networks (DAN and VAN, respectively). It remains unclear how the development of these two networks is impacted in adolescent survivors of EDBI and how potential structural and functional dysconnectivity relates to impairments in visual attention processes, such as visual search.This study investigates the relationship between structural and functional dysconnectivity and performance on a visual conjunction search task in individuals with EDBI.Methods
30 participants (12 EDBI (19.75 years, 5.46 SD), 18 control (21.78 years, 4.01 SD) were enrolled and underwent MRI scanning on a 3T Philips Elition X. A T1w, two 5:15 min resting state fMRI (rsfMRI) (TR = 800 ms, TE = 30 ms, 2.25 x 2.25 x 2.4 mm), a multi-shell diffusion sequence (TE = 89 ms TR = 6158 ms, 2mm isotropic, b-values = 500, 1000, 2000, 3000 s/mm2 with 6, 15, 15, 60 diffusion sampling directions, respectively), and corresponding fieldmaps were acquired. Preprocessing for the each rsfMRI run included topup, 6-parameter motion correction, 5mm smoothing, brain extraction, ICA-AROMA to remove motion-related components, regression of signal from the white matter and cerebrospinal fluid, and bandpass filtering at 0.01 – 0.1 Hz. The mean time course for each seed from the DAN1, VAN2, V2, and V3 were extracted. Z-transformed partial correlation matrices adjusting for age were calculated for each run and averaged within subjects.Diffusion preprocessing included correction for susceptibility, eddy distortion, inter- and intra-volume motion correction, and brain extraction. B-vectors were adjusted accordingly. Diffusion data were reconstructed using generalized q-sampling3. A deterministic algorithm4 with 1,000,000 seeds and tracking parameters optimized based on pathway were used to generate connectivity matrices for each subject between seeds of the DAN and VAN.For both modalities, group differences in connectivity matrices were evaluated with permutation testing (1,000 permutations) with FDR correction. Mean inter- and intra-network connectivity were compared using t-tests. Correlations with behavioural outcomes were adjusted for multiple comparisons using FDR correction.In each participant, visual search was assessed using a conjunction search paradigm. Targets and distractors were combinations of white or black “C”s and “O”s on a mean luminance grey background. The search display was constructed by randomly plotting all search items within a viewing angle of 13.5°. Set sizes of 1, 4, 8, 16, and 32 elements were randomly interleaved with 10 trials per condition, for a total of 50 trials per run. Response times were recorded as the interval between trial start and responseResults
For the conjunction search task, the EDBI group demonstrated a significantly higher intercept (p = 0.0035), mean reaction time (p = 0.0002), and increased slope (0.028), each an indicator of worse performance compared to controls (Figure 1). Specifically, a higher intercept implies a slower time to locate the target in the presence of no distractors, while the increase slope indicates a greater impact of the number of distractors compared to controls.Across all subjects, multiple edges in both functional and structural networks correlated with conjunction search slope, intercept, and mean search time (Figure 2); however, within groups, this was only observed in the CVI group and not in the control group. Similar results were also observed for the structural connectivity data. Overall, worse performance in the CVI group was associated with increased correlations between nodes of the DAN and VAN.Conclusion
These results provide empirical support for the challenges with visual search and visual attention that are commonly reported in individuals with early developmental brain injury. The functional and structural connectivity data suggest that impaired visual attention may be due in part to aberrant communication between associated brain regions of the dorsal and ventral attention networks.Summary of Main Findings
The results from this study indicate that impairments in visual search may be related to aberrant functional and structural connectivity of the dorsal and ventral attention networks in adolescent survivors of early developmental brain injury.Acknowledgements
This work was supported by RO1 EY030877 to CMBReferences
1. Allan, P. G. et al. Parcellation-based tractographic modeling of the dorsal attention network. Brain Behav. e01365 (2019) doi:10.1002/brb3.1365.
2. Allan, P. G. et al. Parcellation-based tractographic modeling of the ventral attention network. J. Neurol. Sci. 408, 116548 (2020).
3. Yeh, F.-C., Wedeen, V. J. & Tseng, W.-Y. I. Generalized q-sampling imaging. IEEE Trans. Med. Imaging 29, 1626–1635 (2010).
4. Yeh, F.-C. & Tseng, W.-Y. I. Sparse Solution of Fiber Orientation Distribution Function by Diffusion Decomposition. PLoS ONE 8, e75747 (2013)
Figures

Figure 1. Conjunction search data for the EDBI (orange) and control groups (blue). Reaction time (A) and accuracy (B) are shown as a function of set size. Note that the intercept for the EDBI group is significantly higher, the slope is significantly steeper, and the reaction time is consistently higher for the EDBI group compared to controls. Also, the EDBI group has a significant reduction in accuracy with increasing set size. The results demonstrate significant impairments in the EDBI group.
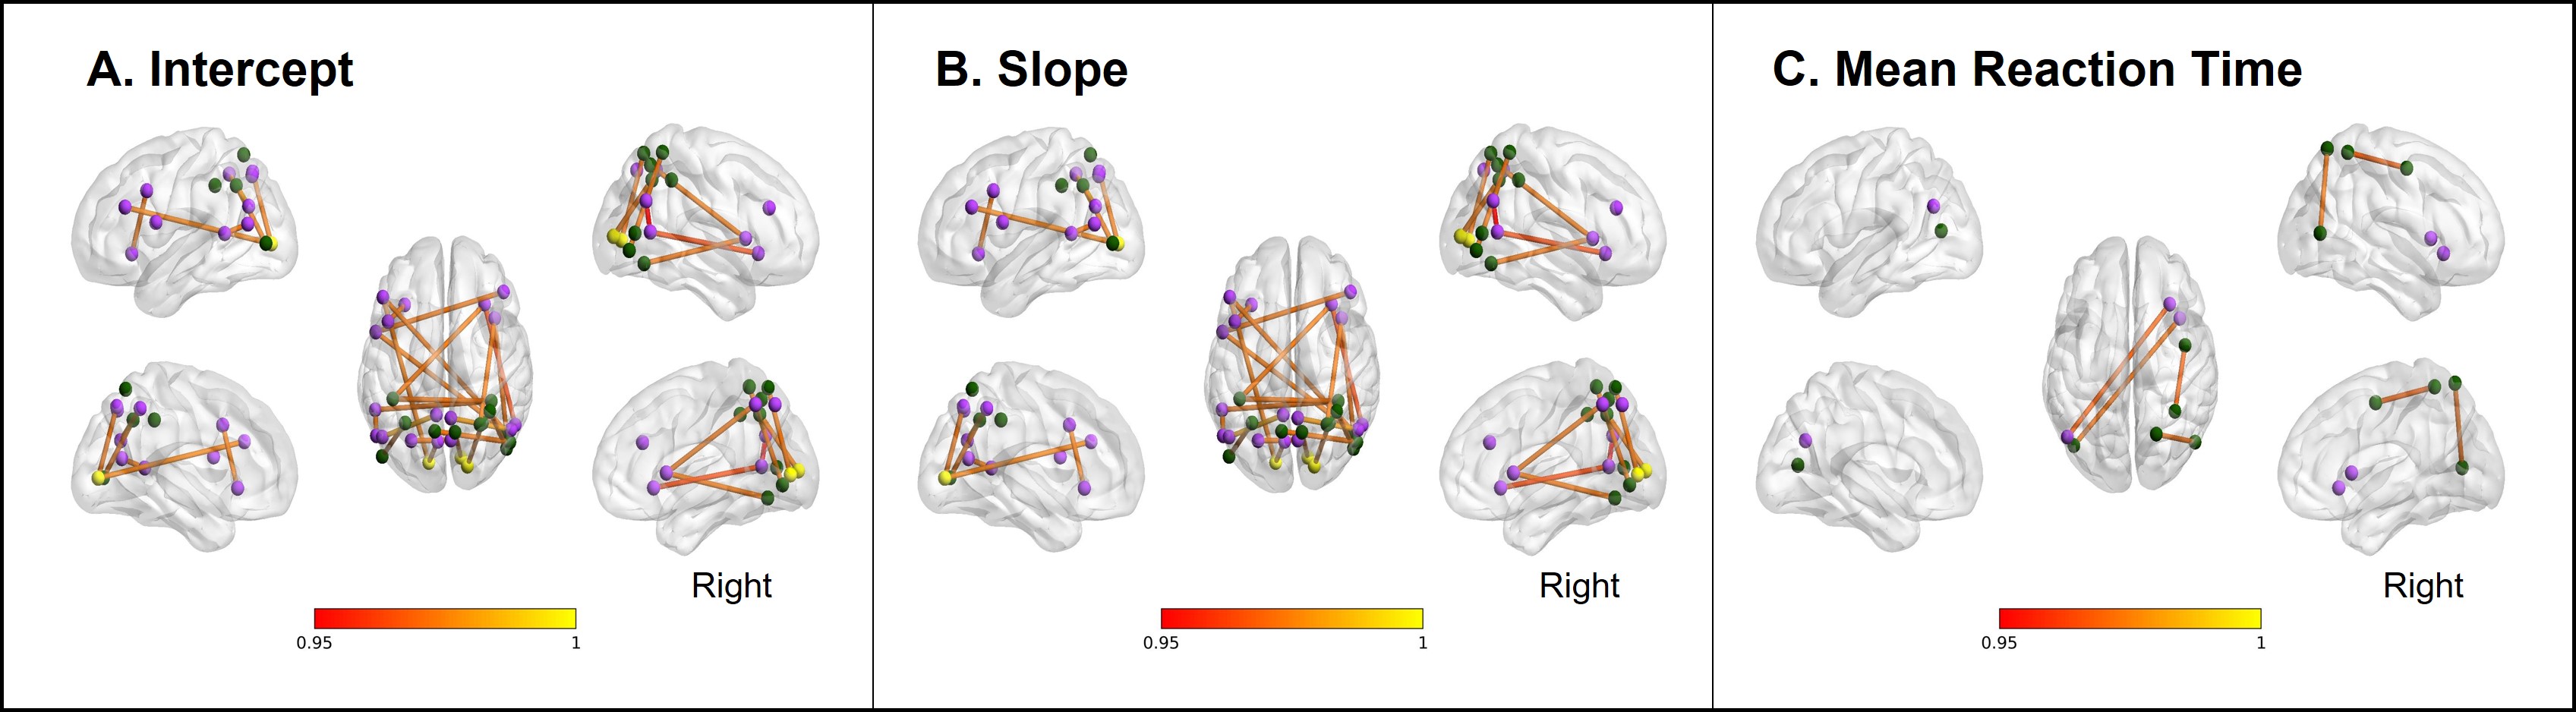
Figure 2. Ball and stick figures showing widespread significant FDR-corrected correlations between intercept (A), slope (B), and mean reaction time (C) and z-transformed partial correlations from the resting state network data in the early developmental brain injury group. These results suggest that increased functional connectivity at rest (i.e. increased background noise) is associated with worse performance on the visual search task.
DOI: https://doi.org/10.58530/2023/5310