5308
Monitoring in vitro and in vivo cell death using AXR, ADC and hyperpolarized [1,4-13C2]fumarate1School of Medicine, Klinikum rechts der Isar, Department of Nuclear Medicine, Technical University of Munich (TUM), Munich, Germany, 2School of Medicine, Klinikum rechts der Isar, Department of Medicine III, Technical University of Munich (TUM), Munich, Germany, 3Chair of Analytical Chemistry and Water Chemistry, Institute of Water Chemistry, Technical University of Munich (TUM), Garching, Germany, 4Chair of Clinical Division of Oncology Department of Internal Medicine, Medical University of Graz, Graz, Austria, 5Chair of University Palliative Care Unit, Medical University of Graz, Graz, Austria
Synopsis
Keywords: Diffusion/other diffusion imaging techniques, Microstructure, FEXSY, FEXI, exchange, water transmembrane permeability, cell death
Filter exchange spectroscopy (FEXSY) and imaging (FEXI) were used to measure apparent exchange rate (AXR) in acute myeloid leukemia cells undergoing apoptosis, necroptosis, or necrosis. Sensitivity of AXR to membrane permeabilization in vitro, while ADC was stable, were confirmed by Annexin V/PI staining and by scanning electron microscopy of microstructural leaks upon necrosis. AXR of murine EL4 lymphoma showed negative and positive correlation with ADC and malate/fumarate ratio, respectively. Tumor H&E histological analyses show clusters of diffuse necrosis in the solid tumor region, which likely contribute to high AXR and MFR variation while ADC is still low.Purpose
In cancer therapy, cells can undergo a spectrum of forms of cell death, from apoptosis to necrosis, during which plasma membrane structural changes are common1. Filter-exchange spectroscopy (FEXSY) and imaging (FEXI) signal depends on transmembrane water permeability and enables quantification of the apparent exchange rate (AXR) using magnetic resonance2-5. After mitochondrial breakdown, the intracellular enzyme fumarase interacts with fumarate, producing malate. Here, the goal was to investigate in vitro and in vivo whether AXR change can monitor cell death and to compare with established markers of cell death. AXR was correlated in vitro with the fluorescence markers Annexin V/PI and in vivo with apparent diffusion coefficient (ADC) and hyperpolarized 13C-malate/fumarate ratio (MFR). Microstructural alterations were imaged with scanning electron microscopy (SEM) and H&E histology.Methods
SubjectsIn vitro
Suspensions of acute myeloid leukemia (AML) cells undergoing treatments:
- Necrosis from 5min isopropanol (3%-40%)7,
- Apoptosis from 41h Doxorubicin (0.1-2.5μM)9,
- Necroptosis from 16h Birinapant (10-1000nM), 100 ng/ml rh-TNF, 5µM Emricasan8.
C57BL/6 mice (n= 11) were injected with 1∙105 EL4 lymphoma tumor cells (ATCC) in the lower back and were scanned after 6, 7, 8 and 9 days.
MR measurement
Imaging System: 7T preclinical scanner (Bruker/Agilent/GE)
Polarization: 5M [1,4-13C]fumaric acid in DMSO with 19mM OX063 radical and 0.6mM DOTAREM was polarized for 1.5h in a HyperSense dissolution DNP hyperpolarizer (Oxford Instruments, UK). Then, 250µl of 40mM [1,4-13C2]fumarate is injected.
In vitro
- 1H solenoid coil with 10 mm inner diameter (Rapid Biomedical)
- FEXSY: bf=2043s/mm2; b=59-2401s/mm2; tm=24-30ms
- DW-MRS: b=59-2401s/mm2
- 3 repetitions per sample each day, repeated on 3 different days
- 1H/13C volume resonator, 31mm ID (Rapid Biomedical)
- FEXI: bf=1288s/mm2; b=54; 604s/mm2;
tm=13-303 ms
- DWI: b=54 & 604s/mm2
- CSI: matrix = 16x16, FA = 12, starting 30 s after fumarate injection
Analysis
- AXRs and ADCs calculated from FEXSY/FEXI and DW-MRS/DWI2-5.
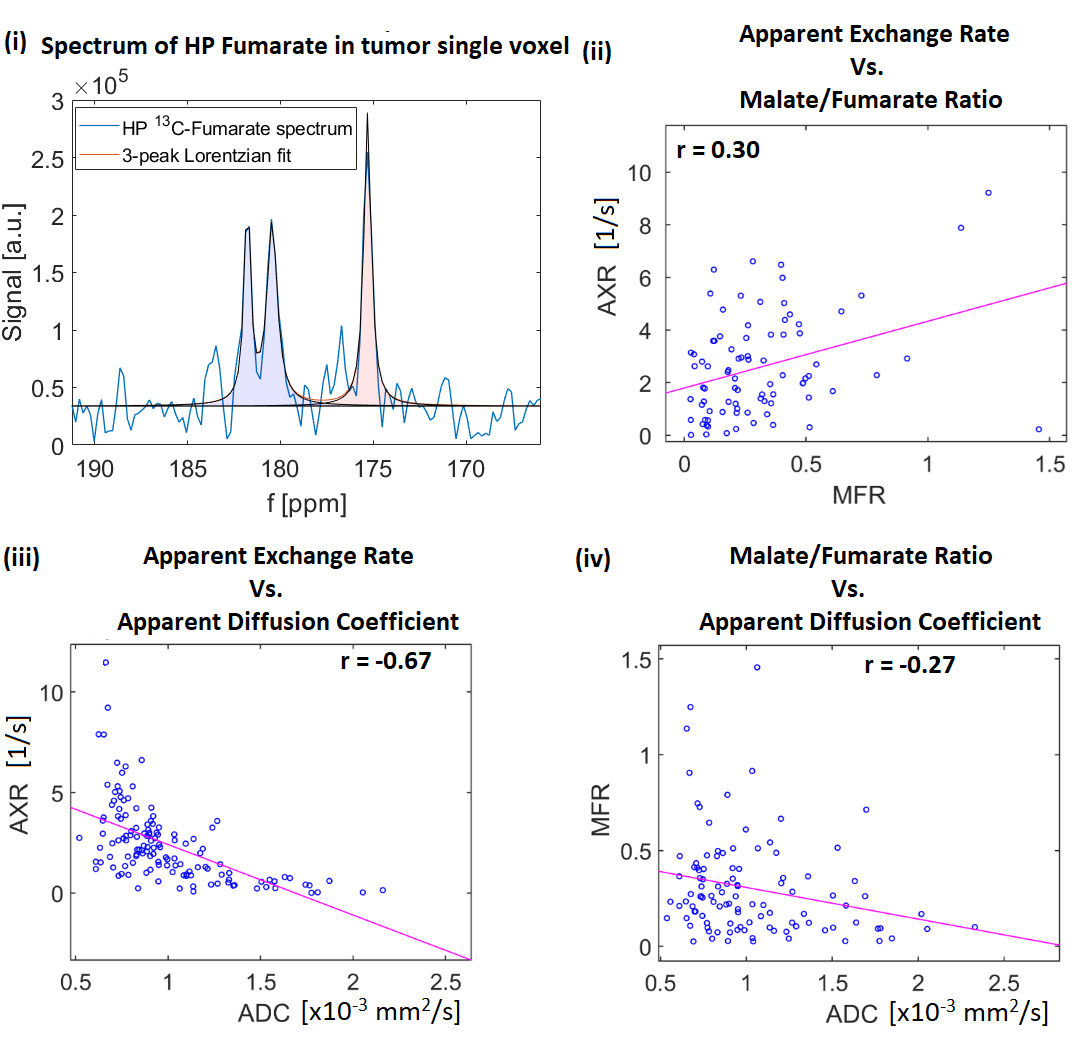
- 3-peaks Lorentzian fit in each voxel to the hyperpolarized fumarate spectra and MFR calculated from peak areas.
- AXR maps down-sampled to MFR resolution and Spearman correlation calculated for the tumor single voxels.
In vitro
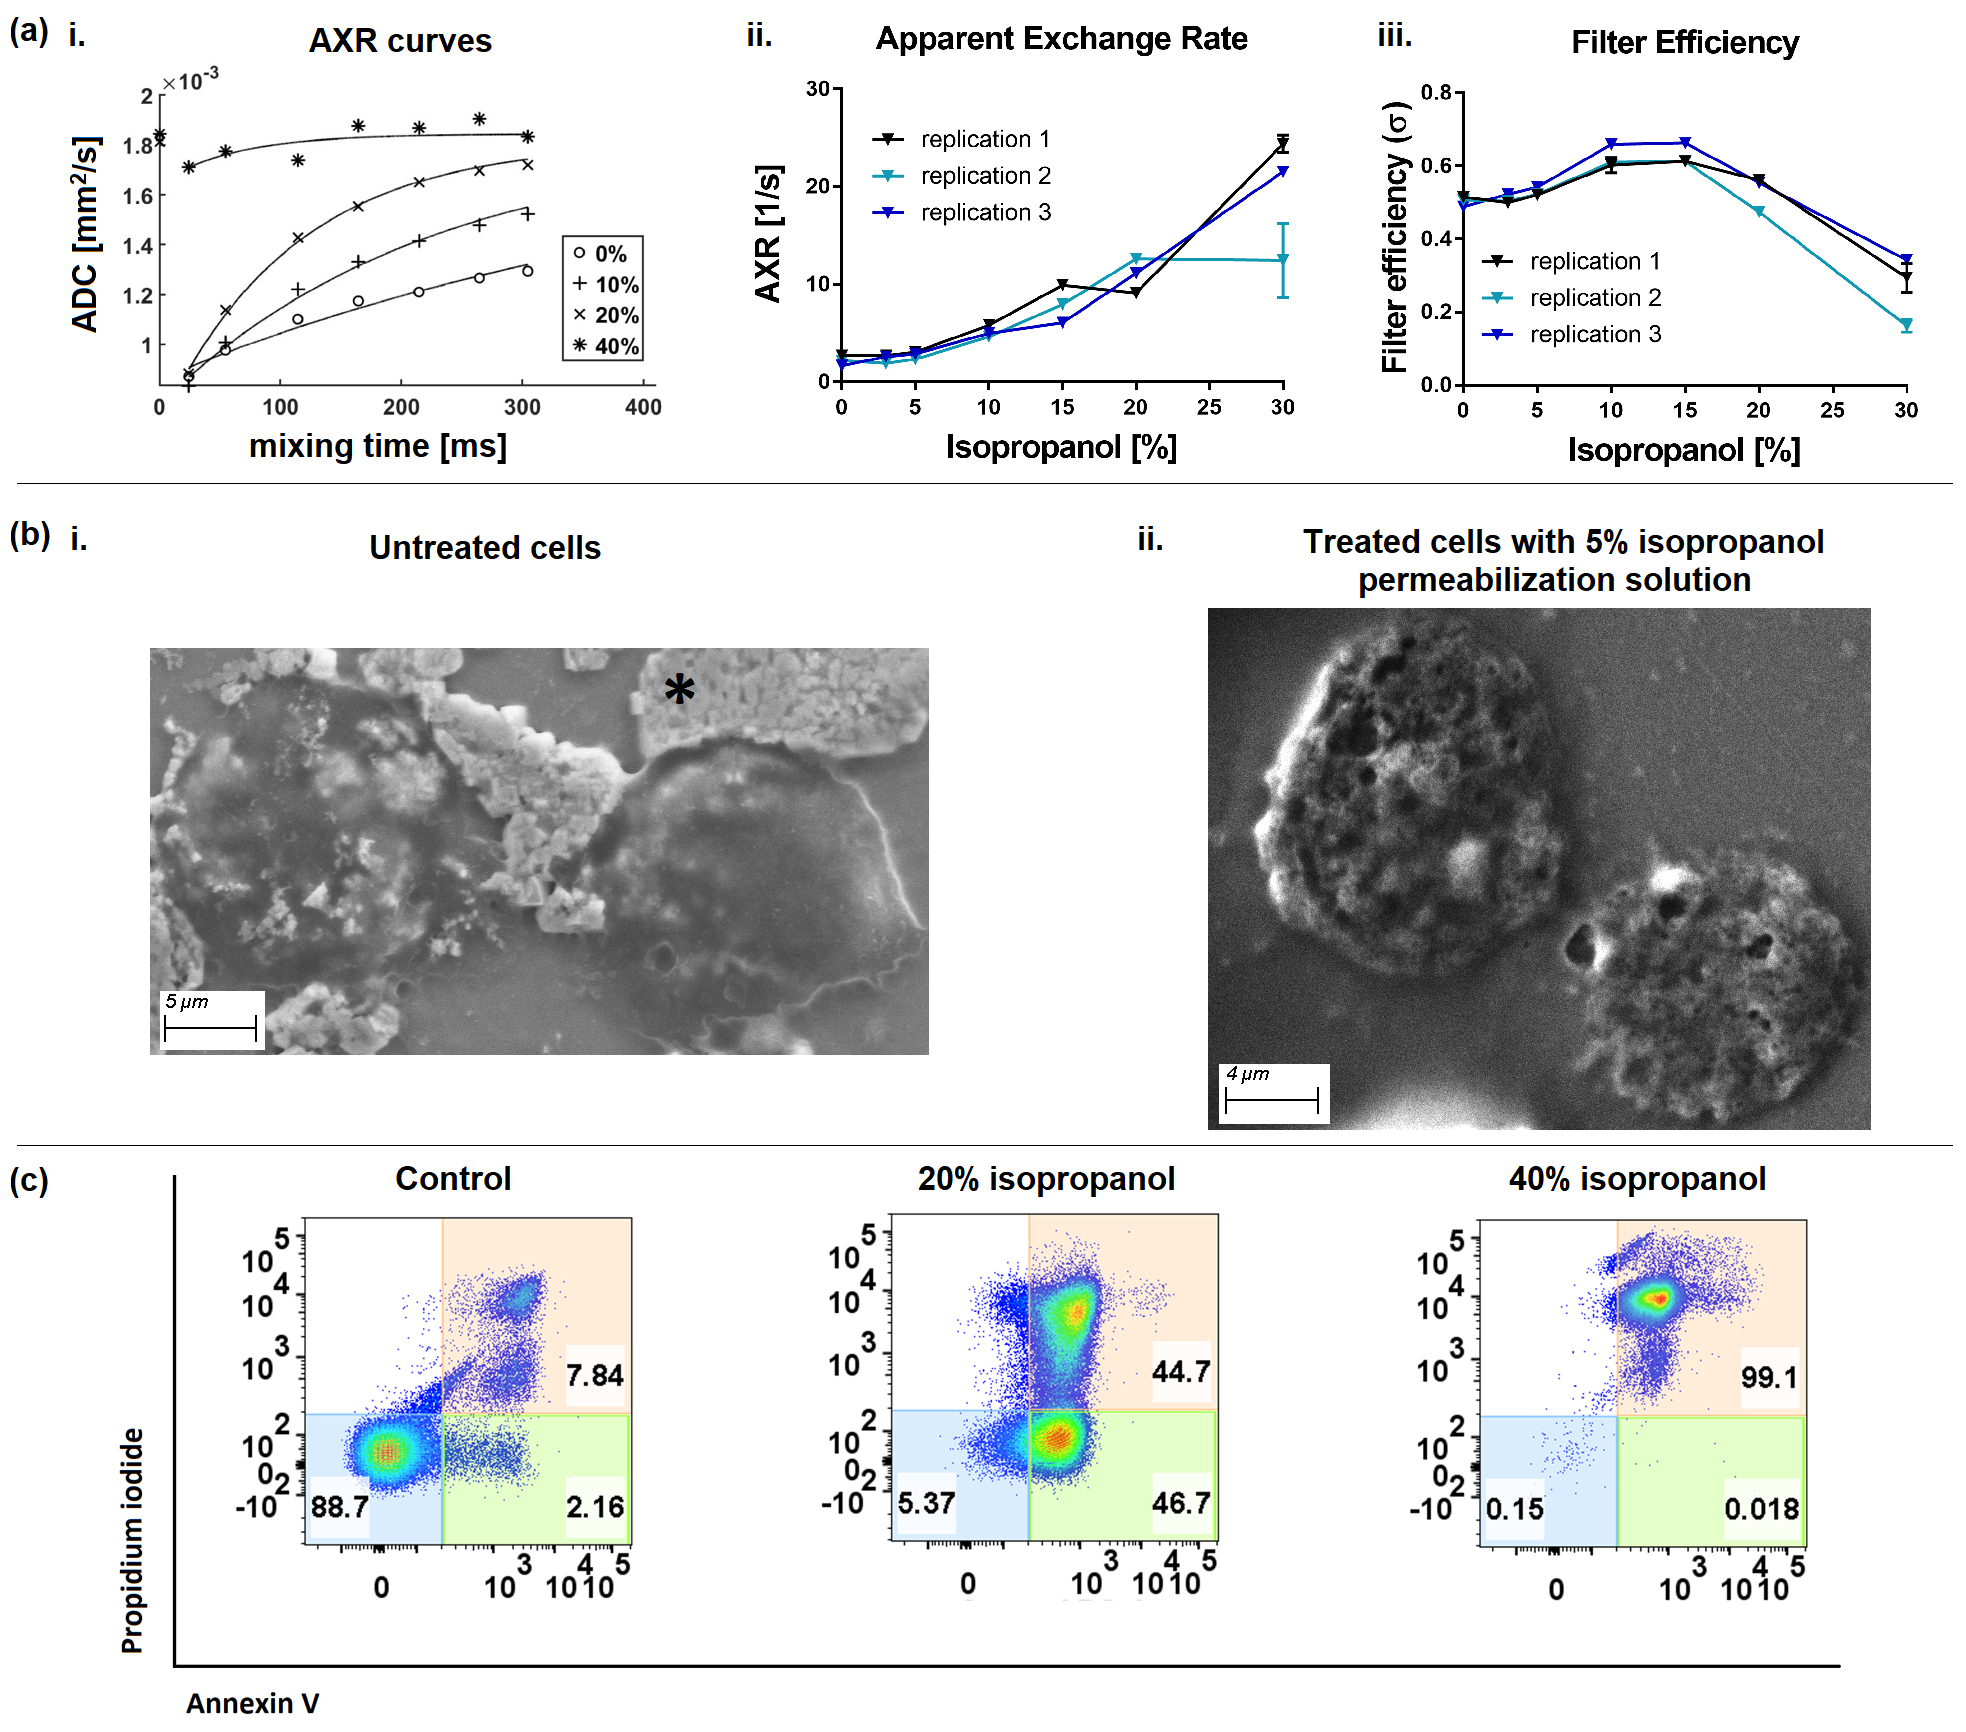
- Cell death imaged by flow cytometry after Annexin V/PI staining10, 11. Double-stained cells were cells with ruptured cell membranes.
- Cell membrane morphology by scanning electron microscopy (Sigma 300 VP, Carl Zeiss AG, Germany). After treatment, cells were washed and diluted in PBS (100cells/μl). Then, 1μl was positioned on an Al-glass slide and let dry before it was scanned (Scanning parameters: SE2 detector, working voltage: 10kV, working distance: 6.0mm).
- Viable and necrotic tumor areas from H&E staining.
Results
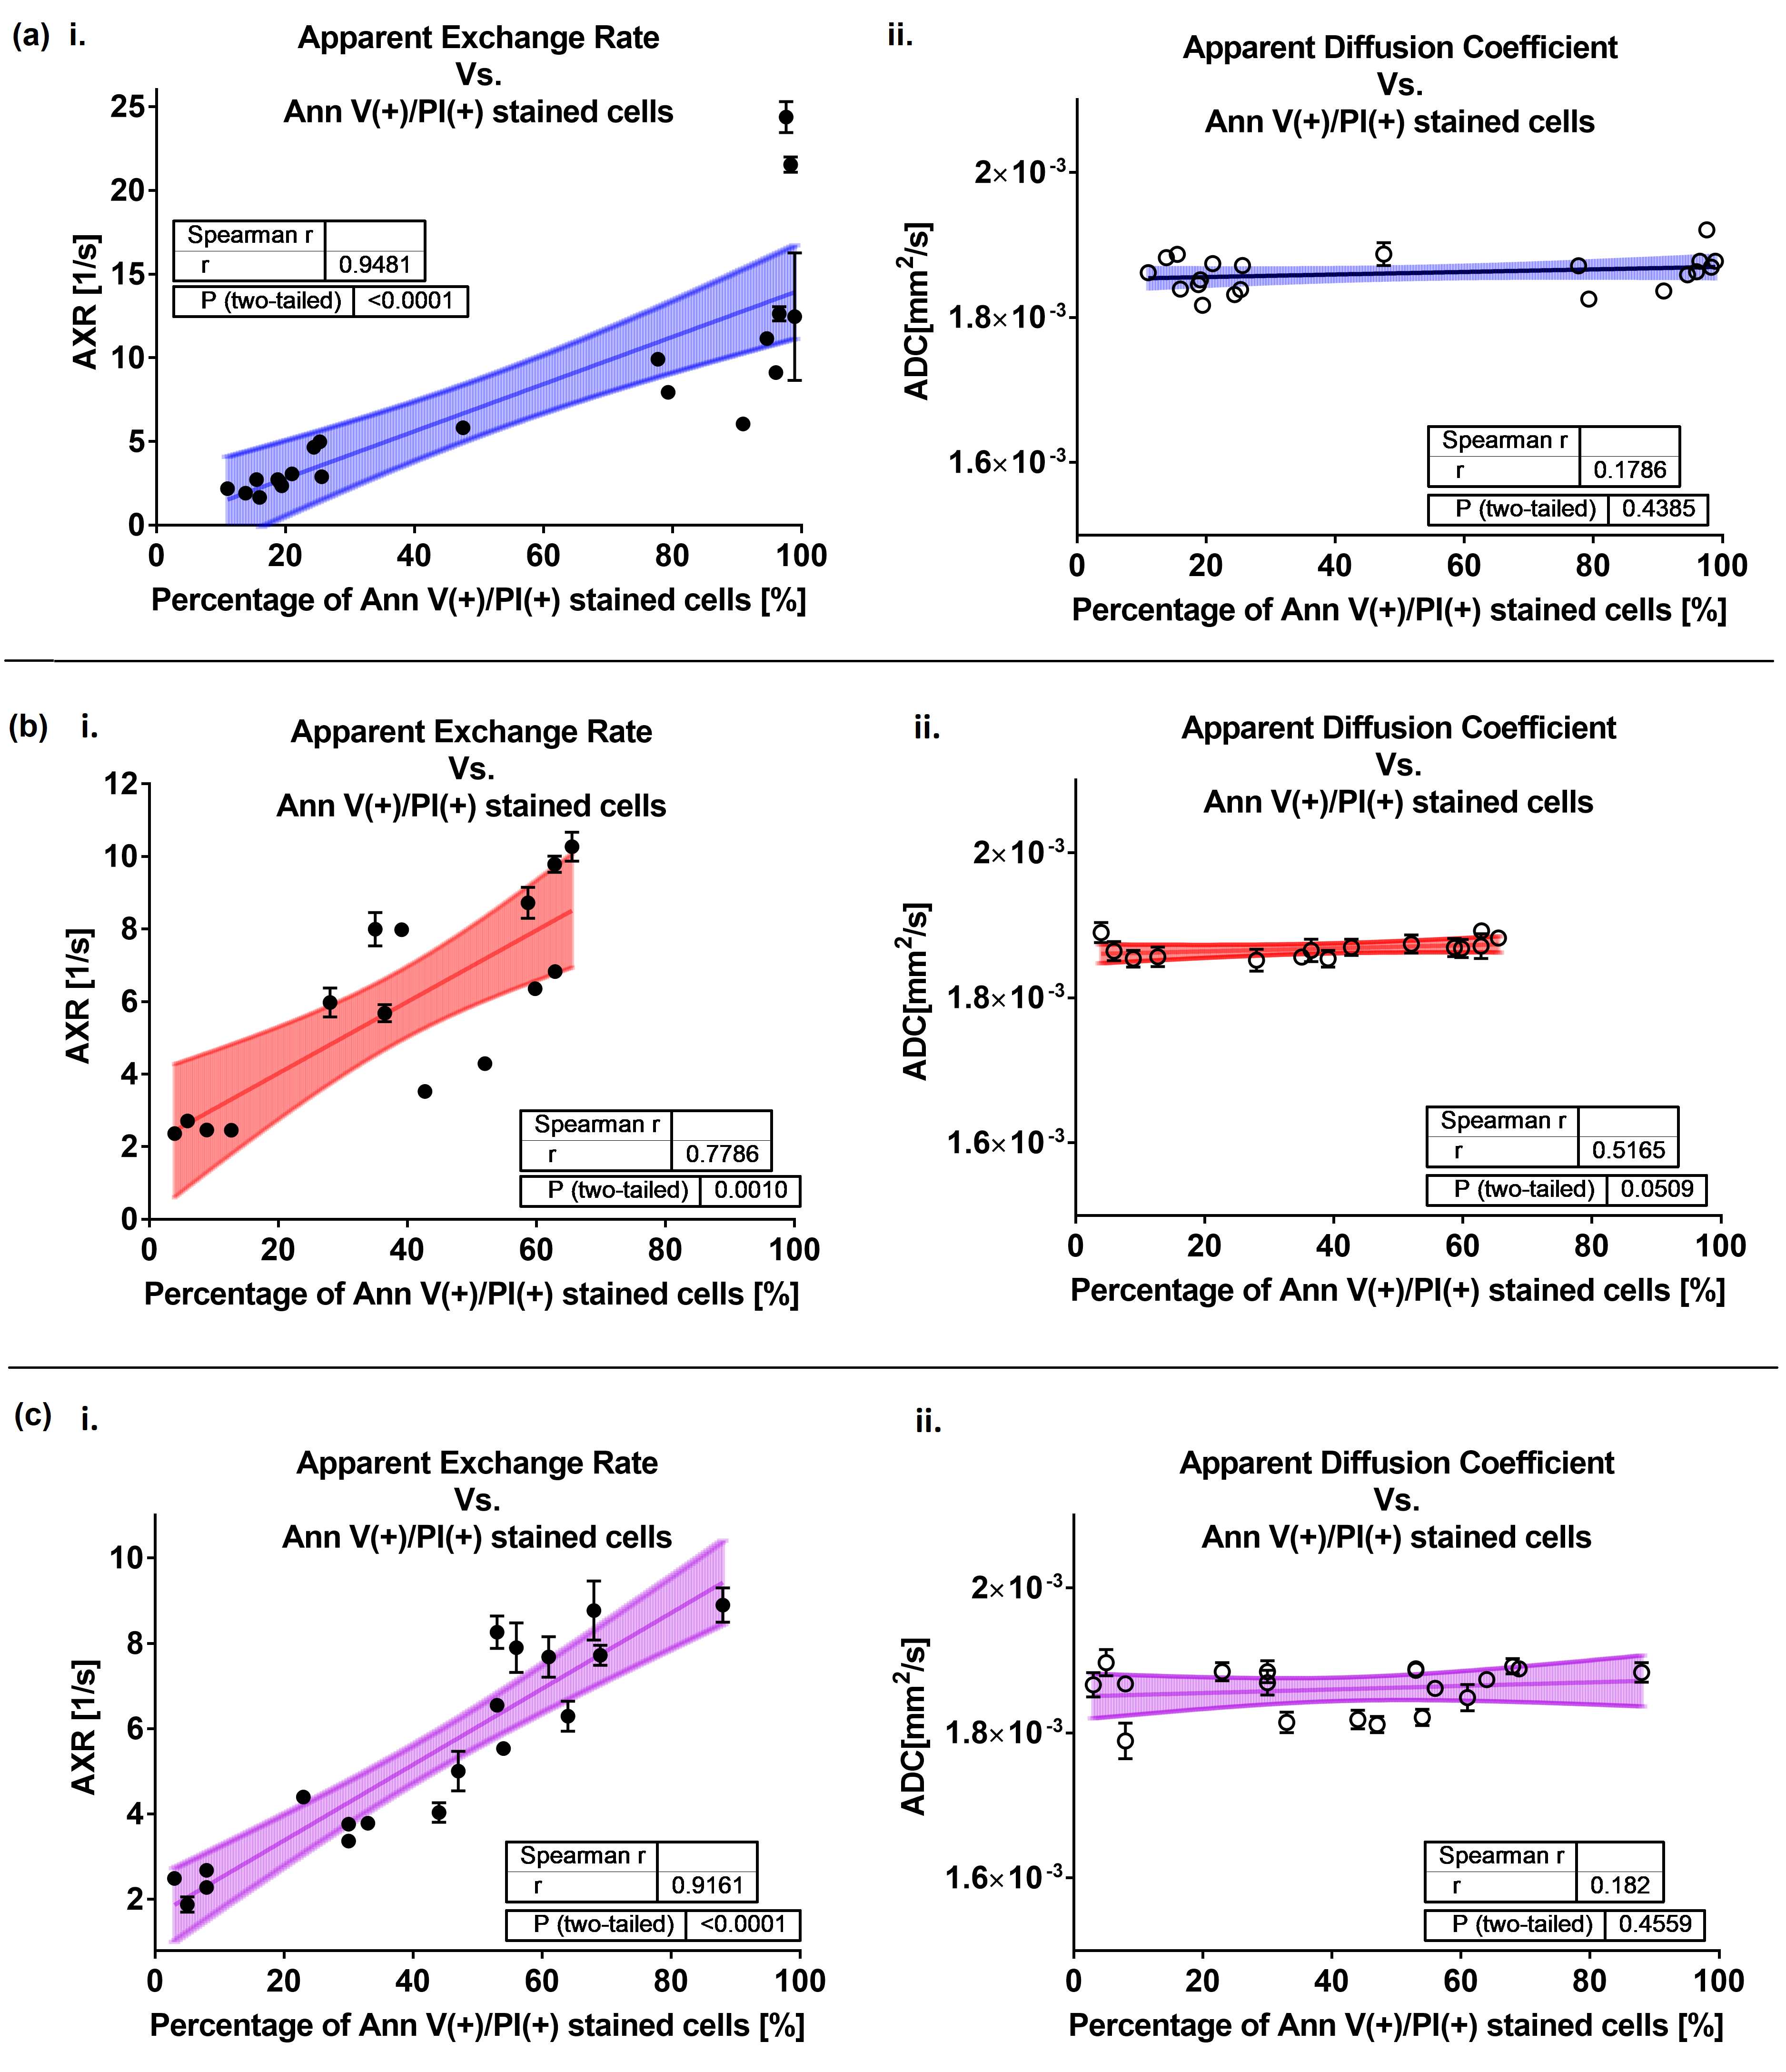
In vitro necrosisWith increasing isopropanol (iso) concentration, AXR increases gradually while AXR fits become less robust above 30% iso [fig. 1ai, ii], and filter efficiency drops, indicating reduced diffusion restriction [fig. 1aiii]. ADC was stable for all Annexin V(+)/PI(+) cell % which were caused by the different iso concentrations [fig. 2aii ].
Damaged plasma membranes with numerous microstructural leaks appear on the cells treated with already 5% iso in contrast to untreated cells [fig. 1bi, ii].
AXR is positively correlated with Annexin V(+)/PI(+) %, but not ADC [fig. 2a].
In vitro apoptosis and necroptosis
AXR is positively correlated with Annexin V(+)/PI(+) %, but not ADC [fig. 2b, c].
In vivo and histology
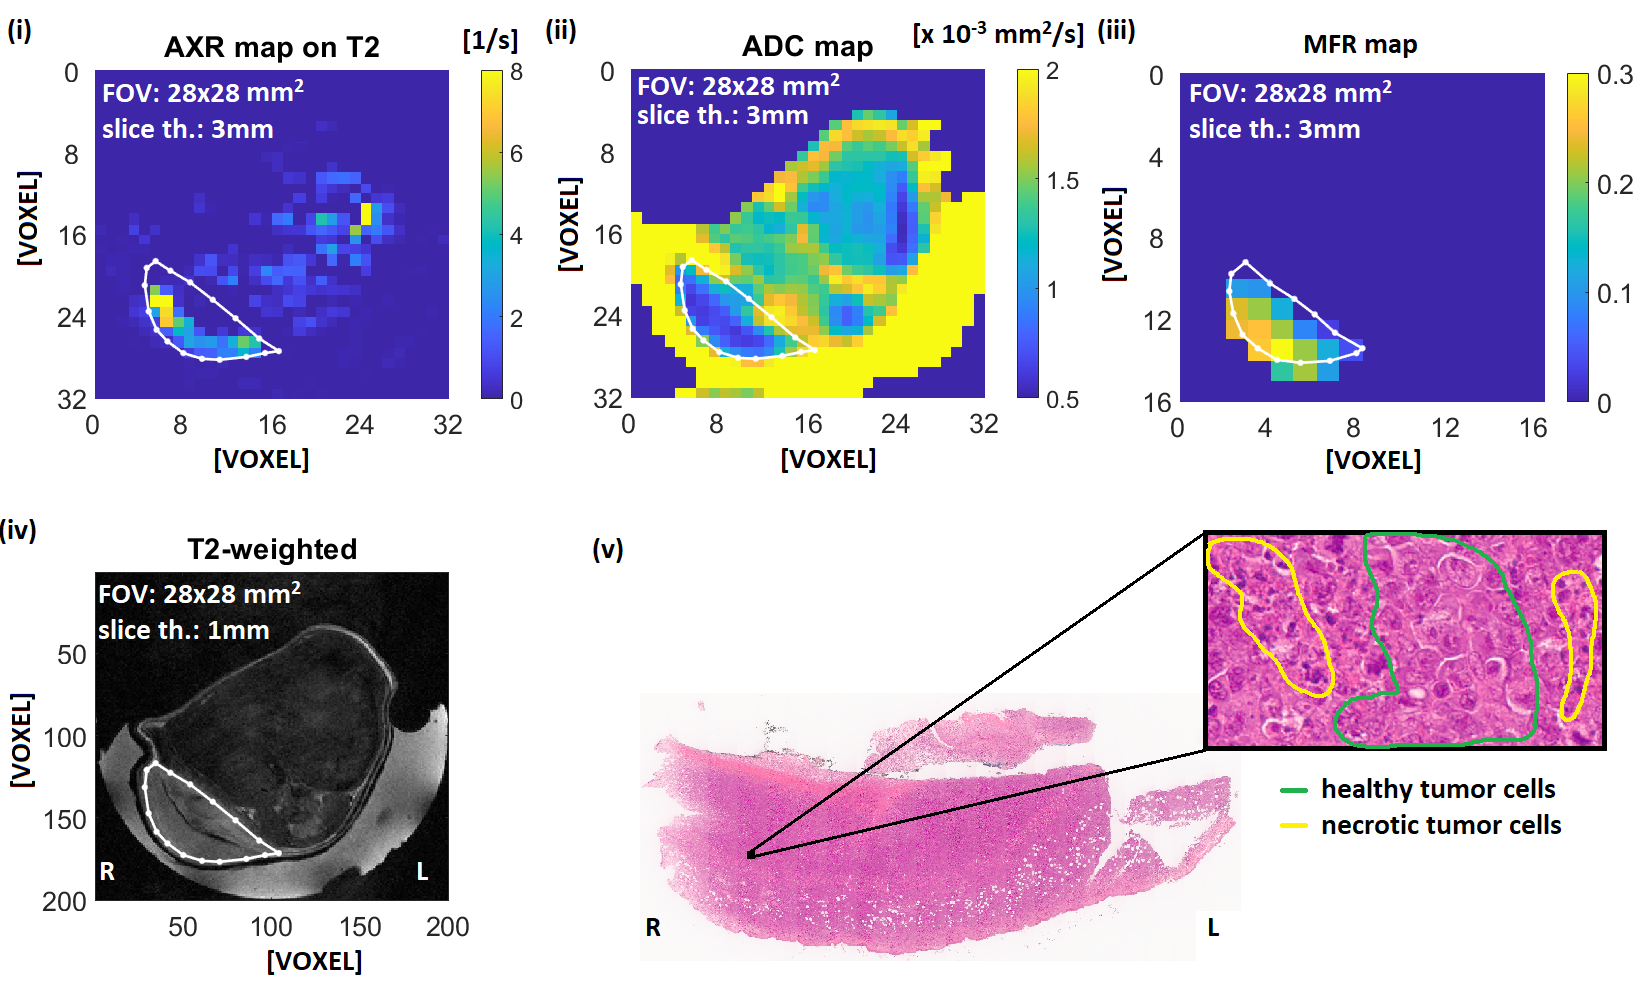
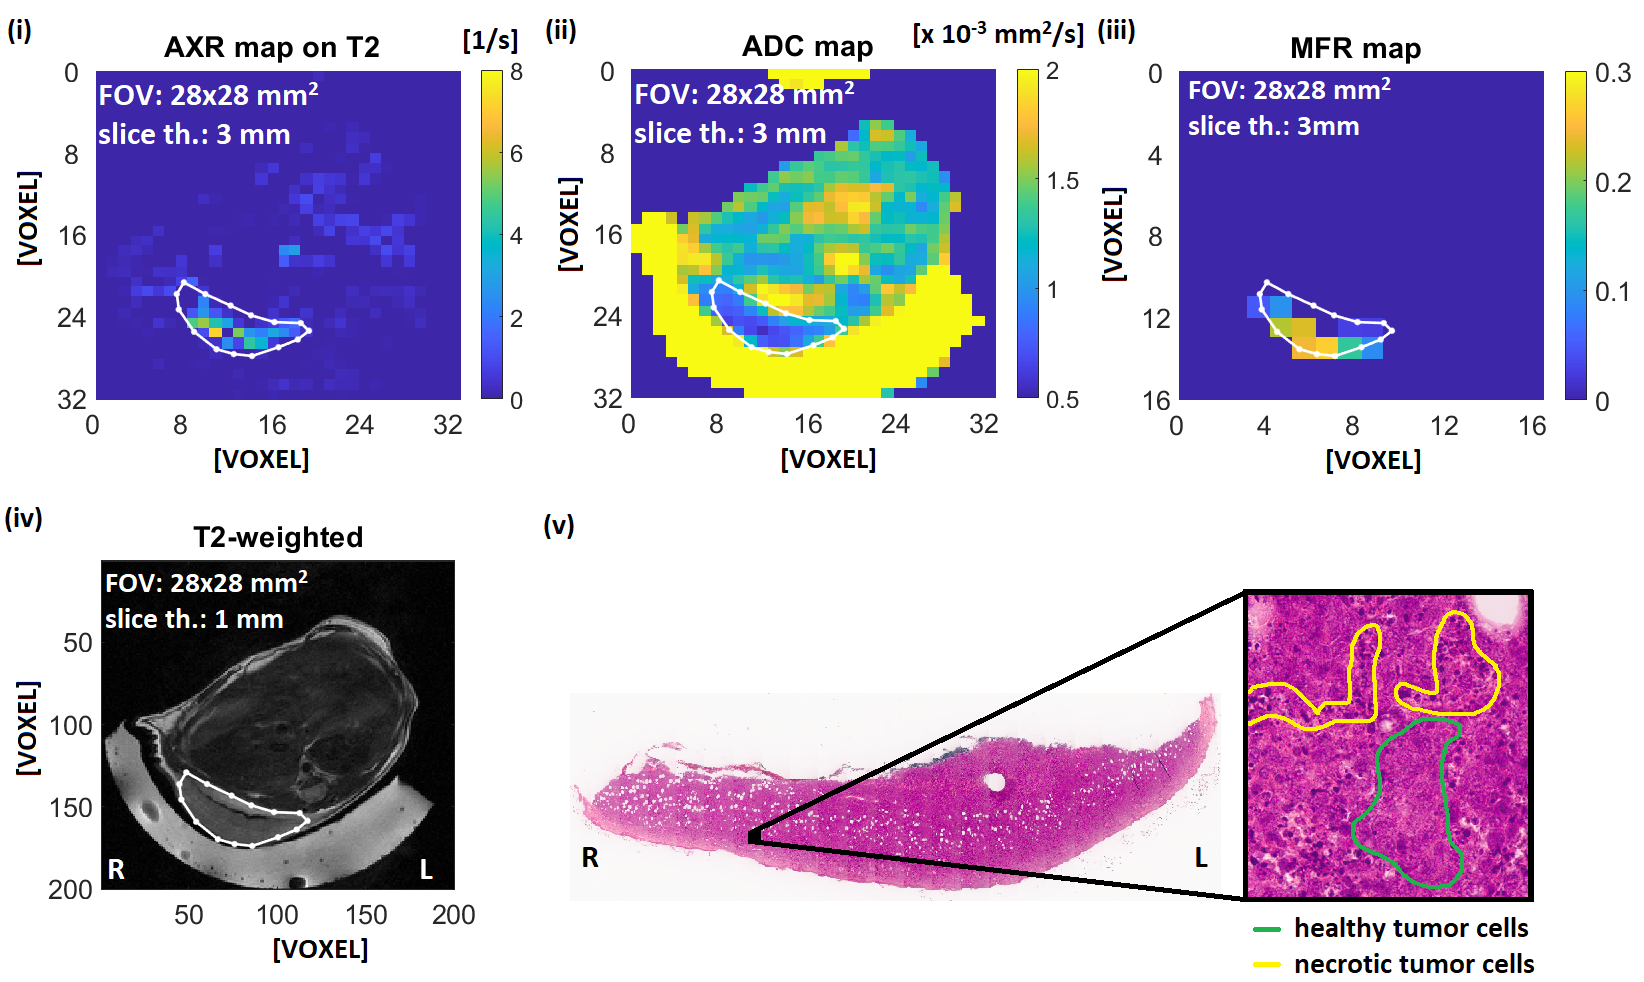
Figures 3 and 4 show representative solid EL4 lymphoma tumors. H&E images show densely intermingled regions of necrotic and viable tissue clusters of diffuse necrosis, approximate scale 0.04 mm2, in the solid tumor region that are much smaller than imaging voxels. Accordingly, in vivo image voxels represent mixtures of both. Corresponding voxel values [Fig. 5] show positive correlation between AXR and MFR, and higher and more-variable MFR and AXR at lower ADCs.
Discussion
It has previously been shown in vivo that an increase of ADC occurs after effective treatment12, whereas here we observed in vitro that ADC was stable but AXR increased with percentage of apoptotic, necroptotic, or necrotic cells for all tested treatments. This is consistent with an absence of cellular debris clearance mechanisms mainly present in late stage necrosis, e.g. phagocytosis, in vitro that are present in vivo. This result also demonstrates that changes in AXR are independent of changes in ADC, and will likely precede ADC changes in vivo when assessing therapeutic response.AXR and MFR are both indicators of membrane degradation, which is consistent with their observed positive correlation. Conversely, regions of low ADC are associated with high variability in AXR, which is consistent with variability of cell viability stages in small tumor regions that do not yet lead to ADC increase.
Conclusion
In vitro, AXR but not ADC is sensitive to apoptotic, necroptotic, or necrotic cell death. In vivo, in EL4 lymphoma with clusters of necrotic and viable tumor cells, both AXR and MFR increased with decreasing ADCs, and AXR variability was high for low ADCs. Since FEXI is based on widely available 1H MRI DWI protocols and does not require exogenous imaging agents, it has high potential to be translated into a clinical evaluation tool to assess early treatment response that induces changes in membrane permeability.Acknowledgements
We thank Sandra Sühnel for the technical assistance. The present work was supported by the Deutsche Forschungsgemeinschaft (DFG, German Research Foundation – 391523415, SFB 824).References
1. Galluzzi L, Vitale I, Aaronson SA, et al. Molecular mechanisms of cell death: recommendations of the Nomenclature Committee on Cell Death 2018. Cell Death Differ. 2018;25(3):486–541.
2. Nilsson M, Lätt J, Westen D, et al. Noninvasive mapping of water diffusional exchange in the human brain using filter-exchange imaging. Magn Reson Med. 2013; 69(6): 1573–1581.
3. Lasič S, Nilsson M, Lätt J, et al. Apparent exchange rate mapping with diffusion MRI. Magn Reson Med. 2011; 66(2):356-65.
4. Aslund I, Nowacka A, Nilsson M, et al. Filter-exchange PGSE NMR determination of cell membrane permeability. Magn Reson Med. 2009; 200(2):291-5.
5. Schilling F, Ros S, et al., 2017, MRI measurements of reporter-mediated increases in transmembrane water exchange enable detection of a gene reporter. Nat Biotechnol. 2017; 35(1):75-80.
6. Ferdia AG, Mikko IK, De-En H, et al. Production of hyperpolarized [1,4-13C2]malate from [1,4-13C2]fumarate is a marker of cell necrosis and treatment response in tumors. PNAS. 2009; 106(47):19801-19806.
7. Patra M, Salonen E, Terama E, et al. Under the influence of alcohol: the effect of ethanol and methanol on lipid bilayers. Biophys J. 2006;90(4):1121-35.
8. Brumatti G, Ma C, Lalaoui N, , et al. The caspase-8 inhibitor emricasan combines with the SMAC mimetic birinapant to induce necroptosis and treat acute myeloid leukemia. Sci Transl Med. 2016; 8(339):339–ra369.
9. Vu M, Kassouf N, Ofili R, et al. Doxorubicin selectively induces apoptosis through the inhibition of a novel isoform of Bcl‑2 in acute myeloid leukaemia MOLM‑13 cells with reduced Beclin 1 expression. Int J Oncol. 2020; 57(1):113-121.10.
10. Wallberg F, Tenev T, Meier P. Analysis of Apoptosis and Necroptosis by Fluorescence-Activated Cell Sorting. Cold Spring Harb Protoc. 2016; 2016(4):pdb.prot087387.
11. Crowley LC, Marfell BJ, Scott AP, et al. Quantitation of Apoptosis and Necrosis by Annexin V Binding, Propidium Iodide Uptake, and Flow Cytometry. Cold Spring Harb Protoc. 2016; 2016(11):10.1101.
12. Galban CJ, Hoff BA, Chenevert TL, et al. Diffusion MRI in early cancer therapeutic response assessment. NMR Biomed. 2017; 30:e3458.
Figures