5306
Univariate and multivariate individual-specific tract-based spatial statistics (iTBSS) for white matter microstructure anomaly detection1Medical Physics, University of Wisconsin - Madison, Madison, WI, United States, 2Department of Physics, The Clatterbridge Cancer Centre NHS Foundation Trust, University of Liverpool, Liverpool, United Kingdom, 3Pediatrics, University of Wisconsin - Madison, Madison, WI, United States
Synopsis
Keywords: Neuro, Traumatic brain injury, Precision Medicine
Tract-based spatial statistics (TBSS) is a voxel-based analysis (VBA) method for diffusion MRI (dMRI) data along a skelentonized representation of the brain white matter. When applied to group-level analyses of dMRI data, TBSS has been shown to improve sensitivity, objectivity, and interpretability. In this work, we introduce individual-specific tract-based spatial statistics for anomaly detection in white matter micro-structure. Results from implementation on severe pediatric TBI brains reveal heterogenous patterns of atypical white matter.Introduction
The study of heterogeneous neurological conditions such as traumatic brain injury (TBI), requires consideration individual variability in quantitative diffusion MRI (dMRI) measures. One way to achieve this is to study deviations of an individual from a normative distribution of control subjects. In the case of multidimensional data, it may be appropriate to consider multivariate measures of deviation like the Mahalanobis distance1, which have been shown useful in characterizing atypical observations in multidimensional datasets2–6. Thus, in this work we introduce an individual-specific TBSS (iTBSS) based framework for both univariate z-score and multivariate Mahalanobis distance analyses for anomaly detection of white matter microstructure. We applied the iTBSS framework on children with severe TBI.Methods
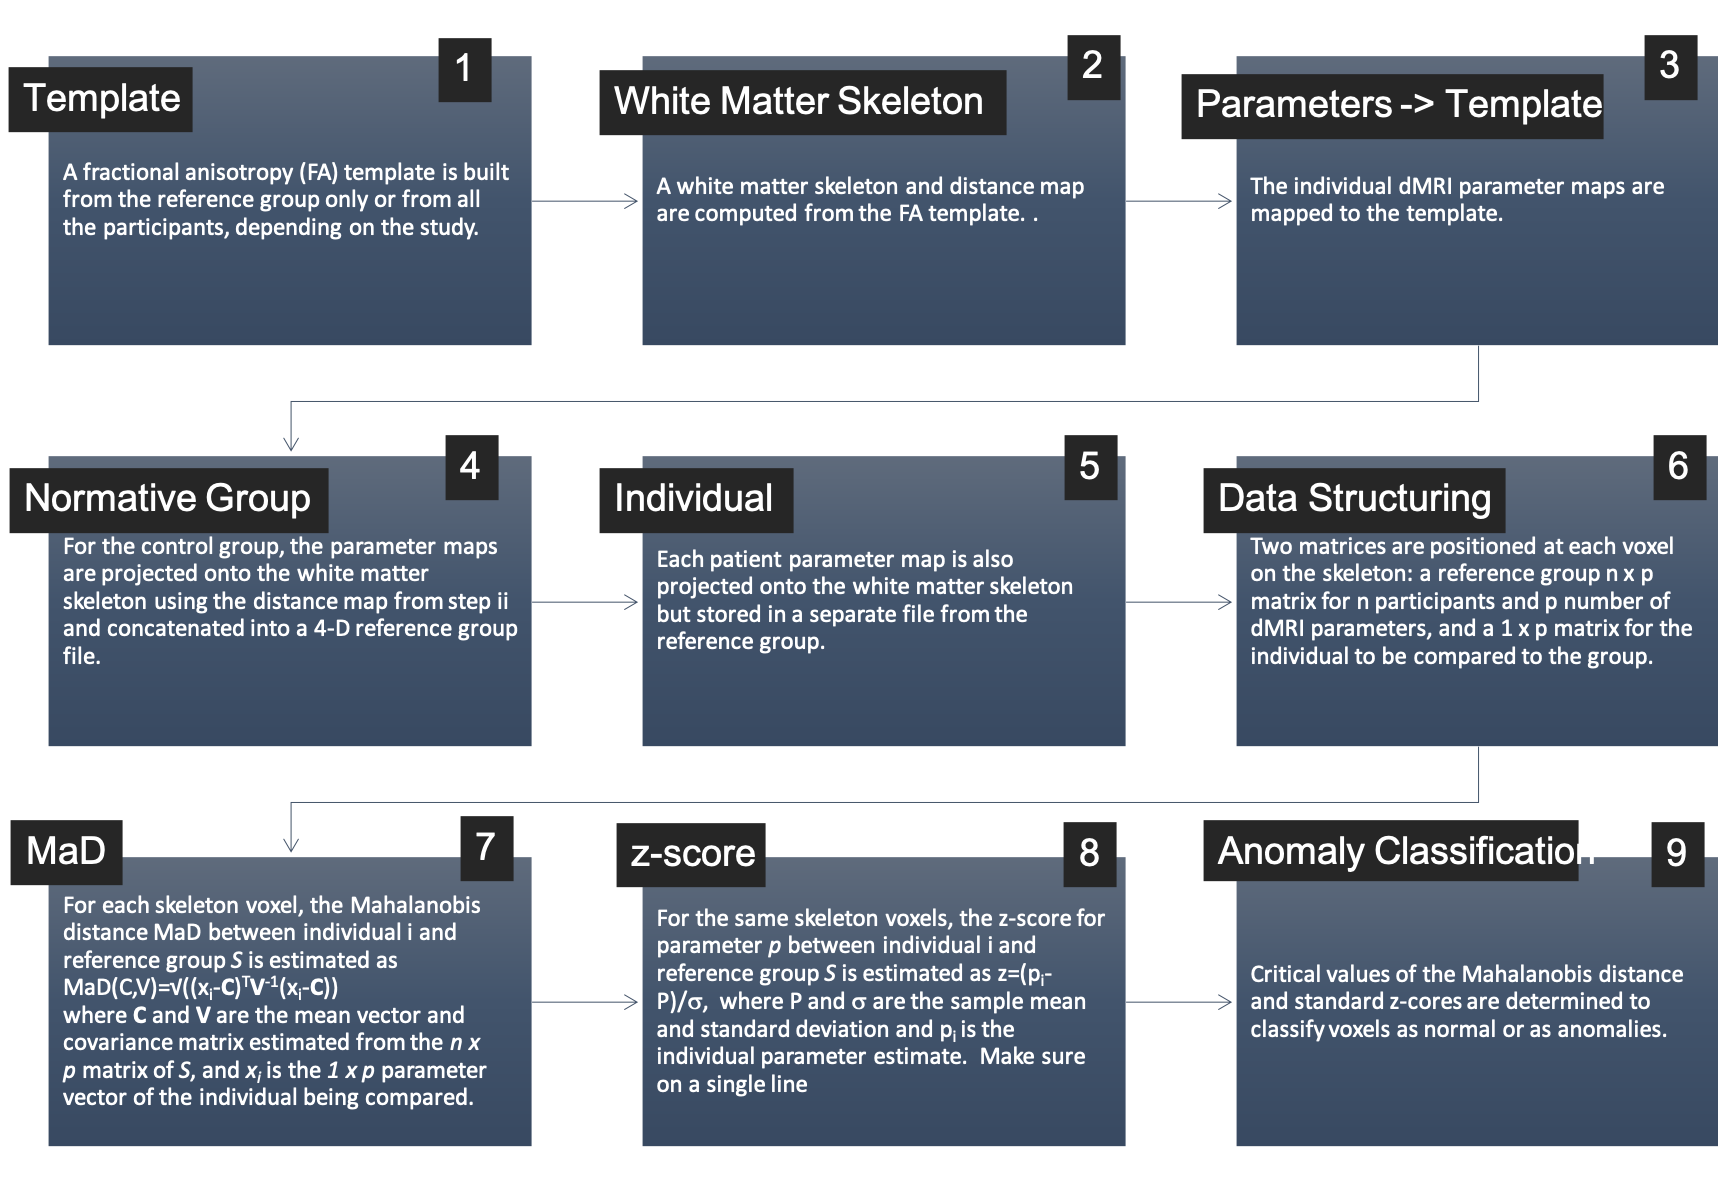
The iTBSS workflow is shown in Figure 1. This was implemented to study 21 severe TBI patients (ages:9-18 years). Patients and a group of 49 typically developing (TD) controls (ages:9-18 years) underwent DTI collected across multiple centers/scanners using a standardized imaging protocol (b=1300s×mm-2 along 64 directions, 8 volumes with b=0, and 2.5mm isotropic resolution). dMRI data were processed to minimize noise7,8 Gibbs ringing9, and artifacts from motion, eddy currents10–12 and EPI distortions. Subsequently, dMRI scans were spatially aligned and upsampled to anatomical T1-weighed images for further processing using the Ti-Di fusing approach13. Diffusion tensors were estimated using the RESTORE algorithm with the diffusion imaging in python (DIPY) software package14. Tensor mean, radial, and axial diffusivities (MD,RD,AD) and FA were used as the multidimensional input in computing the Mahalanobis Distance. For the iTBSS workflow in Figure 1, ANTs15 was used for steps 1 and 3, where the FA template was built from the 49 control subjects only. Conventional TBSS16 in FSL17 was used for steps 2, 4, and 5, and in-house Matlab code was used for steps 6, 7, and 8. In addition to the TBI patients, MaD and standard z-scores were also computed for each of the controls in a leave-one-out approach. Then, critical values were computed for each deviation score as the 99th percentile in the reference group. One-tailed for MaD and two-tailed for the z-scores. Parametric MaD and z-score maps were thresholded at the critical values. The resulting maps were further thresholded for cluster size at 20 contiguous voxels.Results
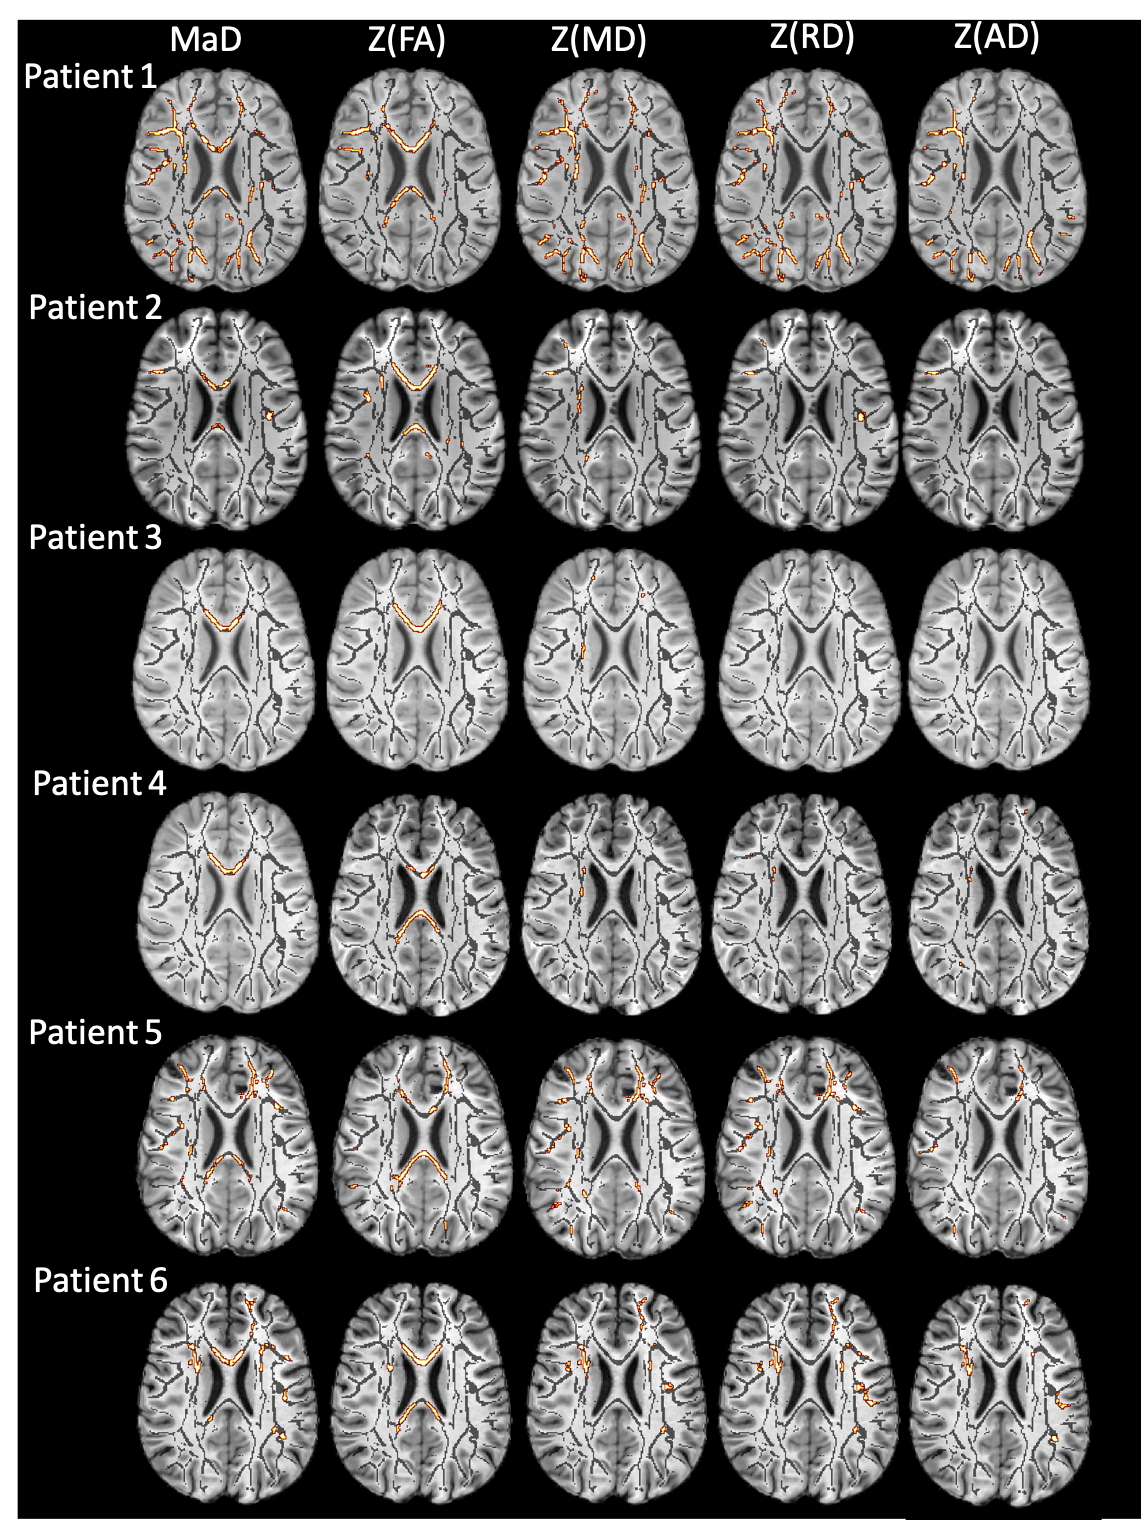
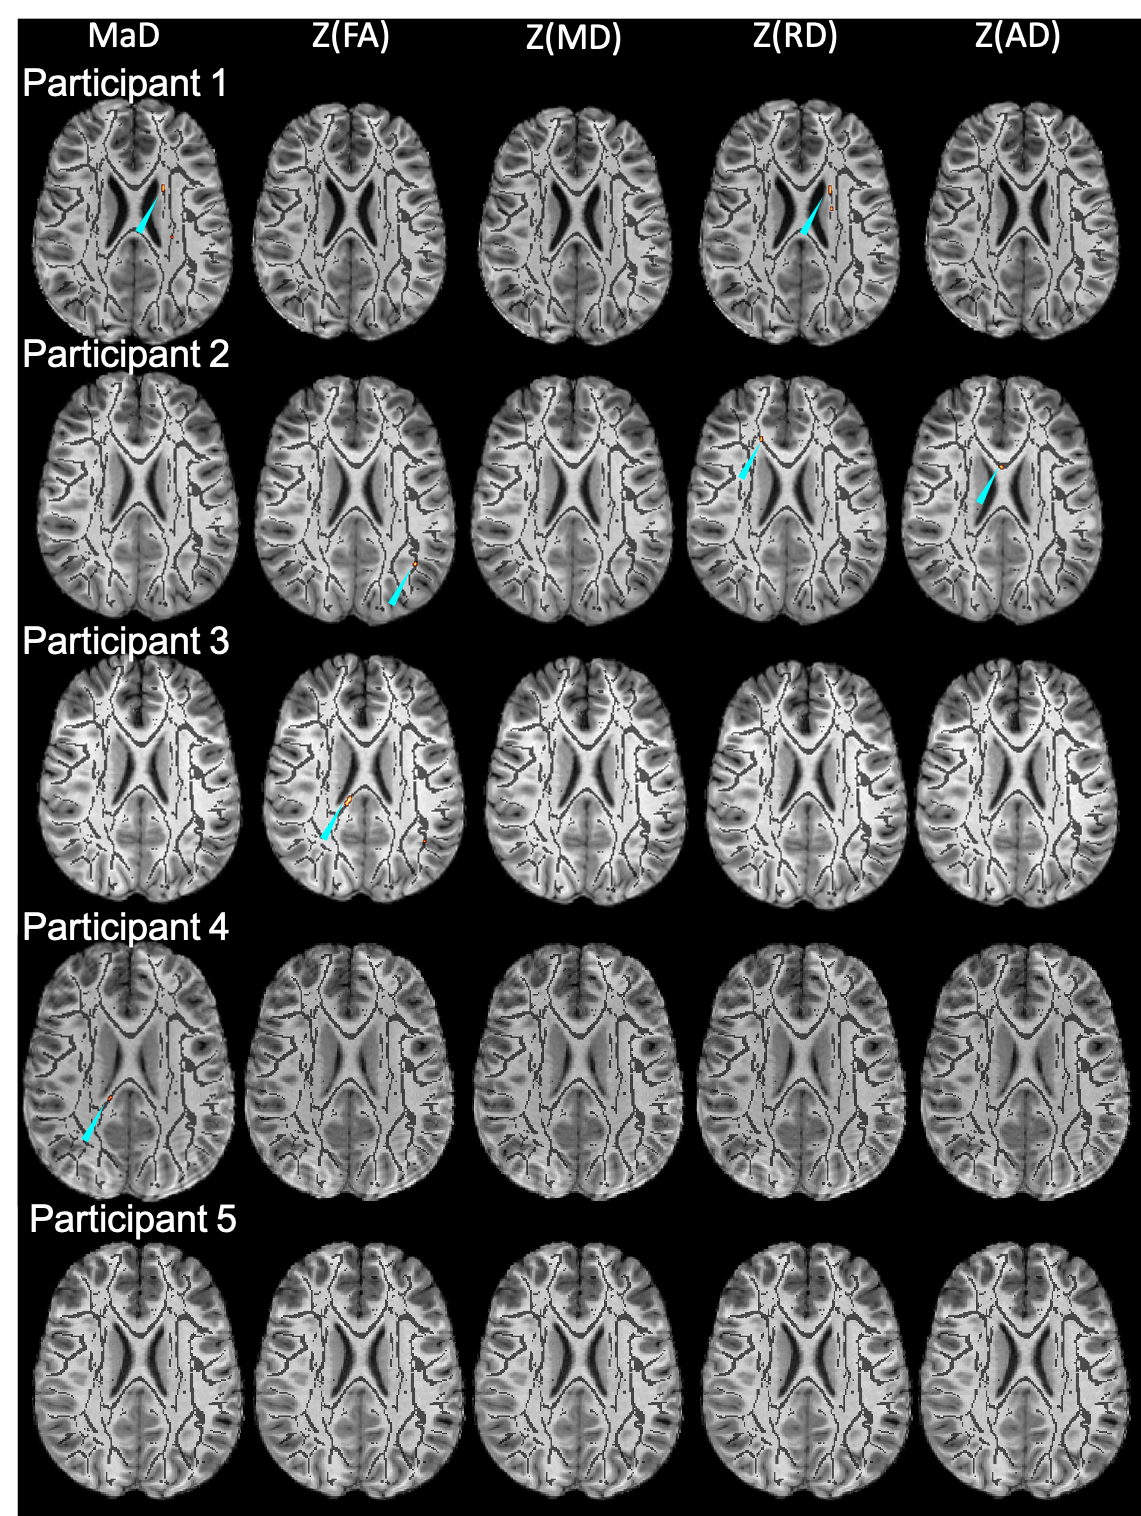
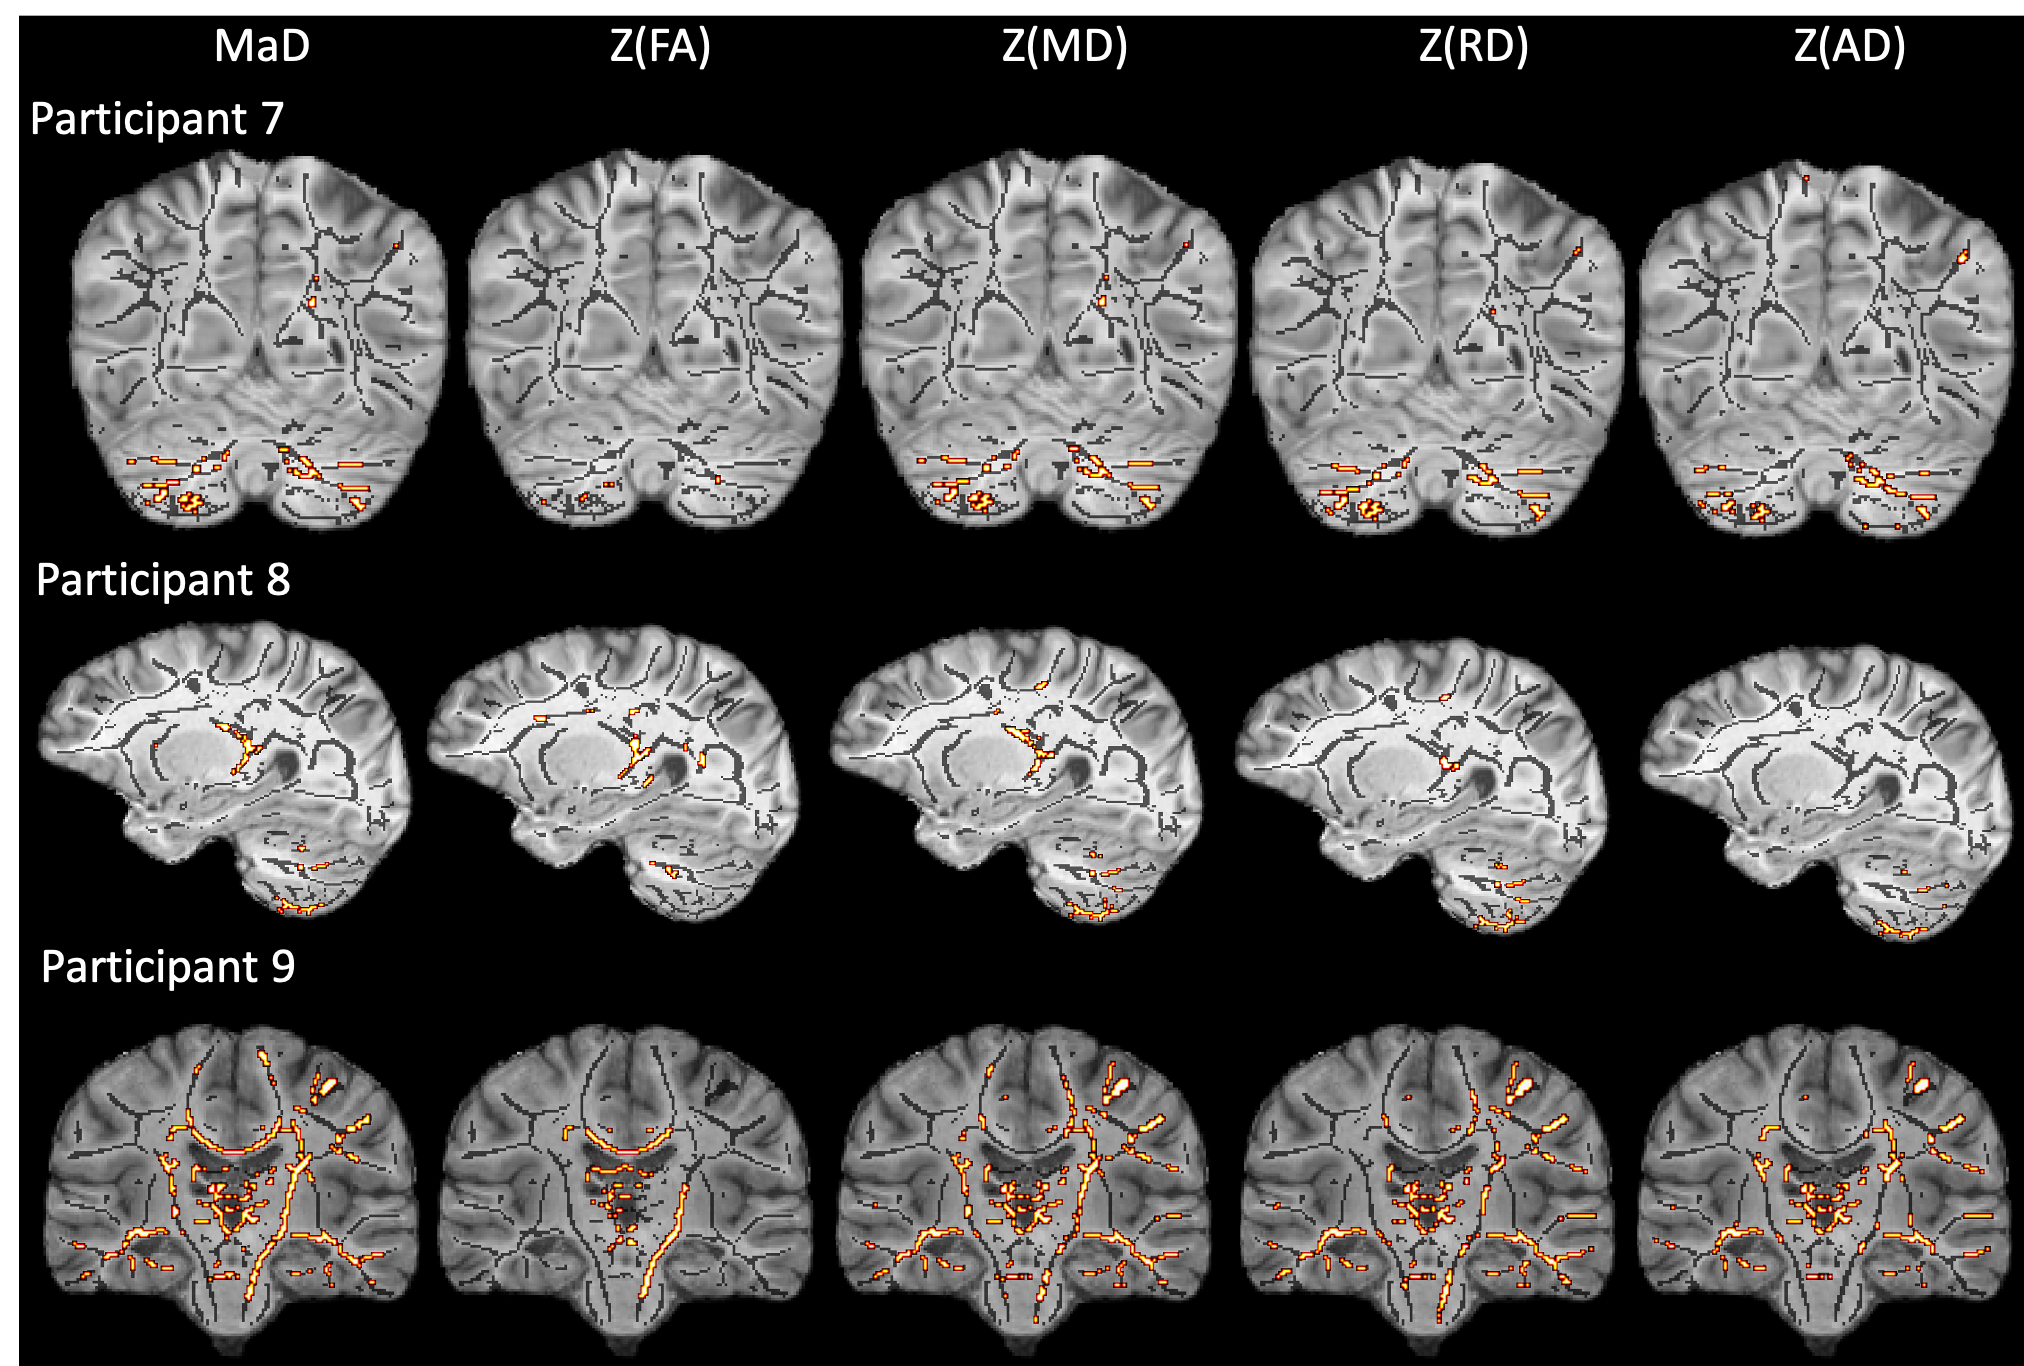
Figures 1 & 2 show the distributions of MaD and z-scores over the white matter skeleton for all participants before thresholding. Examples of microstructural anomaly maps resulting from univariate and multivariate iTBSS are shown in Figures 3 (six TBI patients) and Figure 4 (5 TD participants). The same axial slice of the white matter skeleton in the template space is shown for all individuals in both figures. The results are overlaid on the individual T1-weighted image to better show the brain anatomy. The TBI results reveal heterogenous patterns of voxels flagged as atypical, while the TD maps show minimal abnormalities. The univariate z-score anomaly maps for MD, RD and AD largely overlap with one another, whereas the FA results often differ. Conversely, the anomaly maps from multivariate iTBSS appear to encompass the general region of voxels flagged by all of the univariate-based maps. The heterogeneity of abnormal microstructure patterns is further highlighted in the maps shown for three additional TBI patients in Figure 5. This heterogeneity is a persistent trend across the TBI cohort. A common result in many of the TBI cases is that the corpus callosum is flagged as abnormal in both FA and MaD anomaly maps. This trend is consistent with other TBI studies that found alterations in dMRI measures of the corpus callosum18,19. It also supports predictions that the corpus callosum undergoes greater shearing forces during head trauma due to its location and size20. This is important as damage to the corpus callosum has been related to global neurologic dysfunction21.Discussion
Individual-specific TBSS allows for comparing one individual to a reference group along major white-matter pathways both with single- and multi-dimensional data. Implementation on TBI affected brains revealed widespread and heterogenous patterns of atypical white matter voxels compared to controls. Future work will include correcting MaD and z-score estimates for sample-size-related biases and age effects in the dMRI measures. Age dependence will impact the characteristics of the normative group distribution by adding to the variance and modelling out those effects may improve the sensitivity of the method. Future work will investigate these results in the context of clinical and cognitive outcomes associated with pediatric severe TBI. The iTBSS framework will also be interesting to investigate individual anomalies in other populations including autism, multiple sclerosis, and neoplasia.Acknowledgements
Support for this work was provided by the UW-Madison Office of the Vice Chancellor for Research, the Wisconsin Alumni Research Foundation, and NIH grant RO1 NS092870 (Ferrazzano). This study was also supported in part by a core grant to the Waisman Center from the National Institute of Child Health and Human Development P50HD105353. JG’s effort was supported in part by the Medical Physics Radiological Sciences Training Grant NIH T32 CA009206. The content is solely the responsibility of the authors and does not necessarily represent the official views of the National Institutes of Health.
References
1. Mahalanobis, P. C. On the generalized distance in statistics. Natl. Inst. Sci. India II, (1936).
2. Dean, D. C. et al. Multivariate characterization of white matter heterogeneity in autism spectrum disorder. NeuroImage Clin. 14, 54–66 (2017).
3. Guerrero, J. M., Adluru, N., Dean, D. C. & Alexander, A. L. Voxel-wise Mahalanobis Distance (MaD-Vox): a multivariate approach to single subject analysis. in Proc. Int. Soc. Magn. Reson. Med. (2018).
4. Guerrero, J. M., Ferrazzano, P. & Alexander, A. L. Mahalanobis Distance Tractometry (MaD-Tract) for Multivariate Analyses. in Proc. Int. Soc. Magn. Reson. Med. -Accepted (2020).
5. Guerrero-Gonzalez, J. et al. Mahalanobis distance tractometry (MaD-Tract) – a framework for personalized white matter anomaly detection applied to TBI. NeuroImage 260, 119475 (2022).
6. Gyebnár, G. et al. Personalized microstructural evaluation using a Mahalanobis-distance based outlier detection strategy on epilepsy patients’ DTI data – Theory, simulations and example cases. PLOS ONE 14, e0222720 (2019).
7. Veraart, J. et al. Denoising of diffusion MRI using random matrix theory. NeuroImage 142, 394–406 (2016).
8. Veraart, J., Fieremans, E. & Novikov, D. S. Diffusion MRI noise mapping using random matrix theory: Diffusion MRI Noise Mapping. Magn. Reson. Med. 76, 1582–1593 (2016).
9. Kellner, E., Dhital, B., Kiselev, V. G. & Reisert, M. Gibbs-ringing artifact removal based on local subvoxel-shifts: Gibbs-Ringing Artifact Removal. Magn. Reson. Med. 76, 1574–1581 (2016).
10. Andersson, J. L. R. & Sotiropoulos, S. N. An integrated approach to correction for off-resonance effects and subject movement in diffusion MR imaging. NeuroImage 125, 1063–1078 (2016).
11. Andersson, J. L. R. et al. Towards a comprehensive framework for movement and distortion correction of diffusion MR images: Within volume movement. NeuroImage 152, 450–466 (2017).
12. Andersson, J. L. R., Graham, M. S., Zsoldos, E. & Sotiropoulos, S. N. Incorporating outlier detection and replacement into a non-parametric framework for movement and distortion correction of diffusion MR images. NeuroImage 141, 556–572 (2016).
13. Guerrero-Gonzalez, J. et al. Improving Imaging of the Brainstem and Cerebellum in Autistic Children: Transformation-Based High-Resolution Diffusion MRI (TiDi-Fused) in the Human Brainstem. Front. Integr. Neurosci. 16, 804743 (2022).
14. Garyfallidis, E. et al. Dipy, a library for the analysis of diffusion MRI data. Front. Neuroinformatics 8, (2014).
15. Avants, B. B., Epstein, C. L., Grossman, M. & Gee, J. C. Symmetric diffeomorphic image registration with cross-correlation: evaluating automated labeling of elderly and neurodegenerative brain. Med. Image Anal. 12, 26–41 (2008).
16. Smith, S. M. et al. Tract-based spatial statistics: Voxelwise analysis of multi-subject diffusion data. NeuroImage 31, 1487–1505 (2006).
17. Jenkinson, M., Beckmann, C. F., Behrens, T. E. J., Woolrich, M. W. & Smith, S. M. FSL. NeuroImage62, 782–790 (2012).
18. Rutgers, D. R. et al. Diffusion Tensor Imaging Characteristics of the Corpus Callosum in Mild, Moderate, and Severe Traumatic Brain Injury. Am. J. Neuroradiol. 29, 1730–1735 (2008).
19. Wang, J. Y. et al. Diffusion Tensor Tractography of Traumatic Diffuse Axonal Injury. Arch. Neurol. 65, (2008).
20. Ghajari, M., Hellyer, P. J. & Sharp, D. J. Computational modelling of traumatic brain injury predicts the location of chronic traumatic encephalopathy pathology. Brain 140, 333–343 (2017).
21. Kraus, M. F. et al. White matter integrity and cognition in chronic traumatic brain injury: a diffusion tensor imaging study. Brain 130, 2508–2519 (2007).
Figures

White matter skeleton histograms of the deviation scores. Right panel: Distribution of Mahalanobis distance values between an individual and the reference TD group for voxels in the white matter skeleton. The Mahalanobis distance was computed from set of diffusion tensor measures consisting of fractional anisotropy (FA), mean diffusivity (MD), radial diffusivity (RD), and axial diffusivity (AD). Left panel: Distributions of diffusion tensor parameter z-scores between an individual and the reference TD group for voxels in the white matter skeleton.