5304
Comparing Volumetric to 2D Methods in Assessing Post-treatment Response of Different Pediatric Low-Grade Glioma (pLGG) Tumor Components1Department of Radiology, Yale School of Medicine, New Haven, CT, United States, 2University of Leipzig, Leipzig, Germany, 3ETH Zurich, Zurich, Switzerland, 4Department of Radiology, University of Pennsylvania, Philadelphia, PA, United States, 5Department of Neurology, Neurosurgery, and Pediatrics, UCSF, San Francisco, CA, United States, 6Harvard Medical School, Boston, MA, United States, 7NYU Langone Medical Center, New York, NY, United States
Synopsis
Keywords: Neuro, Tumor, Volumetrics
Accurate response assessment is critical in pediatric low-grade glioma (pLGG) as there is significant morbidity associated with continued treatment. Current standards for assessment rely on 2D measurements. Given the heterogenous nature of pLGG, volumetric assessment of treatment response may prove more effective. In this study, we compared 2D and volumetric methods of assessing treatment response in patients from the PNOC-002 clinical trial of pLGG. We analyzed the quantitative differences between 2D and volumetric measurements of tumor volume percent change post-treatment. We also compared classification of treatment response based on application of RANO criteria to various pLGG tumor components.INTRODUCTION
The current standard of response assessment in neuro-oncology uses RANO criteria1. RANO criteria are based on orthogonal measurements of contrast-enhancing tumor. Applying RANO criteria to pediatric low-grade glioma (pLGG) is challenging due to its heterogenous nature. Several studies of adult brain tumors have shown that volumetric measurements outperform 2D methods in determining tumor progression2–4. However, the role of volumetrics in pLGG response assessment has not been extensively studied5–7. Our aim is to compare the agreement between volumetric and 2D methods in assessing pLGG posttreatment response of various tumor components.METHODS
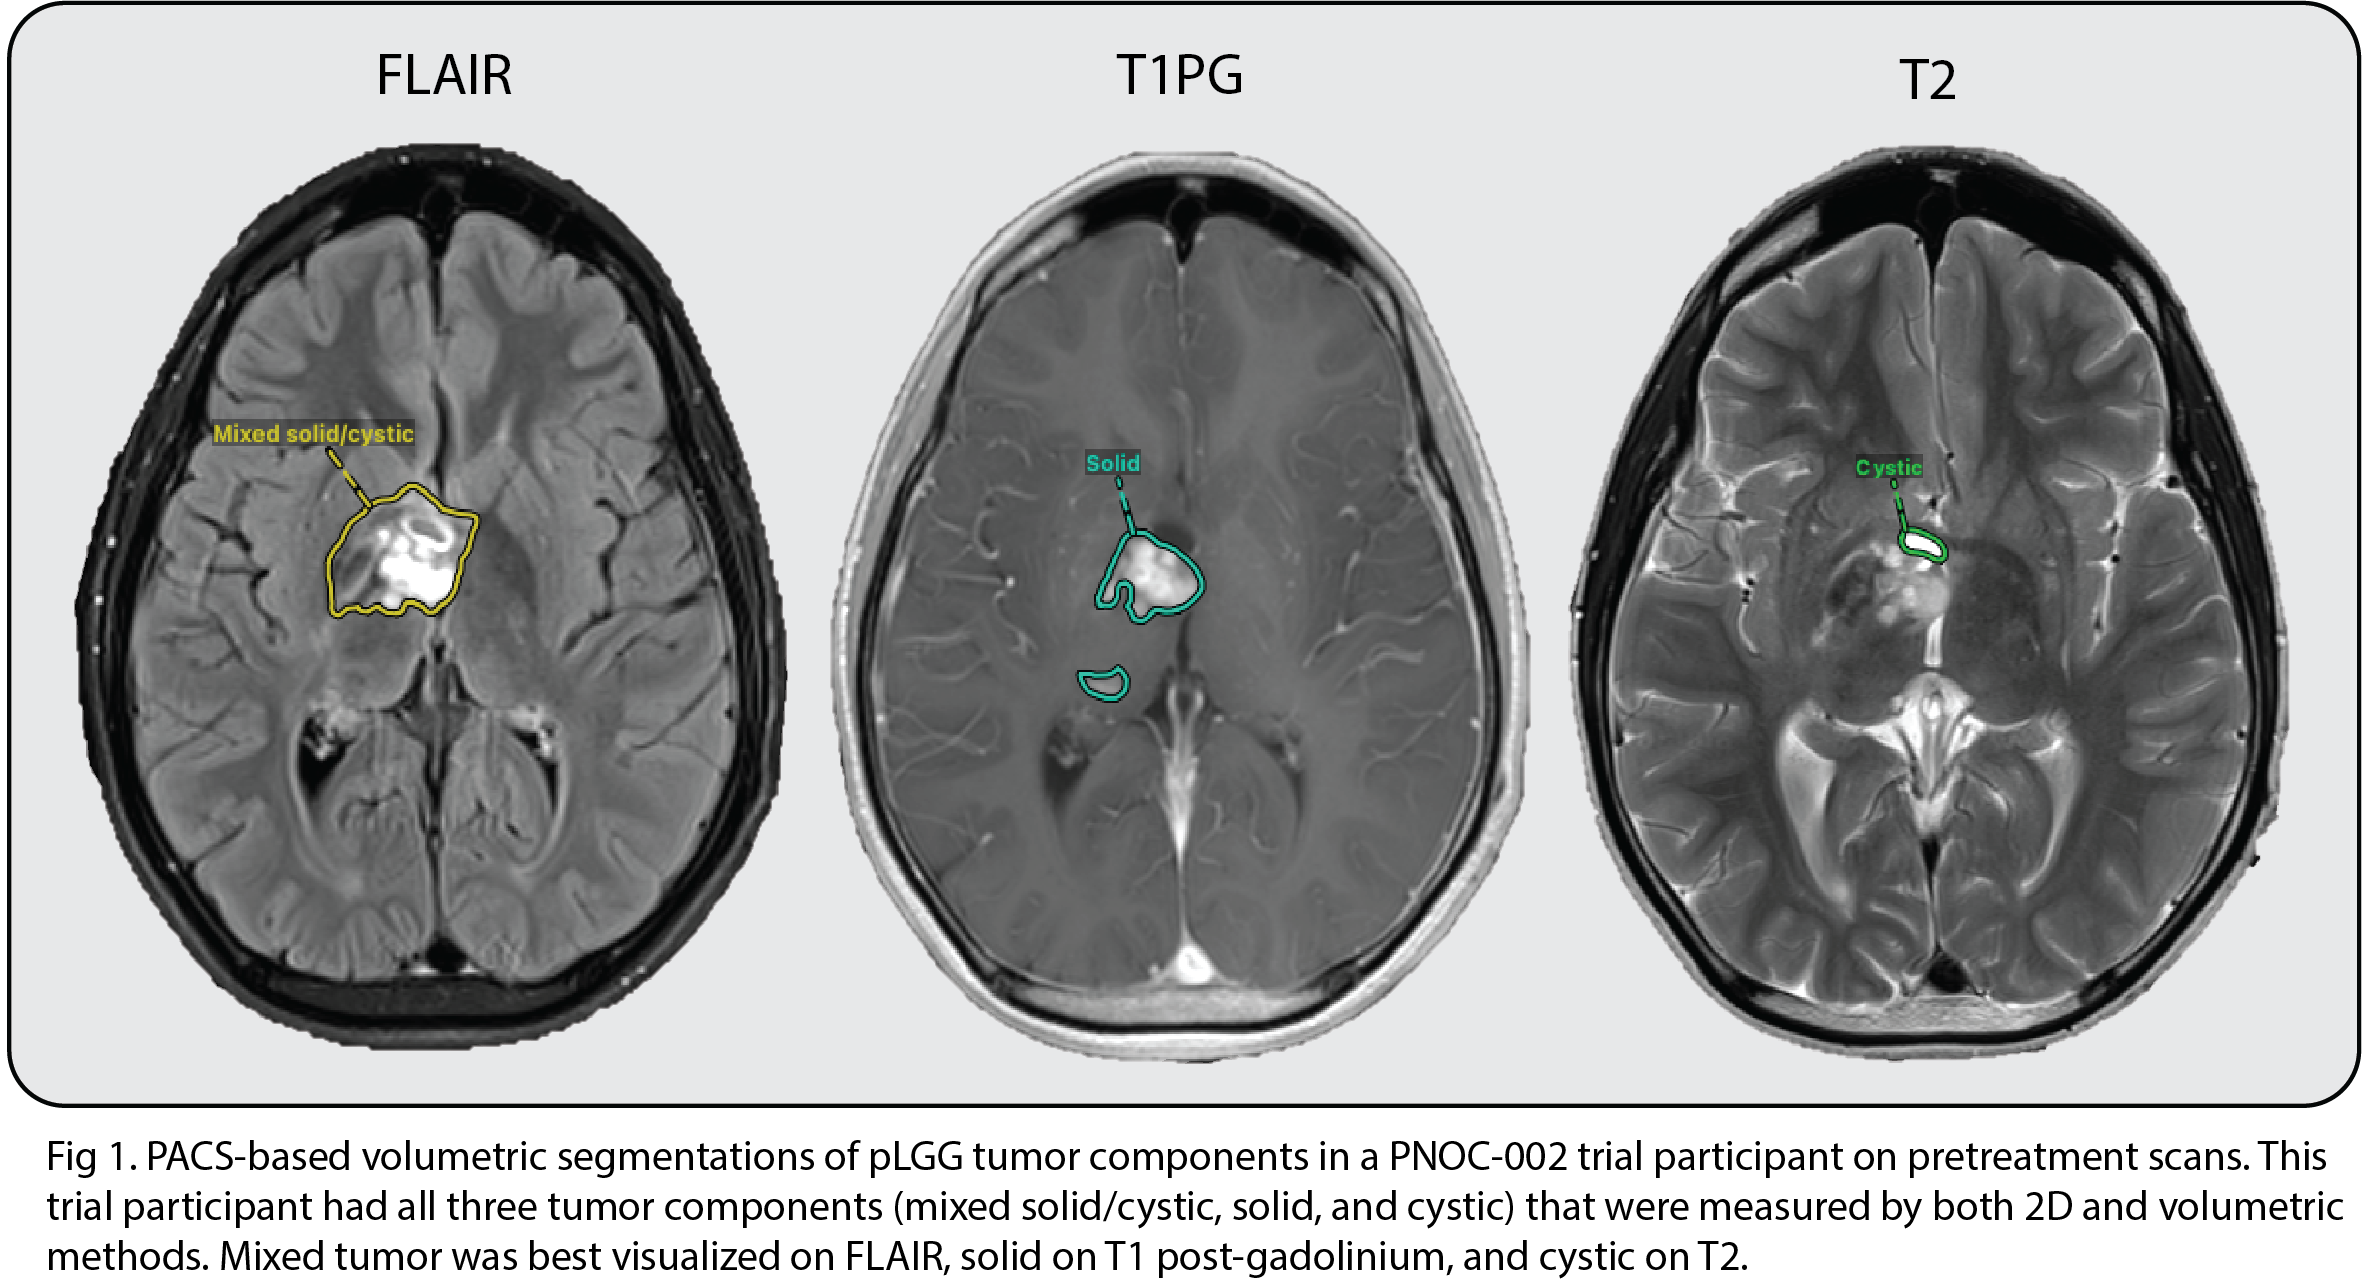
We analyzed MRI scans (T1, T1 post-gadolinium, T2, and FLAIR) from patients enrolled in the Pediatric Neuro-Oncology Consortium (PNOC-002) clinical trial of oral vemurafenib in recurrent/progressive pLGG with BRAFV600E mutation8.We analyzed 99 studies (32 pre-treatment and 67 posttreatment) from 32 trial patients. The average time to follow-up of the 67 posttreatment scans was 8.3 months (SD 4.6), and there were on average 2 follow-up scans per patient around the 6-month and 12-month posttreatment timepoints. Orthogonal measurements of solid, cystic, and mixed solid/cystic tumor components were done by a board-certified neuroradiologist as part of the central imaging review process for the original PNOC-002 trial. We used a PACS-integrated volumetric tool to manually segment 3D solid, cystic, and mixed solid/cystic tumor components on the sequences used for corresponding 2D measurements (Fig 1).
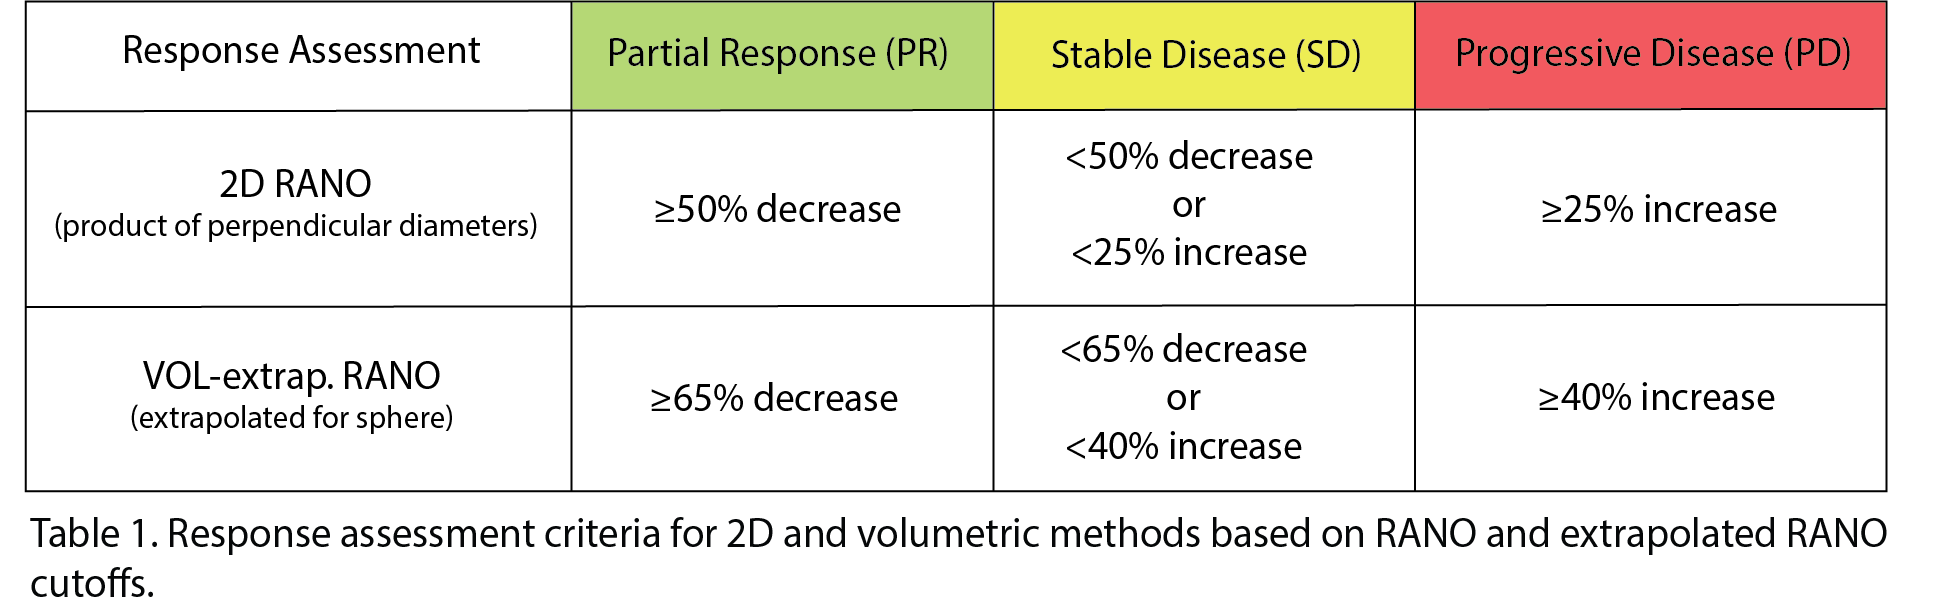
We compared the quantitative agreement between volumetric and 2D measures of absolute percent change in each of the tumor components using intraclass correlation coefficient (ICC) and Bland-Altman plots. We also compared the difference between 2D and volumetric response assessment based on RANO 2D and volume extrapolated cutoffs for the different tumor components (Table 1). Response categories included partial response (PR), stable disease (SD), and progressive disease (PD).
RESULTS
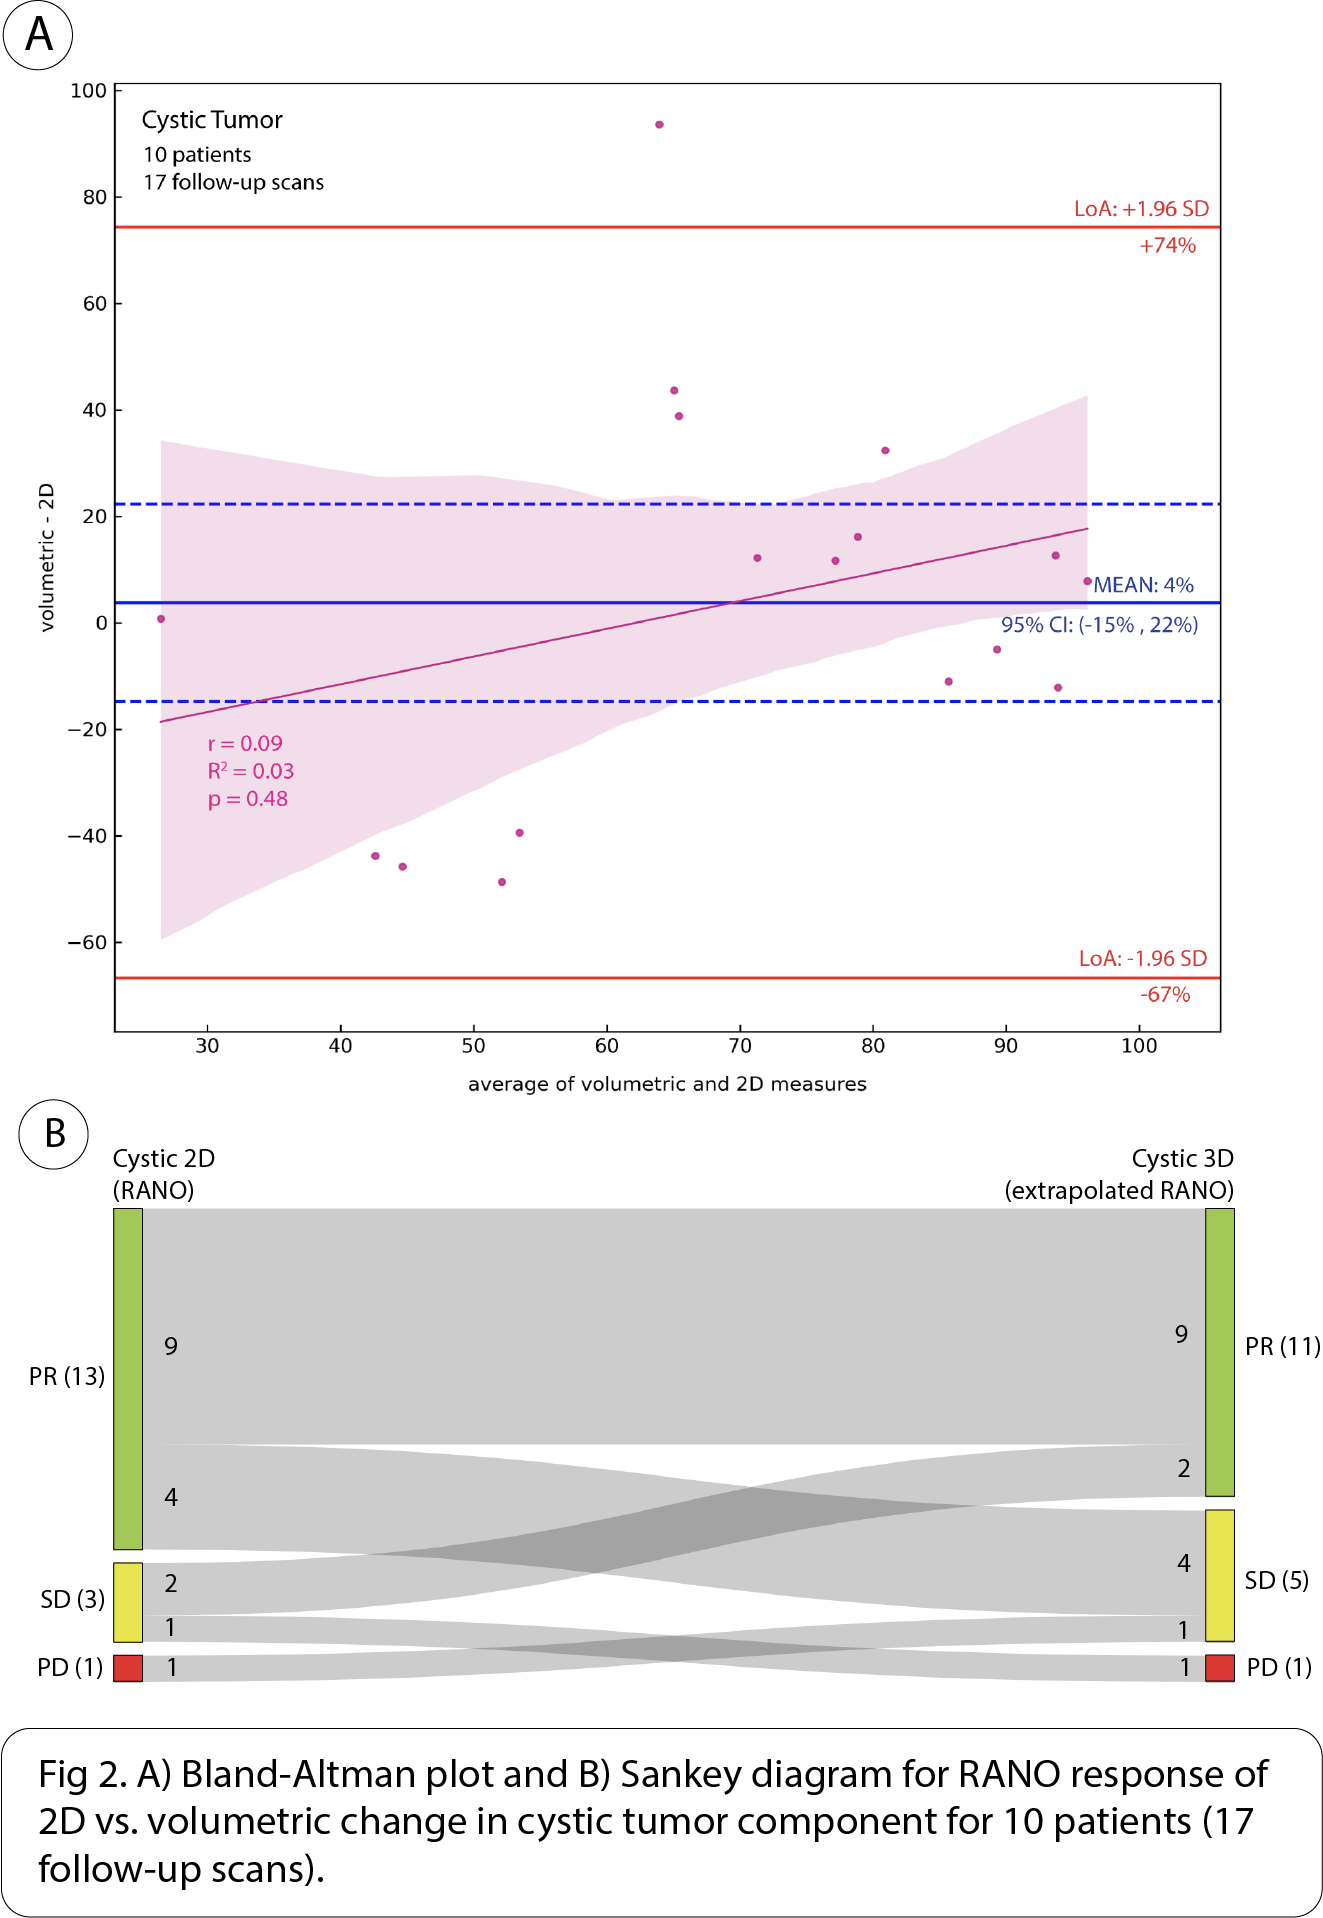
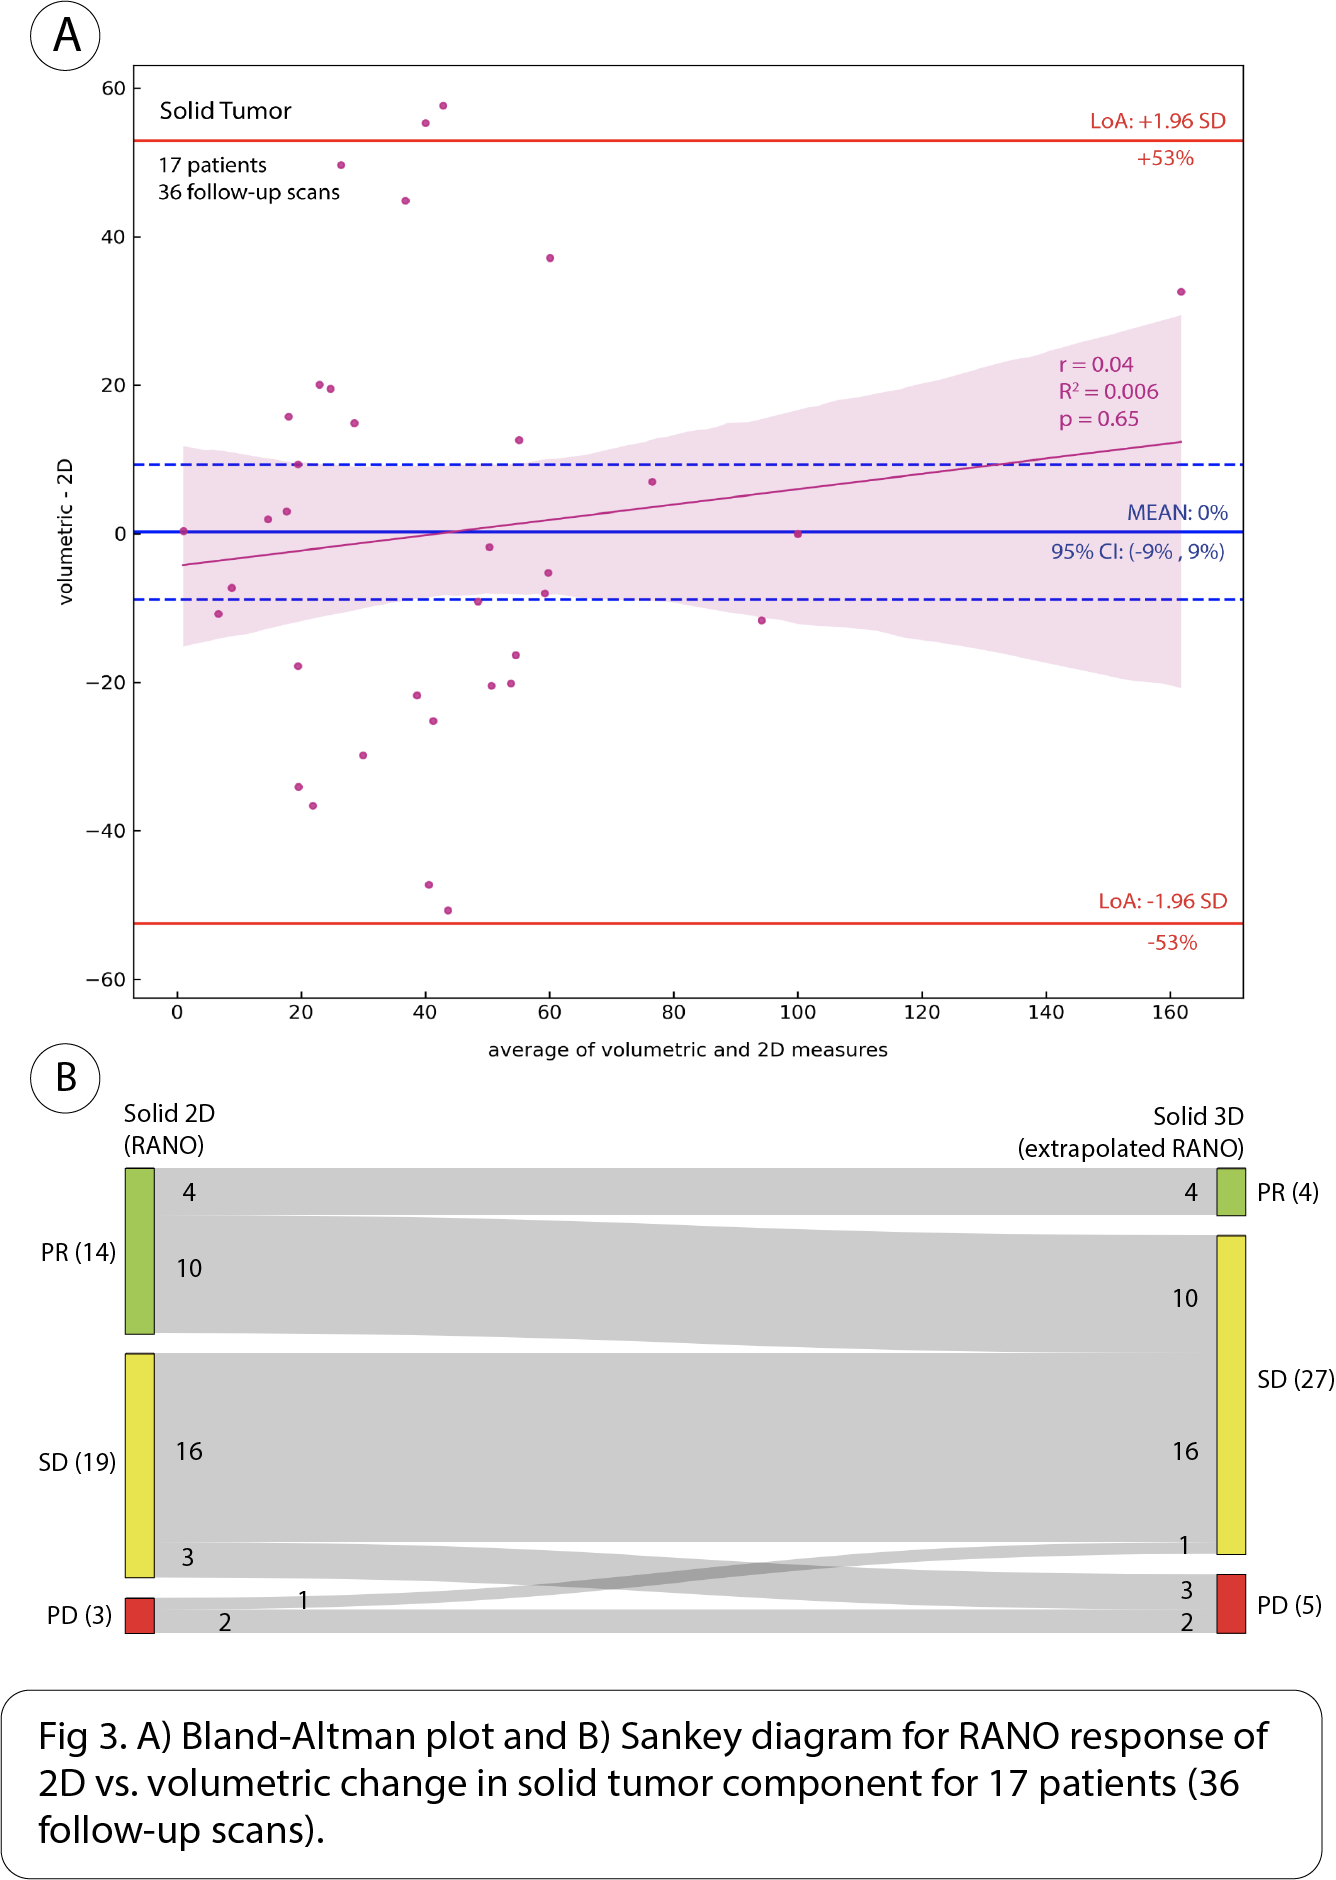
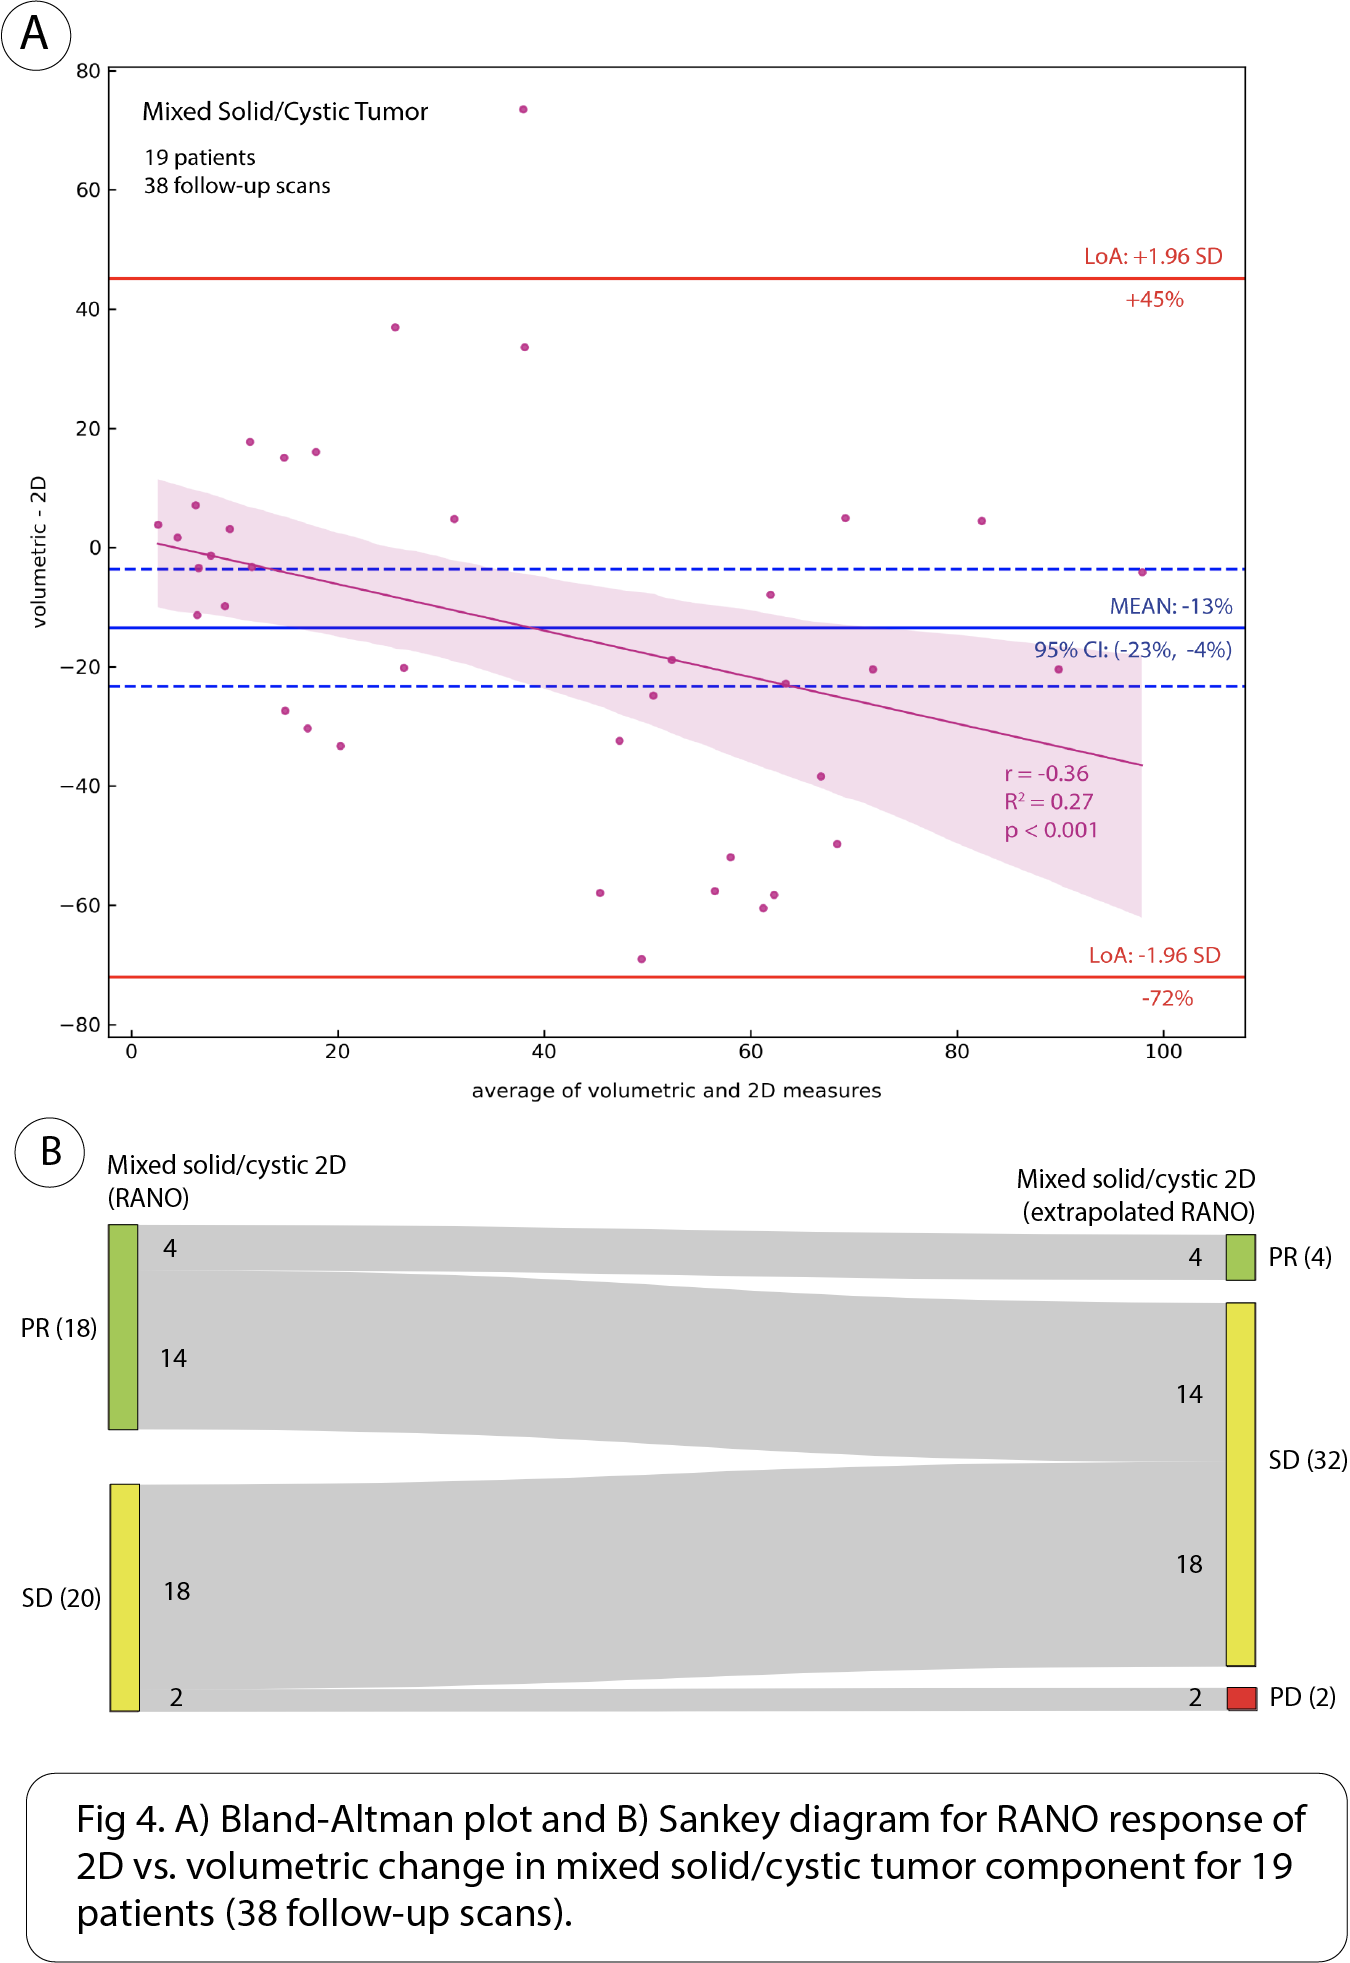
17 patients (36 follow-up scans) had solid tumor component, 10 patients (17 follow-up scans) cystic, and 19 patients (38 follow-up scans) mixed solid/cystic. The following are intraclass correlation coefficient (ICC) with 95% CI between volumetric and 2D methods for measuring absolute percent change in each of the tumor components: solid = 0.74 [0.53, 0.86], mixed solid/cystic = 0.42 [0.09, 0.67], and cystic = 0.12 [-0.39, 0.58]. There was significant bias of -13% (95% CI: [-23%, -4%]) in the mean difference of absolute percent change in mixed solid/cystic tumor between volumetric and 2D methods. Additionally, a significant but weak negative correlation was found between the difference and average of absolute percent change in mixed solid/cystic tumor between methods (Pearson’s r = -0.36, p < .001) (Fig 4A).When considering change in cystic tumor component in assessing response on 17 follow-up scans with cystic tumor, both 2D and volumetric methods were not significantly different. 13/17 (76%) of scans were classified as PR on 2D, and 11/17 (65%) were classified as PR on volumetric (Fig 2B). However, when considering changes in solid tumor component on 36 follow-up scans in which solid tumor was measured distinctly from cystic components, there was a large discrepancy between 2D and volumetrics when classifying scans as PR. While 2D classified 14/36 (39%) of scans as PR, volumetrics only classified 4/36 (11%) of scans as PR. 10/14 (71%) of scans classified as PR by 2D were classified as SD by volumetrics (Fig 3B). When considering changes in mixed solid/cystic tumor on 38 follow-up scans, there was also a large discrepancy in categorization of PR. While 2D classified 18/38 (47%) of scans as PR, volumetrics classified only 4/38 (11%) of scans as PR. 14/18 (78%) of scans classified as PR by 2D where classified as SD by volumetrics (Fig 4B). There were very few scans classified as PD by either 2D or volumetric analysis of the different tumor components.
DISCUSSION
The disagreement between volumetric and 2D methods in measuring absolute percent change was greatest for cystic followed by mixed solid/cystic and then solid tumor component. Interestingly, volumetrics underestimated absolute percent change in mixed solid/cystic tumor compared to 2D. We found largest discrepancy in classification of PR based on RANO cutoffs of solid and mixed solid/cystic tumor components. Volumetrics tended to classify more solid and mixed solid/cystic tumor components as SD than 2D. This agrees with our finding that volumetrics underestimated percent change in mixed solid/cystic tumor compared to 2D. Surprisingly, there was not much discrepancy between methods in classifying cystic tumor based on RANO cutoffs even though poor agreement was observed between the methods based on ICC. This may be because many cystic tumors had a large decrease in size far beyond RANO 2D and extrapolated cutoffs for PR.CONCLUSION
There was a large difference between volumetrics and 2D when measuring absolute percent change of solid, cystic, and mixed solid/cystic tumor components in pLGG. When categorizing response based on 2D and volume extrapolated RANO cutoffs, there was a large discrepancy in classification of PR based on solid and mixed solid/cystic tumor components while the discrepancy was minimal for cystic tumor component. Further work is needed to correlate these discrepancies to differences in clinical outcomes in patients to identify the superiority of either of the investigated approaches.Acknowledgements
No acknowledgement found.References
1. Huang RY, Wen PY. Response Assessment in Neuro-Oncology Criteria and Clinical Endpoints. Magn Reson Imaging Clin N Am. 2016;24(4):705-718. doi:10.1016/j.mric.2016.06.003
2. Blomstergren A, Rydelius A, Abul-Kasim K, Lätt J, Sundgren PC, Bengzon J. Evaluation of reproducibility in MRI quantitative volumetric assessment and its role in the prediction of overall survival and progression-free survival in glioblastoma. Acta Radiol. 2019;60(4):516-525. doi:10.1177/0284185118786060
3. Henker C, Hiepel MC, Kriesen T, et al. Volumetric assessment of glioblastoma and its predictive value for survival. Acta Neurochir (Wien). 2019;161(8):1723-1732. doi:10.1007/s00701-019-03966-6
4. Wang MY, Cheng JL, Han YH, et al. Comparison of volumetric methods for tumor measurements on two and three dimensional MRI in adult glioblastoma. Neuroradiology. 2011;53(8):565-569. doi:10.1007/s00234-010-0789-z
5. D’Arco F, Culleton S, De Cocker LJL, Mankad K, Davila J, Tamrazi B. Current concepts in radiologic assessment of pediatric brain tumors during treatment, part 1. Pediatr Radiol. 2018;48(13):1833-1843. doi:10.1007/s00247-018-4194-9
6. D’Arco F, O’Hare P, Dashti F, et al. Volumetric assessment of tumor size changes in pediatric low-grade gliomas: feasibility and comparison with linear measurements. Neuroradiology. 2018;60(4):427-436. doi:10.1007/s00234-018-1979-3
7. Gerstner ER. Volumetric measurements in low-grade glioma: Are we there yet? Neuro-Oncology. Published online January 28, 2022:noac018. doi:10.1093/neuonc/noac018
8. Nicolaides T, Nazemi KJ, Crawford J, et al. Phase I study of vemurafenib in children with recurrent or progressive BRAFV600E mutant brain tumors: Pacific Pediatric Neuro-Oncology Consortium study (PNOC-002). Oncotarget. 2020;11(21):1942-1952. doi:10.18632/oncotarget.27600
Figures