5301
Probing the diffusion of water and intracellular metabolites to assess white matter microstructure in Duchenne muscular dystrophy1Leiden University Medical Center, Leiden, Netherlands, 2Newcastle Hospitals NHS Foundation Trust, Newcastle, United Kingdom, 3Newcastle University, Newcastle, United Kingdom
Synopsis
Keywords: Neuro, Spectroscopy, Duchenne muscular dystrophy
Besides motor impairment, Duchenne muscular dystrophy (DMD) patients experience cognitive and behavioural symptoms. Altered white matter microstructure has been shown with diffusion tensor imaging (DTI) in this population. Here, we combined single volume 1H diffusion-weighted spectroscopy (DWS) and DTI to disentangle intra- and extracellular contributions. Mean apparent diffusion coefficients of N-acetyl aspartate, choline, and creatine were comparable between DMD patients and healthy controls. In the same volume, DMD patients showed increased mean water diffusivity. This suggests that altered white matter microstructure is likely due to extracellular, rather than intracellular, changes.Introduction
Duchenne muscular dystrophy (DMD) is a progressive X-linked recessive neuromuscular disorder caused by the absence of functional dystrophin protein1,2. In addition to muscle, dystrophin is expressed in the brain in both neurons and glial cells3. Approximately 30% of DMD patients experience behavioural and cognitive deficits4, which have a large impact on their quality of life. Previous studies using diffusion tensor imaging (DTI) reported reduced fractional anisotropy (FA) and increased mean diffusivity (MD) in the brains of DMD patients compared to healthy controls (HCs)5,6,7. However, DTI measurement is non-specific, as water molecules are present in almost all tissue subcomponents and diffuse quickly between intra- and extracellular environments8. 1H diffusion-weighted spectroscopy (DWS) allows for compartment- and cell-specific assessment of the diffusion properties. As opposed to water, brain metabolites are almost exclusively found in the intracellular space and are specific to cell types (such as N-acetyl-aspartate (NAA) in neurons and Choline (Cho) in astrocytes). In this study, we investigated if the altered white matter microstructure in DMD patients is due to intra- and/or extracellular microstructural changes, using DWS and DTI.Methods
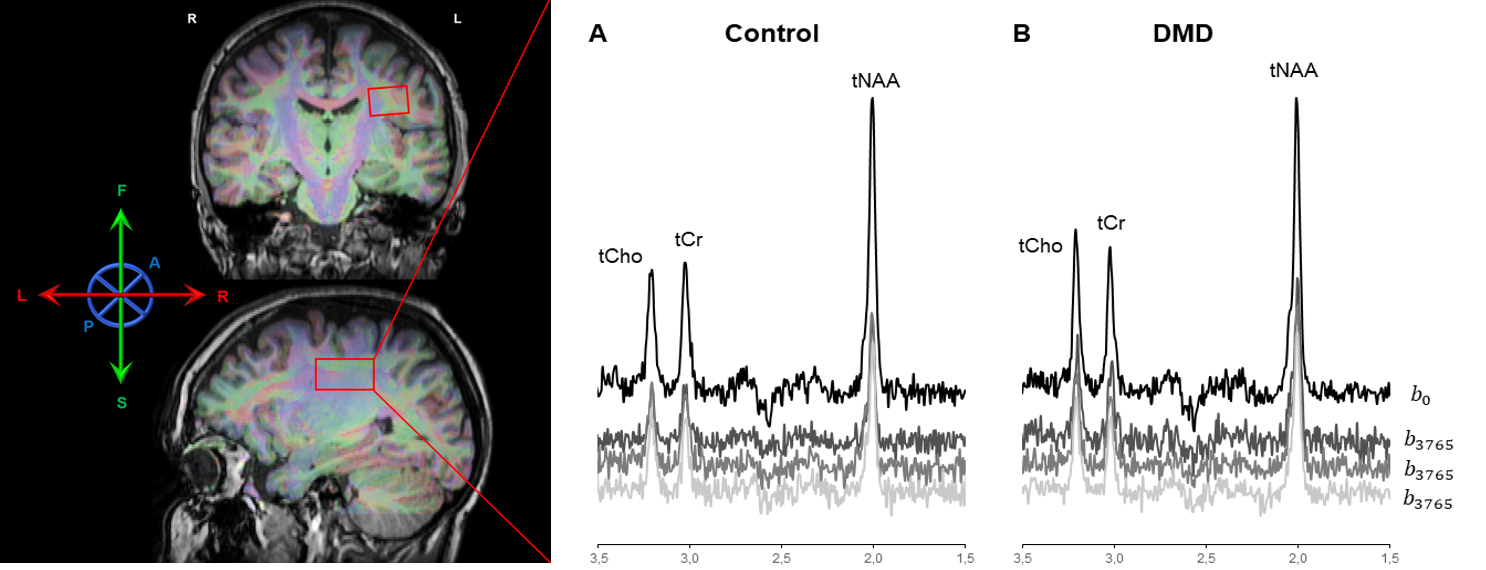
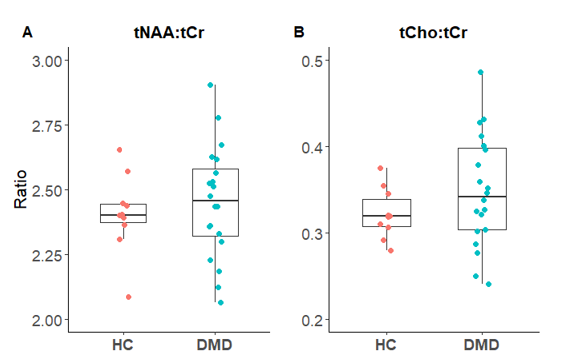
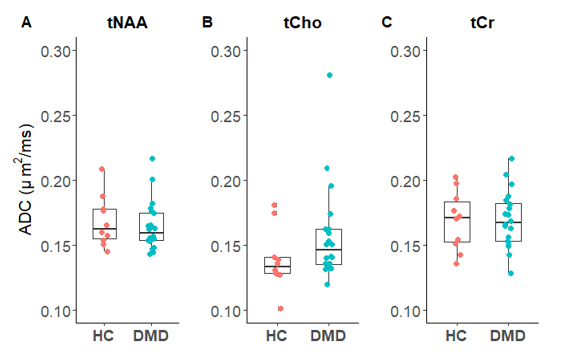
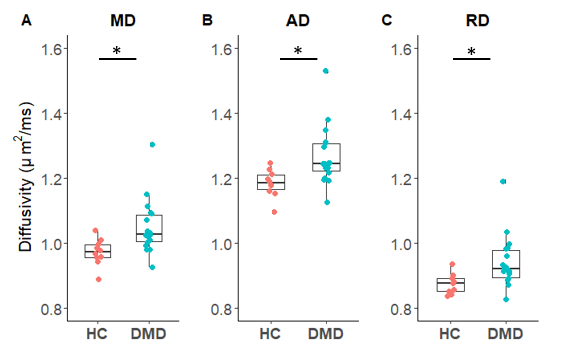
In a two-centre study (Leiden University Medical Center, the Netherlands and Newcastle University, the United Kingdom) scans were obtained at 3 Tesla (Philips Achieva, Best, the Netherlands) using an 8-channel head coil. 3DT1-weighted scans were obtained for anatomical reference (TE/TR 4.6/9.8 ms; spatial resolution 1.17x0.92x1.17 mm). DWS data were acquired with and without water suppression using a cardiac triggered PRESS sequence to determine diffusion and concentration of metabolites (TE=125 ms, TR=2 cardiac cycles; 24 signal averages; b=0 and b=3765 mm/s2; three orthogonal diffusion directions; non-water suppressed two signal averages). A volume of interest (VOI; 30x20x15 mm) was positioned in the left parietal white matter (Figure 1). DTI scans (TE/TR 59/9440 ms; spatial resolution 1.96x2x2 mm; 32 directions, b=0 and b=1000 s/mm2) were obtained to determine water diffusion metrics (Figure 1). DWS spectra (Figure 1) were analyzed using an in-house Matlab routine, including corrections for individual frequency and phase drifts and eddy currents, and subsequently fitted using LCModel9. Apparent diffusion coefficients (ADC) were calculated for total N-acetyl aspartate (tNAA), choline compounds (tCho), and total creatine (tCr). Volume fractions of cerebrospinal fluid, white matter and grey matter within the VOI were determined using an overlay of the VOI with tissue maps derived from FSL10,11. The ratios of tNAA/tCr and tCho/tCr were calculated from the fitted non-diffusion weighted water-suppressed spectrum. DTI scans were co-registered with T1 and DWS using ExploreDTI12 to obtain mean diffusivity (MD), radial diffusivity (RD), and axial diffusivity (AD) of water within the VOI.Results
DWS and DTI data from 18 genetically confirmed DMD patients (mean age 15.5 ± sd 4.6 years) and 10 age- and sex-matched healthy controls (HCs; mean age 16.3 ± sd 3.3 years) passed quality control (signal-to-noise ratio >6; full-width half-maximum of NAA <.030 ppm; Cramer-Rao Lower Bounds <6% for NAA, <10% for choline and creatine). No differences in metabolite diffusion (tNAA, tCho and tCr; Figure 2) and metabolite levels (tNAA/tCr and tCho/tCr ratios; Figure 3) were found between DMD patients and HCs. Water diffusion (MD , RD and AD; Figure 4) within the VOI was significantly higher in DMD patients compared to HCs.Discussion and conclusion
Results from this study indicate a preserved diffusion of tNAA, tCho, and tCr with ADC values similar to the literature13. The ratios of tNAA/tCr and tCho/tCr in patients with DMD compared to HC are consistent with our previous results, indicating intact biochemical composition in patients with DMD14. In the same VOI, DMD patients did show increased water diffusivity. This suggests that altered white matter microstructure is likely due to extracellular, rather than intracellular, changes. In future studies, these findings should be further explored to explain their origin and relate them to the behavioural and cognitive deficits in this population.Acknowledgements
This research is supported by the Duchenne Parent Project-NL and Muscular Dystrophy UK.References
1. Banihani R, Smile S, Yoon G, et al. Cognitive and neurobehavioral profile in boys with Duchenne muscular dystrophy. J Child Neurol. 2015; 30(11), 1472-1482.
2. Naidoo M, Anthony K. Dystrophin Dp71 and the Neuropathophysiology of Duchenne Muscular Dystrophy. Mol Neurobiol. 2020; 57(3):1748-1767.
3. Doorenweerd N, Mahfouz A, van Putten M, et al. Timing and localization of human dystrophin isoform expression provide insights into the cognitive phenotype of Duchenne muscular dystrophy. Sci Rep. 2017a; 7(1), 1-12.
4. Doorenweerd N. Combining genetics, neuropsychology and neuroimaging to improve understanding of brain involvement in Duchenne muscular dystrophy - a narrative review. Neuromuscul Disord. 2020; 30(6):437-442.
5. Doorenweerd N, Straathof CS, Dumas EM, et al. Reduced cerebral gray matter and altered white matter in boys with Duchenne muscular dystrophy. Ann Neurol. 2014; 76(3), 403-411.
6. Preethish-Kumar V, Shah A, Kumar M, et al. In vivo evaluation of white matter abnormalities in children with Duchenne muscular dystrophy using DTI. AJNR Am J Neuroradiol. 2020; 41(7), 1271-1278.
7. Fu Y, Dong Y, Zhang C, et al. Diffusion tensor imaging study in Duchenne muscular dystrophy. Ann Transl Med. 2016; 4(6).
8. Palombo M, Shemesh N, Ronen I, Valette J. Insights into brain microstructure from in vivo DW-MRS. Neuroimage. 2018; 182, 97-116.
9. Provencher SW. Estimation of metabolite concentrations from localized in vivo proton NMR spectra. Magn Reson Med. 1993; 30(6), 672-679.
10. Zhang Y, Brady M, Smith S. Segmentation of brain MR images through a hidden Markov random field model and the expectation-maximization algorithm. IEEE Trans Med Imaging. 2001; 20(1):45-57.
11. Smith SM. Fast robust automated brain extraction. Hum Brain Mapp. 2002 Nov;17(3):143-55.10.
12. Leemans A, Jeurissen B, Sijbers J, Jones DK. “ExploreDTI: A graphical toolbox for processing, analyzing, and visualizing diffusion MR data”. Proceedings of the 17th Scientific Meeting, International Society for Magnetic Resonance in Medicine, Honolulu, USA, p. 3537, 2009.
13. Najac C, Branzoli F, Ronen I, Valette J. Brain intracellular metabolites are freely diffusing along cell fibers in grey and white matter, as measured by diffusion-weighted MR spectroscopy in the human brain at 7 T. Brain Struct Funct. 2016; 221(3), 1245-1254.
14. Doorenweerd N, Hooijmans M, Schubert SA, et al. Proton magnetic resonance spectroscopy indicates preserved cerebral biochemical composition in Duchenne muscular dystrophy patients. J Neuromuscul Dis. 2017b; 4(1), 53-58.
Figures