5300
Longitudinal findings from differential tractography of patients with type II GM1 gangliosidosis1University of Massachusetts Chan Medical School, Worcester, MA, United States, 2National Institutes of Health, Bethesda, MD, United States
Synopsis
Keywords: Rare disease, Rare disease
GM1-gangliosidosis is a rare heritable lysosomal storage disorder caused by accumulation of GM1-ganglioside due to deficiency of the lysosomal enzyme b-galactosidase required for sphingolipid degradation. Progressive accumulation of GM1-ganglioside in the central nervous system induces hypomyelination that results in progressive neurodegeneration. This study used differential tractography in 11 type II GM1 patients to assess longitudinal white matter tract changes using fractional anisotropy (FA) in different regions of the brain in late-infantile and juvenile patients. FA decrease was observed predominantly in the corpus callosum, superior longitudinal fasciculus, and cingulum in supratentorial white matter structures, demonstrating the utility of differential tractography.Introduction
Gangliosidoses are rare heritable lysosomal storage disorders caused by the accumulation of sphingolipid metabolites. The progressive accumulation of ganglioside in the central nervous system (CNS) induces hypomyelination and progressive neurodegeneration. GM1 gangliosidosis can be divided into three groups: type I (infantile), type II (late infantile and juvenile sub-types), and type III (adult). Late infantile GM1 has onset symptoms between 1 and 3 years of age and life expectancy into the second decade, whereas the juvenile subtype features symptom onset at 4-5 years, and life expectancy can reach the third decade. Hypomyelination1, basal ganglia signal intensity changes2, cerebellar and cerebral atrophy3 have been reported on MRI in patients with GM1. Although hypomyelination has been documented in GM1 patients with conventional MRI, quantitative analyses like longitudinal diffusion tensor imaging studies are lacking. Differential tractography is a new method to study white matter tract changes. Compared to conventional tractography methods, differential tractography demonstrates all existing pathways and can demonstrate the precise segment of pathways that show longitudinal changes. FA (fractional anisotropy) is a tractography parameter that indicates white matter integrity. In this study, we applied differential tractography in type II GM1 patients to localize differences in FA between baseline and follow-up MRI scans.Methods
Patients with a confirmed diagnosis of GM1 gangliosidosis were enrolled in National Institutes of Health (NIH) protocol 02-HG-0107: “The Natural History of Patients with Glycosphingolipid Storage Disorders.” Parents or legal guardians provided informed consent for patients’ participation in the study. Serial brain MR images were collected and evaluated in late infantile and juvenile GM1 gangliosidoses patients. Brain MRI was performed using a Philips Achieva 3T system (Philips Healthcare, Best, the Netherlands) equipped with an 8-channel SENSE head coil (Philips Healthcare). DTI images were acquired with the following parameters: TR/TE = 6400/100 ms, 99-gradient directions, b-values = 0 and 1000 s/mm2 , slice thickness = 2.5 mm, acquisition matrix = 128 × 128, NEX = 1, FOV = 24 cm. Diffusion data were analyzed with DSI studio (http://dsi-studio.labsolver.org). Generalized q-sampling imaging (GQI) was used to reconstruct spin distribution function (SDF) maps. Differential tractography4,5 was applied to map pathways with first-time point larger than follow-up examination, and only the differences ≥ 20% were tracked. The angular threshold was 600 and the step size was 1 mm. Tracks < 20 mm or > 300 mm were discarded. 1,000,000 seeds were placed. The number and volume of fibers demonstrating ≥ 20% FA decrease, whole brain number of fiber tracts, and volume of tracts were recorded. The quantified parameters were compared between the juvenile and late infantile patients using 2-tailed non-parametric Mann-Whitney t-test. Significant differences were considered for p<0.05. Each patient’s output tractography was converted into regions of interest (ROIs) and evaluated with DSI studio’s automated segmentation algorithm.Results and Discussion
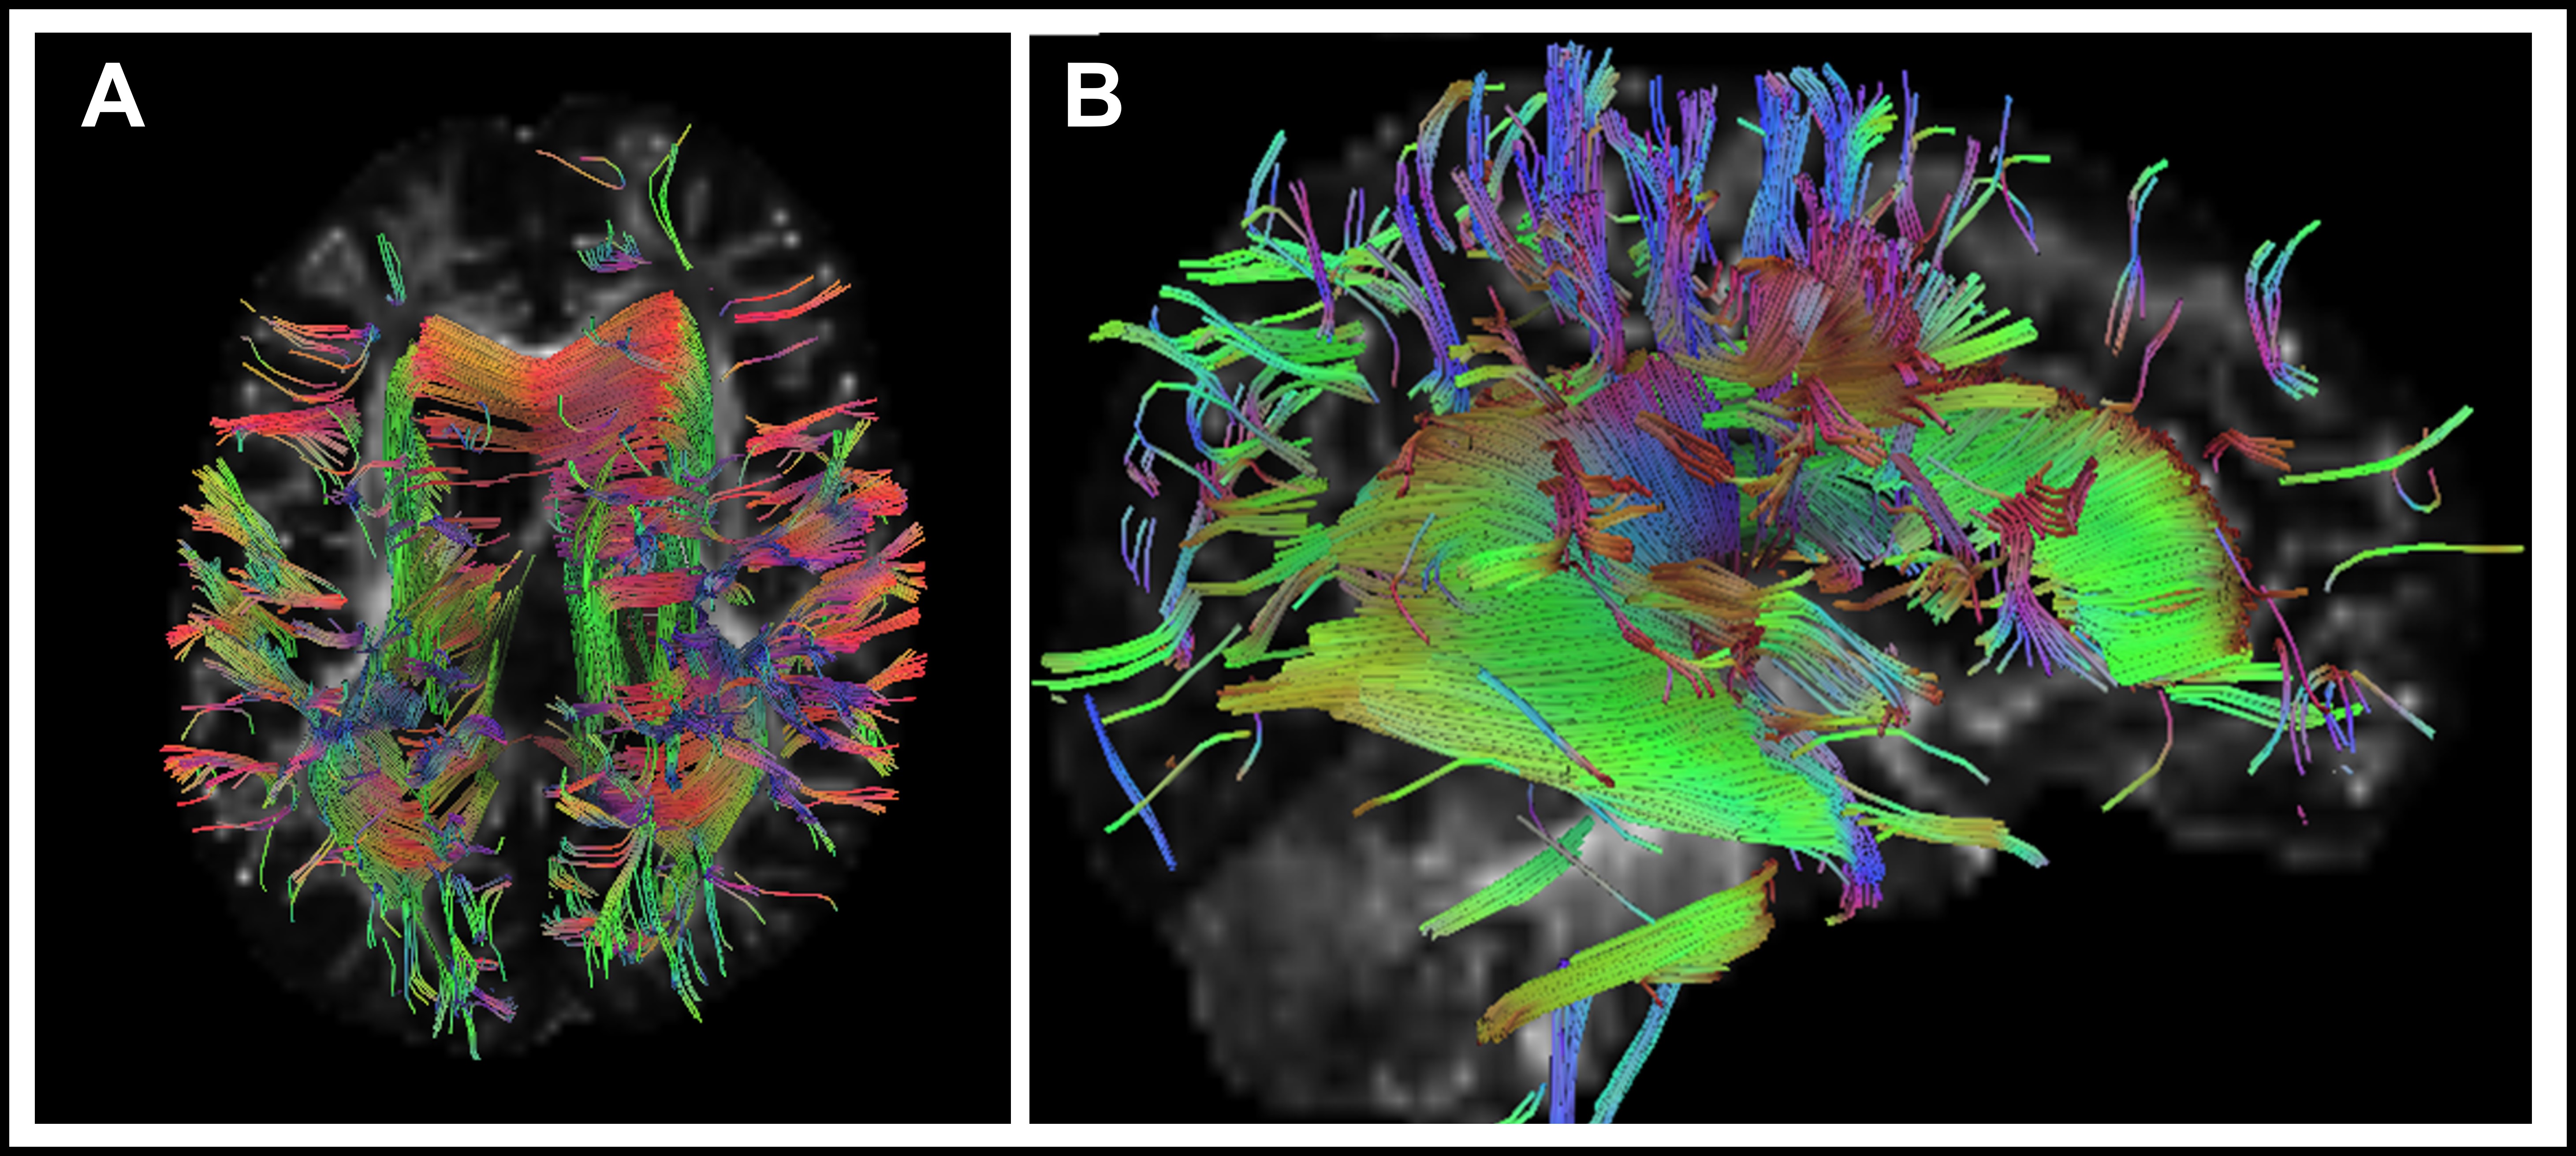
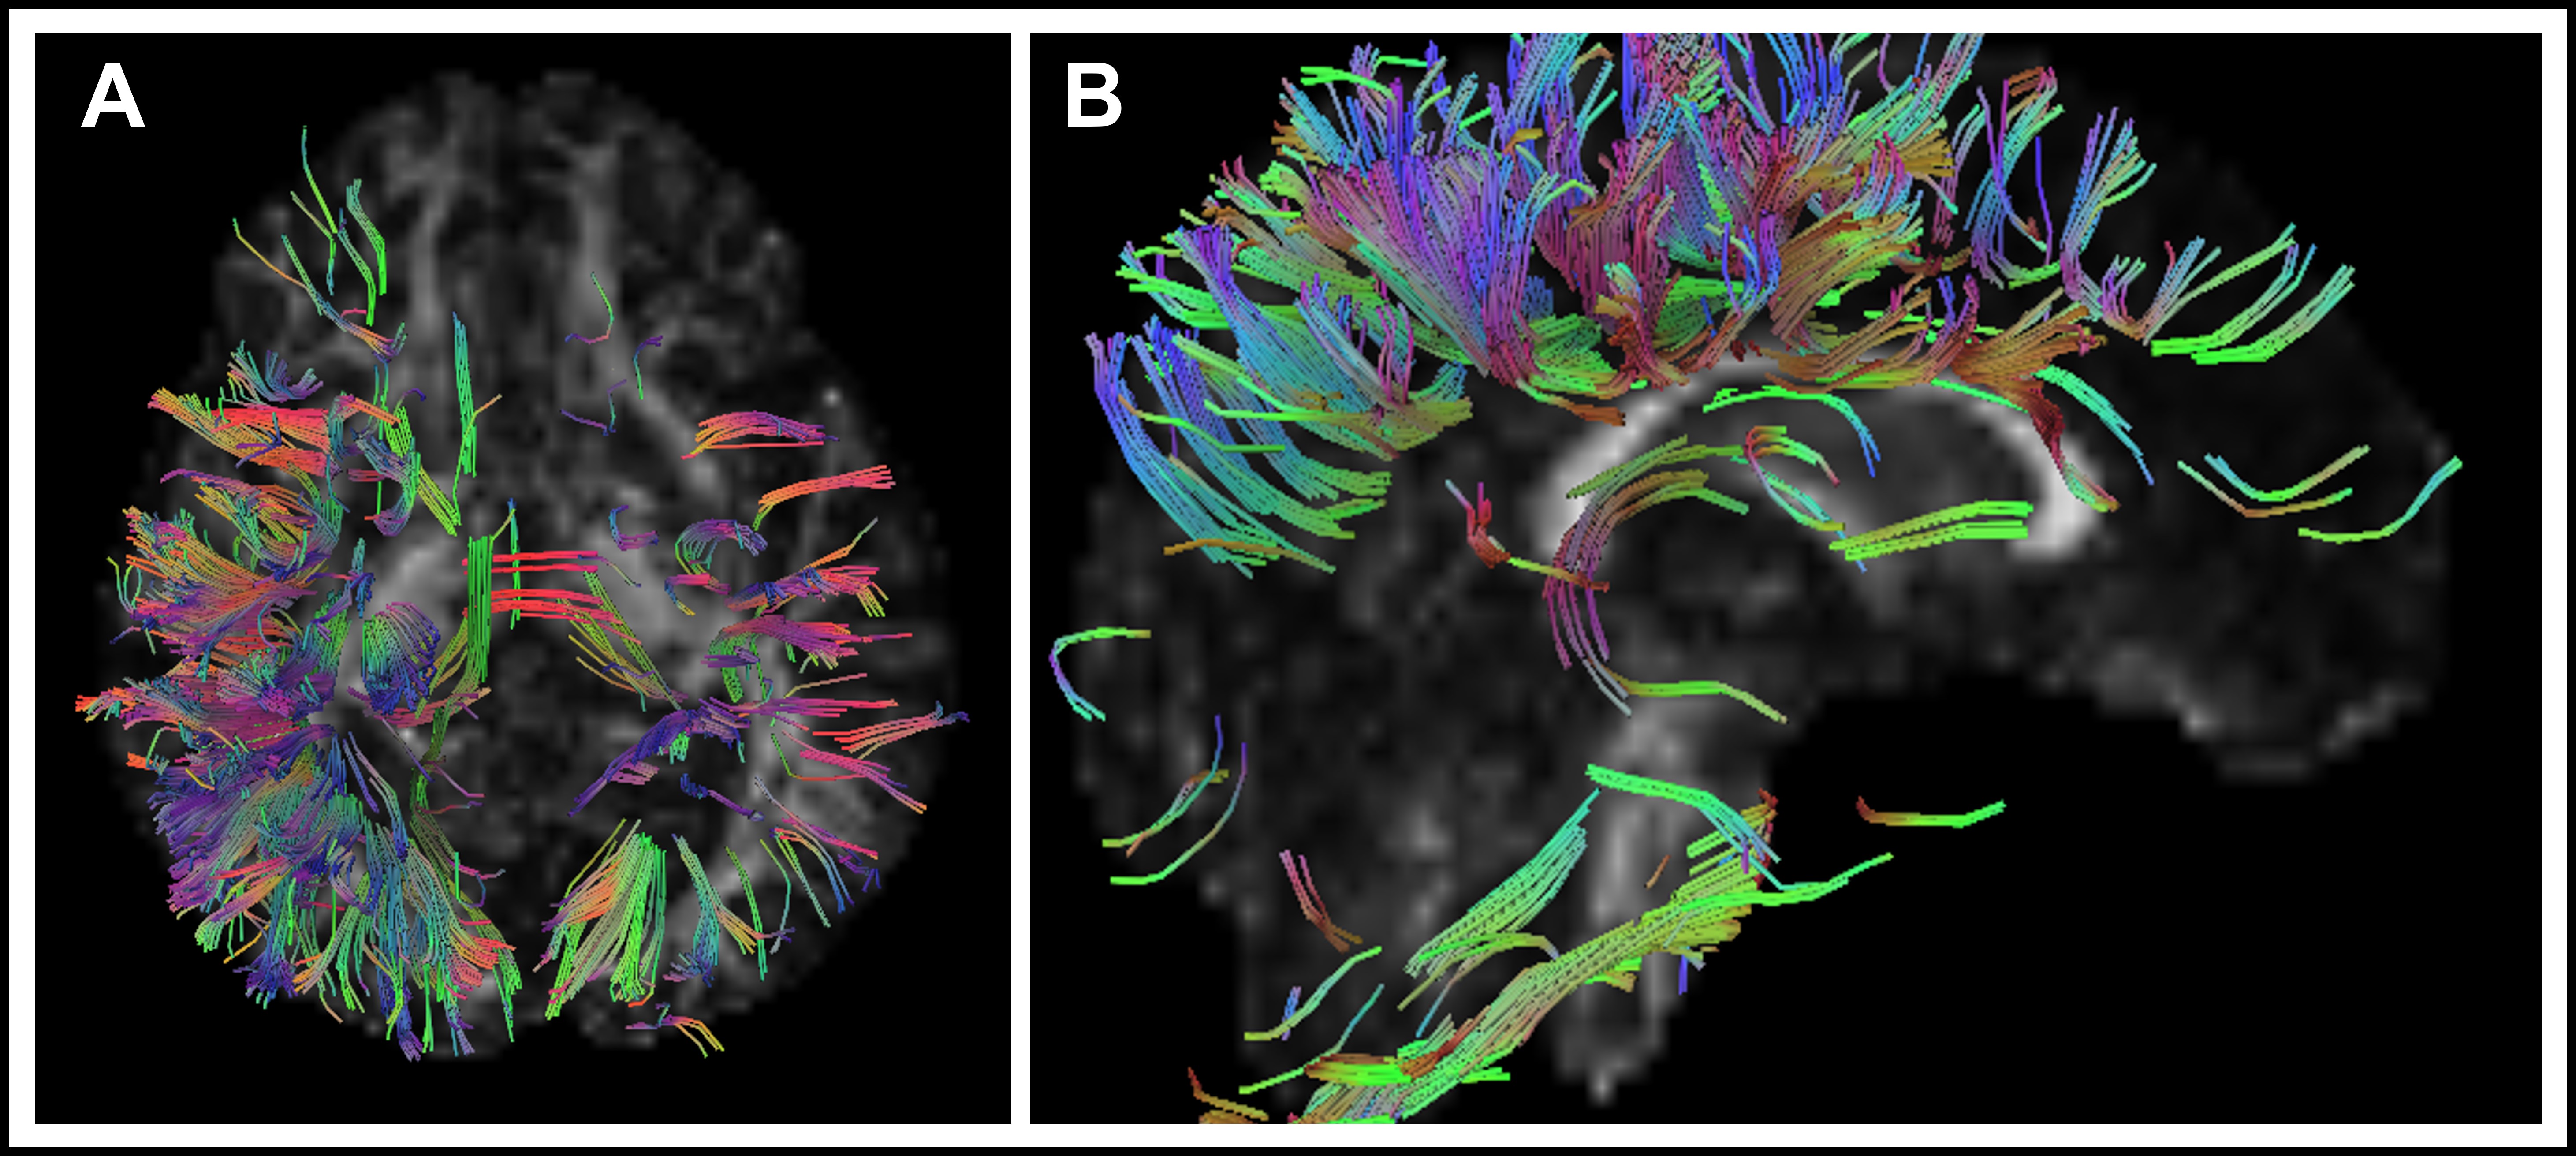
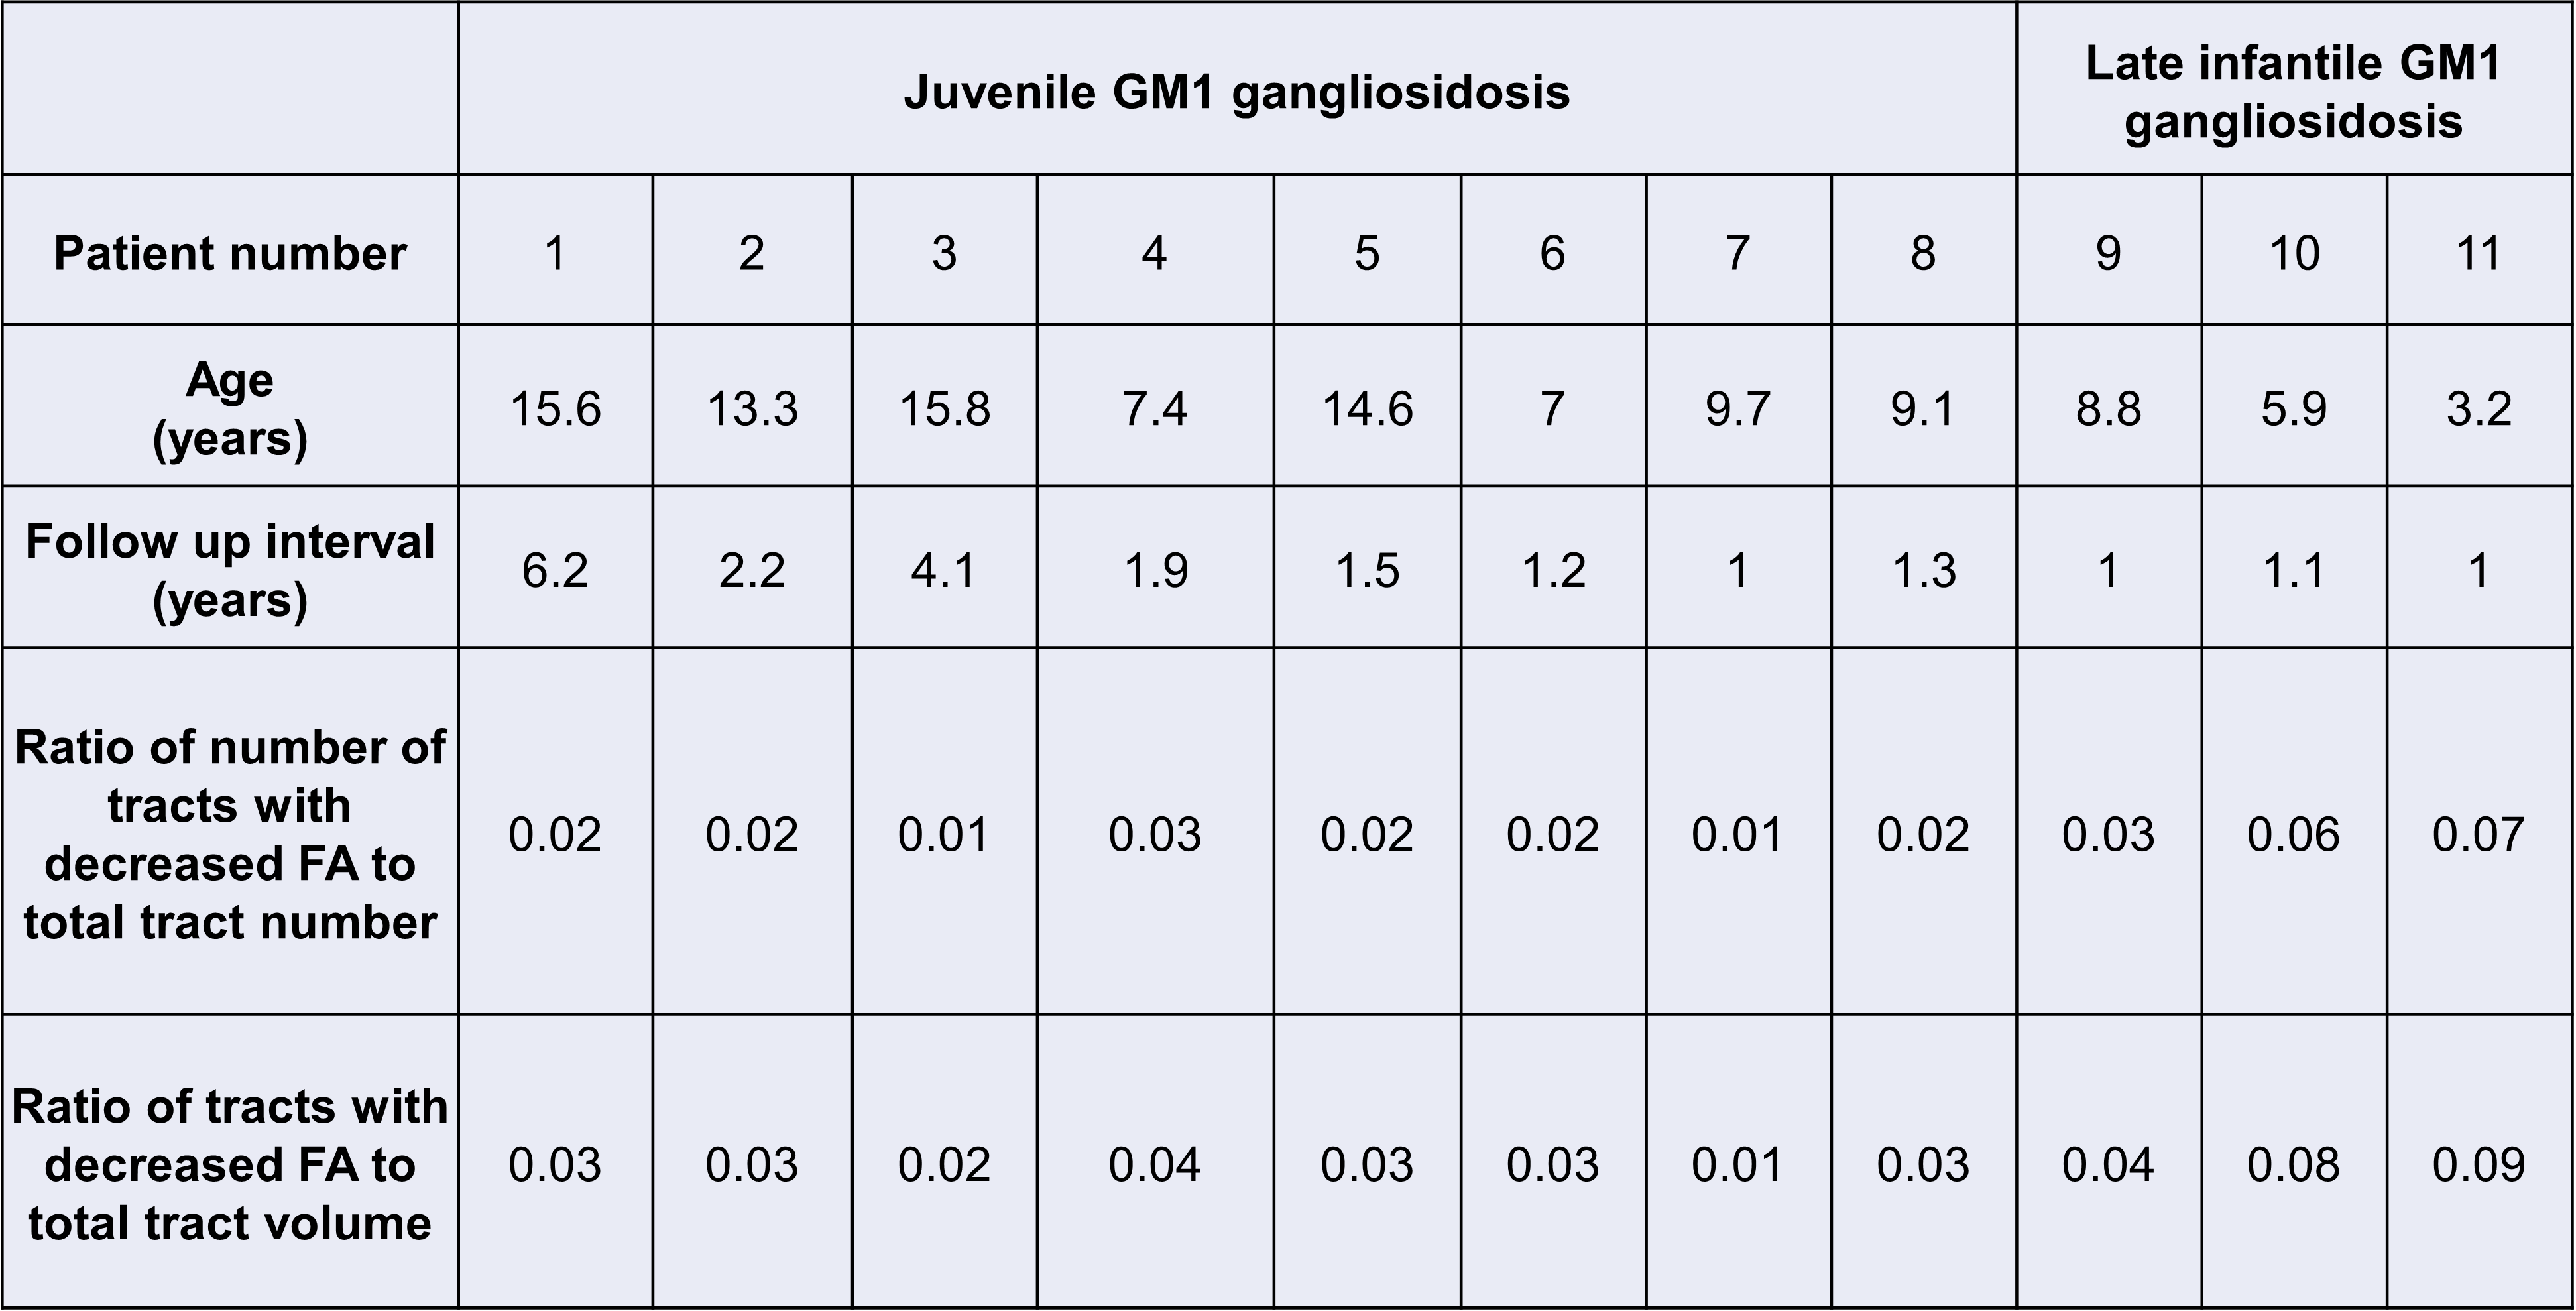
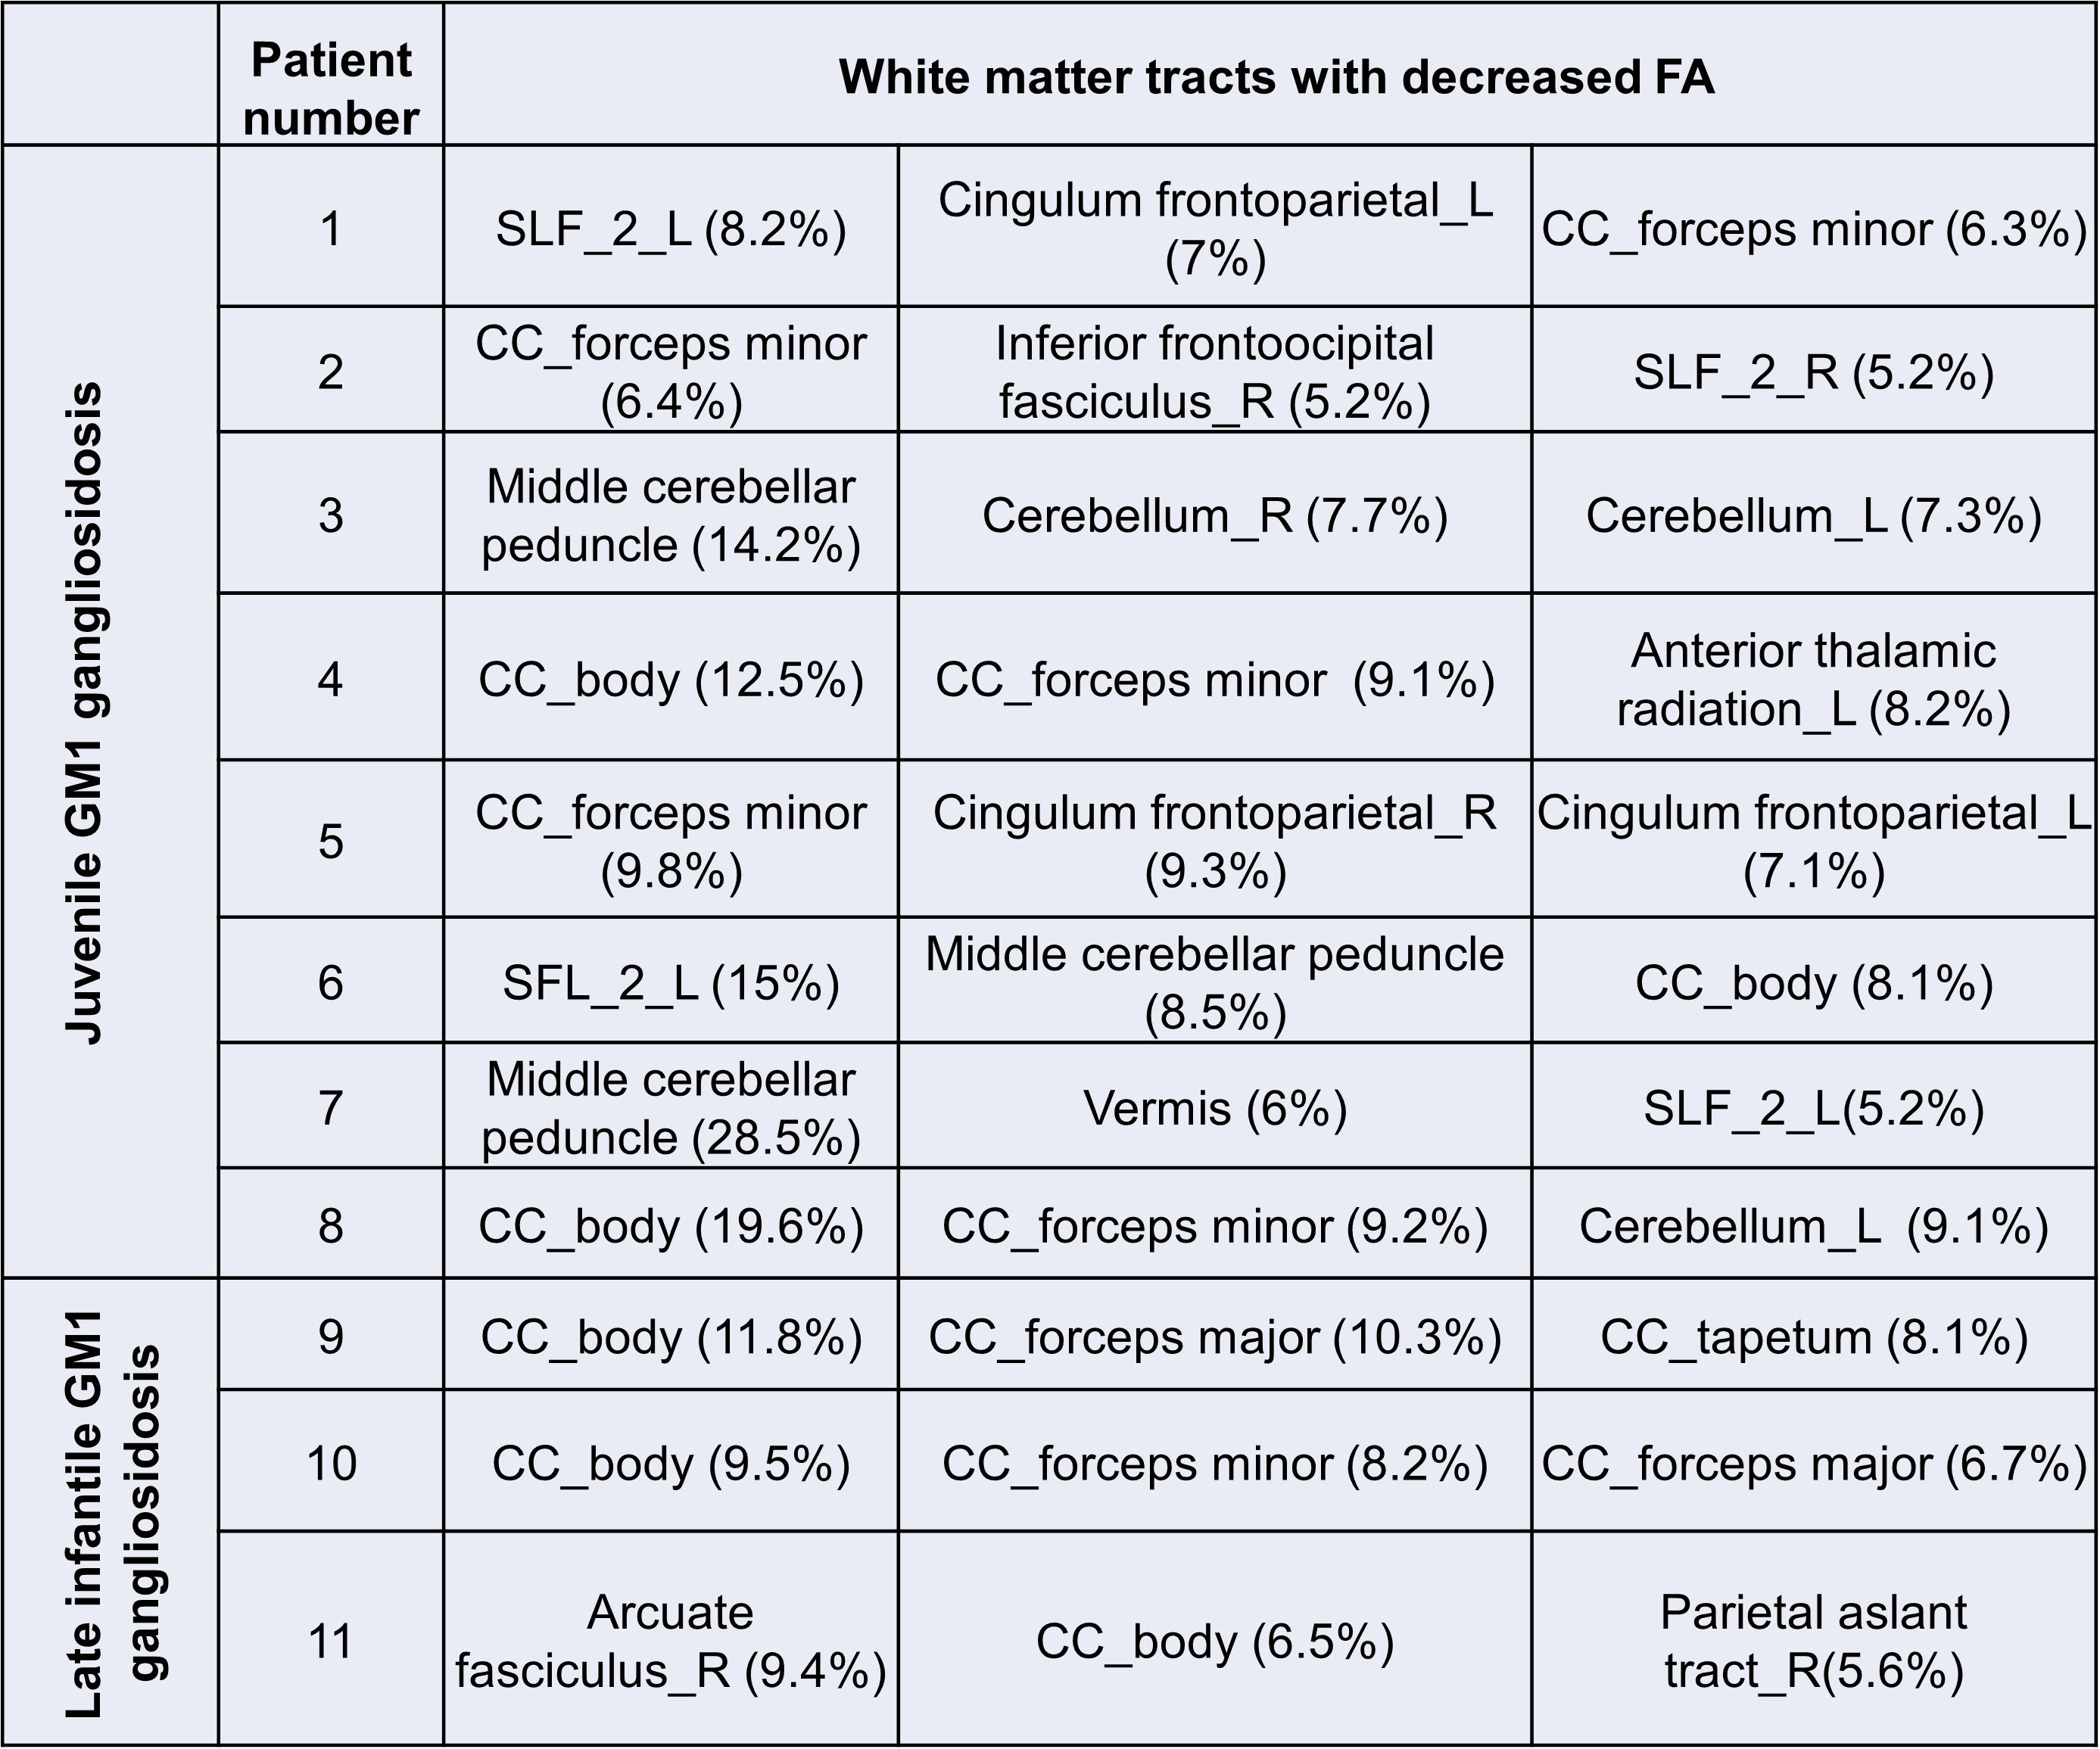
Eleven type II GM1 patients were included in this study. Eight juvenile patients (mean age 11.6 ± 3.4 years) and three late infantile patients (mean age 6 ± 2.8 years) were included in the analysis. Follow-up interval was 1 ± 0.1 years for late infantile patients and 2.4 ± 1.8 years for juvenile patients. Representative cases of late infantile and juvenile GM1 patients' differential tractography outputs are presented in Figure 1 and Figure 2. White matter tracts with decreased FA were more extensive in patients with late-infantile GM1 than in juvenile GM1 patients (Table 1). Ratio of the number of tracts with decreased FA to the total tract number was lower in juvenile patients than late infantile patients (mean 0.02 vs 0.06 respectively; p=0.03). Ratio of tracts with decreased FA to total tract volume was also lower in juvenile patients than late infantile patients (mean 0.03 vs 0.07 respectively; p=0.02). Based on regional analysis, FA decrease was observed predominantly in the corpus callosum, superior longitudinal fasciculus, and cingulum in supratentorial white matter structures (Table 2). Middle cerebellar peduncle, cerebellar white matter, and vermis were affected in the infratentorial region.Conclusion
We report an observation of disease progression in type II GM1 based on differential tractography analysis. Most of the MRI data on GM1 patients primarily relies on qualitative assessments. Differential tractography can better assess white matter changes to track disease progression and evaluate treatment strategies' effects over time. To our knowledge, this study is the first to demonstrate the utility of differential tractography to demonstrate longitudinal changes in the white matter tracts in type II GM1 patients.Acknowledgements
No acknowledgement found.References
1. Steenweg ME, Vanderver A, Blaser S, et al. Magnetic resonance imaging pattern recognition in hypomyelinating disorders. Brain 2010;133:2971-2982
2. De Grandis E, Di Rocco M, Pessagno A, et al. MR Imaging Findings in 2 Cases of Late Infantile GM1 Gangliosidosis. American Journal of Neuroradiology 2009;30:1325
3. Nestrasil I, Ahmed A, Utz JM, et al. Distinct progression patterns of brain disease in infantile and juvenile gangliosidoses: Volumetric quantitative MRI study. Mol Genet Metab 2018;123:97-104
4. Yeh FC, Zaydan IM, Suski VR, et al. Differential tractography as a track-based biomarker for neuronal injury. Neuroimage 2019;202:116131
5. Yeh FC, Panesar S, Barrios J, et al. Automatic Removal of False Connections in Diffusion MRI Tractography Using Topology-Informed Pruning (TIP). Neurotherapeutics 2019;16:52-58
Figures