5299
Abnormal spontaneous brain activity and functional connectivity in children with new-onset type 1 diabetes mellitus1Radiology, The Second Affiliated Hospital and Yuying Children’s Hospital of Wenzhou Medical University, Wenzhou, China, 2Philips Healthcare, Shanghai, China
Synopsis
Keywords: Neuro, Diabetes, children, cognition, fMRI
It is unclear whether brain activity and functional connectivity (FC) will change in type 1 diabetes mellitus (T1DM) children. We investigated brain activity and FC changes in new-onset T1DM children based on fractional amplitude of low-frequency fluctuation (fALFF) and seed-based FC analysis. We found that children with new-onset T1DM showed changed fALFF values and FCs in several brain regions. Changed fALFF values were correlated with intelligence quotient (IQ) and blood glucose level. These results suggest that altered brain spontaneous activity and FC in initial-stage T1DM patients may be the potential mechanisms of subsequent visual impairment and cognitive dysfunction.Abstract Body
IntroductionType 1 diabetes mellitus (T1DM) results in cognition impairment and visual impairment in children and adults, which will affect learning, work and life.1,2 To date, the exact neurobiological mechanisms underlying T1DM related cognitive dysfunction and visual impairment are unclear. Functional MRI (fMRI) is an important tool used to study the mechanism of cognitive impairments in T1DM. Previous studies found changed functional connectivity (FC) in children and adults with T1DM.3-5 It is possible that T1DM related cognitive dysfunction is associated with brain functional deficits. However, previous fMRI studies mainly focused on T1DM patients with long disease duration. Although our previous study based on the whole brain FCD analysis and seed-based FC analysis has shown that these subjects have brain functional deficits in the disease’s initial stage, additional research methods are needed to determine whether more brain regions and neural circuits are involved.
Fractional amplitude of low frequency fluctuation (fALFF) and FC can be used to reflect regional spontaneous neural activity.6 In this study, we intended to examine brain functional changes in new-onset T1DM children relative to control subjects by using the fALFF and seed-based FC approach. Our study will help to understand the potential mechanisms underlying T1DM-related complications.
Methods
This study enrolled 35 children with new-onset T1DM and 33 age- and sex- matched controls from April 2016 to January 2018. Imaging data was obtained from a 3T GE MR750 scanner (GE, Waukesha, WI, USA). Bold fMRI images and high-resolution T1-weighted imaging were acquired using the echo-planar sequence and the 3D T1-BRAVO sequence, respectively.
The preprocessing of resting-state fMRI data was performed by using SPM8 (http://www.fil.ion.ucl.ac.uk/spm) and DPARSF (http://www.restfmri.net).7-9 REST software (http://www.rest-fmri.net) was used to calculate fALFF. Calculations of FC were carried out using REST software (http://www.restfmri.net). The brain regions having abnormal fALFF were selected as the seeds. The FC between each seed and every other voxel was calculated.
A two-sample t test was applied to investigate the differences in fALFF value and FC between the two groups, and 3dClustSim program in the AFNI software (http://afni.nimh.nih.gov) was utilized to correct for multiple comparisons. P < 0.05 (after alphasim correction) was set as the threshold level for statistical significance. Spearman rho correlation analysis was employed to investigate the relationships between fALFF values of abnormal brain regions and clinical variables and Z score of IQ. Multiple comparisons were performed by Bonferroni correction.
Results
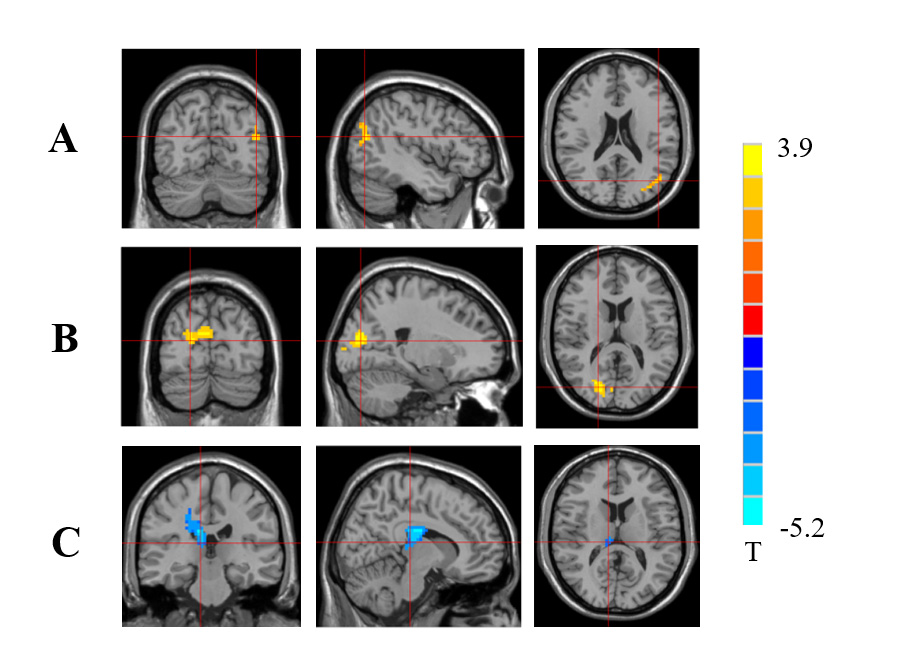
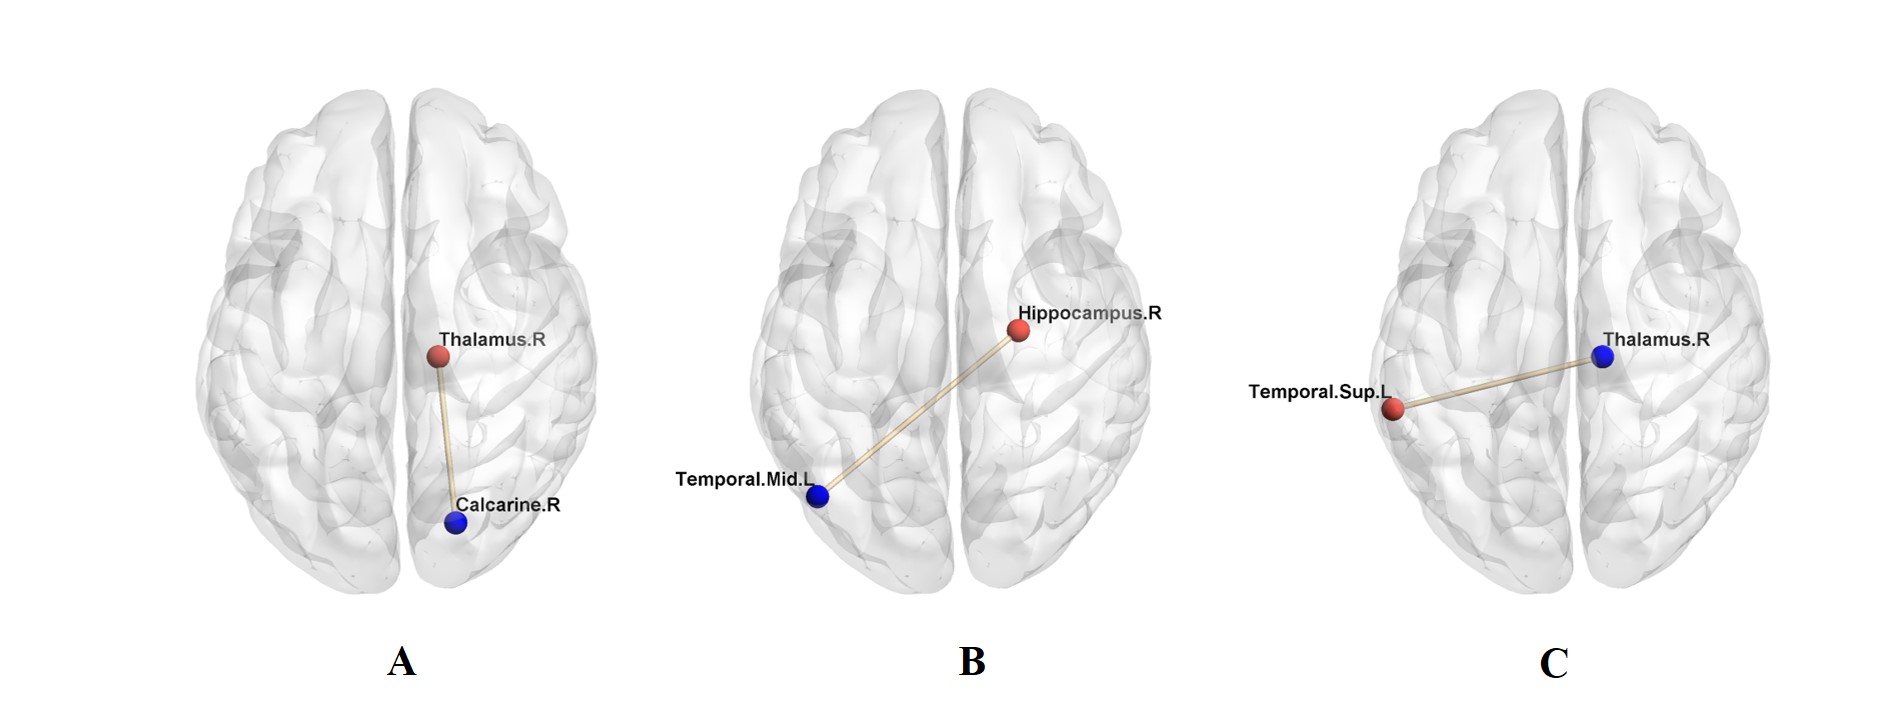
There were significant differences in blood glucose level and HbA1c between the two groups. Compared to the controls, T1DM children showed increased fALFF values in left middle temporal gyrus (MTG) and right calcarine, and decreased fALFF value in right thalamus (Fig 1). The fALFF value of left MTG was positively correlated with IQ, while fALFF value of right thalamus was negatively correlated with blood glucose level in T1DM group. T1DM children had increased FC between right calcarine and right thalamus and between left MTG and right hippocampus, and decreased FC between right thalamus and left superior temporal gyrus (STG) (Fig 2).
Discussion
In this study, we found changes of fALFF and FC in several brain regions in children with new-onset T1DM, which demonstrated altered spontaneous brain activity and FC in the initial stage of T1DM. In addition, the changed fALFF value was correlated with IQ in the T1DM group.
The MTG is a key part of language pathways and also involved in the recall of memories.10,11 Abnormal brain activity in this brain region may affect language process and memory. Our study showed changed fALFF value in the MTG in new-onset T1DM children, which was correlated with IQ. This may suggest that T1DM-related cognition impairments may be partly due to brain activity disturbances in the MTG.
The calcarine is the key component of visual cortex, and involves in visual attention and discrimination and color perception.12 The thalamus integrates neural activities from visual-related brain regions and participates in visual perception and dynamic visual information processing.13,14 Our study showed altered spontaneous neural activity in right calcarine and thalamus in T1DM children. We speculated that altered brain activity of calcarine and thalamus may also be a neuropathologic mechanism of visual impairment in T1DM patients.
Seed-based FC analysis showed increased FC between left MTG and right hippocampus. The MTG involves in language and memory. The hippocampus is responsible for memory and cognition.15,16 We speculated that changed MTG-hippocampus connectivity in the initial stage may contributed to later cognition impairment in T1DM patients.
We found decreased FC between right thalamus and left STG and increased FC between right calcarine and right thalamus in T1DM children. The thalamus takes part in visual and auditory processes.17,18 The STG involves in auditory processing, including language, but is also considered a key structure of social cognition.19,20 The calcarine is an important part of visual cortex. We speculated that the alterations of thalamus-STG connectivity and calcarine-thalamus connectivity may affect auditory and visual processing and cognition in T1DM patients.
Conclusion
This study suggests that spontaneous neural activity and FC changes in several brain regions in the initial stage may be possible mechanisms of visual impairment and cognitive dysfunction later in life in T1DM patients.
Acknowledgements
This work was supported by the grants from Natural Science Foundation of Zhejiang province (LY18H070003) and Health Department of Zhejiang province (2018KY522).References
1. Khan A, Petropoulos IN, Ponirakis G, Malik RA. Visual complications in diabetes mellitus: beyond retinopathy. Diabet Med. 2017;34(4):478-484.
2. Moheet A, Mangia S, Seaquist ER. Impact of diabetes on cognitive function and brain structure. Ann N Y Acad Sci. 2015;1353:60-71.
3. van Duinkerken E, Schoonheim MM, Sanz-Arigita EJ, et al. Resting-state brain networks in type 1 diabetic patients with and without microangiopathy and their relation to cognitive functions and disease variables. Diabetes. 2012;61(7):1814-1821.
4. van Duinkerken E, Ijzerman RG, van der Zijl NJ, et al. Differential impact of subclinical carotid artery disease on cerebral structure and functioning in type 1 diabetes patients with versus those without proliferative retinopathy. Cardiovasc Diabetol. 2014;13:58.
5. van Duinkerken E, Ryan CM, Schoonheim MM, et al. Subgenual Cingulate Cortex Functional Connectivity in Relation to Depressive Symptoms and Cognitive Functioning in Type 1 Diabetes Mellitus Patients. Psychosom Med. 2016;78(6):740-749.
6. Biswal B, Yetkin FZ, Haughton VM, Hyde JS. Functional connectivity in the motor cortex of resting human brain using echo-planar MRI. Magn Reson Med. 1995;34(4):537-541.
7. Chao-Gan Y, Yu-Feng Z. DPARSF: A MATLAB Toolbox for "Pipeline" Data Analysis of Resting-State fMRI. Front Syst Neurosci. 2010;4:13.
8. Tomasi D, Volkow ND. Functional connectivity density mapping. Proc Natl Acad Sci U S A. 2010;107(21):9885-9890.
9. Goto M, Abe O, Aoki S, et al. Diffeomorphic Anatomical Registration Through Exponentiated Lie Algebra provides reduced effect of scanner for cortex volumetry with atlas-based method in healthy subjects. Neuroradiology. 2013;55(7):869-875.
10. Glasser MF, Rilling JK. DTI tractography of the human brain's language pathways. Cereb Cortex. 2008;18(11):2471-2482.
11. Xu J, Wang J, Fan L, et al. Tractography-based Parcellation of the Human Middle Temporal Gyrus. Sci Rep. 2015;5:18883.
12. Lee HW, Hong SB, Seo DW, Tae WS, Hong SC. Mapping of functional organization in human visual cortex: electrical cortical stimulation. Neurology. 2000;54(4):849-854.
13. Martin PR. Colour through the thalamus. Clin Exp Optom. 2004;87(4-5):249-257.
14. Basso MA, Uhlrich D, Bickford ME. Cortical function: a view from the thalamus. Neuron. 2005;45(4):485-488.
15. Eichenbaum H. Hippocampus: cognitive processes and neural representations that underlie declarative memory. Neuron. 2004;44(1):109-120.
16. Revsin Y, Saravia F, Roig P, et al. Neuronal and astroglial alterations in the hippocampus of a mouse model for type 1 diabetes. Brain Res. 2005;1038(1):22-31.
17. Herrero MT, Barcia C, Navarro JM. Functional anatomy of thalamus and basal ganglia. Childs Nerv Syst. 2002;18(8):386-404.
18. Sherman SM, Guillery RW. Functional organization of thalamocortical relays. J Neurophysiol. 1996;76(3):1367-1395.
19. Reale RA, Calvert GA, Thesen T, et al. Auditory-visual processing represented in the human superior temporal gyrus. Neuroscience. 2007;145(1):162-184.
20. Bigler ED, Mortensen S, Neeley ES, et al. Superior temporal gyrus, language function, and autism. Dev Neuropsychol. 2007;31(2):217-238.
Figures