5295
Whole-brain connectivity in patients with Pediatric Cerebellar Ataxia1Human Physiology Section of the DePT, Università degli Studi, Milano, Italy, 2Department of Brain and Behavioral Science, Università degli Studi, Pavia, Italy, 3Neuroradiology Department, Fondazione IRCCS Istituto Neurologico "C. Besta", Milano, Italy, 4Developmental Neurology Department, Fondazione IRCCS Istituto Neurologico "C. Besta", Milano, Italy, 5Department of Neuroinflammation, UCL Queen Square Institute of Neurology, Faculty of Brain Sciences, University College London, NMR Research Unit, Queen Square MS Centre, London, United Kingdom, 6Brain Connectivity Center, IRCCS Mondino Foundation, Pavia, Italy
Synopsis
Keywords: Neuro, Brain Connectivity, Ataxia
For the first time, brain networks of pediatric cerebellar ataxic patients were characterized in order to explain the different postural motor behavior of subjects suffering from non-progressive and slow-progressive illness. This work revealed volume differences in several cerebellar regions and specific alterations of white matter tracts. This result reinforces the hypothesis of the existence of a compensatory strategy which may involve cortical areas and basal ganglia to compensate for cerebellar deficits.Introduction
Pediatric Cerebellar Ataxias (PCAs) are an heterogeneous group of developmental disorders affecting cerebellum. In a recent work, it has been demonstrated that patients with Joubert syndrome (non-progressive ataxia, NonP) can surprisingly show postural motor behavior comparable to that of healthy controls, differently to slow-progressive ataxia patients (SlowP) that reported an increased postural sway1. This difference may depend on the non-progressive nature of NonP, since children with complete cerebellar agenesis are able to recover part of their limb functionality2. Such functional “compensation” might be due to a hyper-functioning of the intact brain areas that have to cope with a stable lesion. To reveal the existence of a compensatory strategy that involves the interaction of the cerebellum with other intact brain regions, brain connectivity of an heterogeneous cohort of PCA patients was investigated and differences between cerebral networks of NonP and SlowP groups were identified.Methods
Subjects and acquisitionEleven PCA patients, five with NonP (1 female; 22.6±6.4years) and six with SlowP (3 females; 18.6±1.9 years), hospitalized at the Istituto Neurologico "C. Besta", were recruited. Motor impairment was clinically assessed by the Scale for the Assessment and Rating of Ataxia (SARA3). The MRI protocol, acquired with a Philips 3T Achieva scanner, consisted of: 3DT1-weighted sagittal volume (MPRAGE sequence, TR/TE=8.28/3.83 ms, 1 mm isotropic resolution) and diffusion-weighted axial images (SE-EPI sequence, TR/TE=8400/85 ms, 2.5 mm isotropic resolution, b=1000, 2000 s/mm2, 32 isotropically distributed directions/shell, 7 b0 images).
Multimodal dataset analysis
The analysis was performed combining FSL4 and MRtrix35 commands within MATLAB6. An ad-hoc atlas comprising 128 regions was created combining 95 cortical and subcortical cerebral (AAL7), and 33 cerebellar (SUIT8) labels. 3DT1-weighted volumes were segmented as white matter (WM), gray matter (GM), subcortical GM, and cerebrospinal fluid. Diffusion-weighted data were preprocessed, fitted to calculate maps of fractional anisotropy (FA) and mean diffusivity (MD) from the Diffusion Tensor model; 30 million streamlines whole-brain Anatomically-Constrained Tractography9–11 was also performed.
Volumetric and tracts analysis
To structurally characterize PCA patients, the volume of WM, GM, and the other brain structures defined with the ad hoc atlas were calculated in mm3. Then, in order to account for different brain sizes, all volumes were divided for the total intracranial volume (i.e. the sum of WM, GM and CSF).
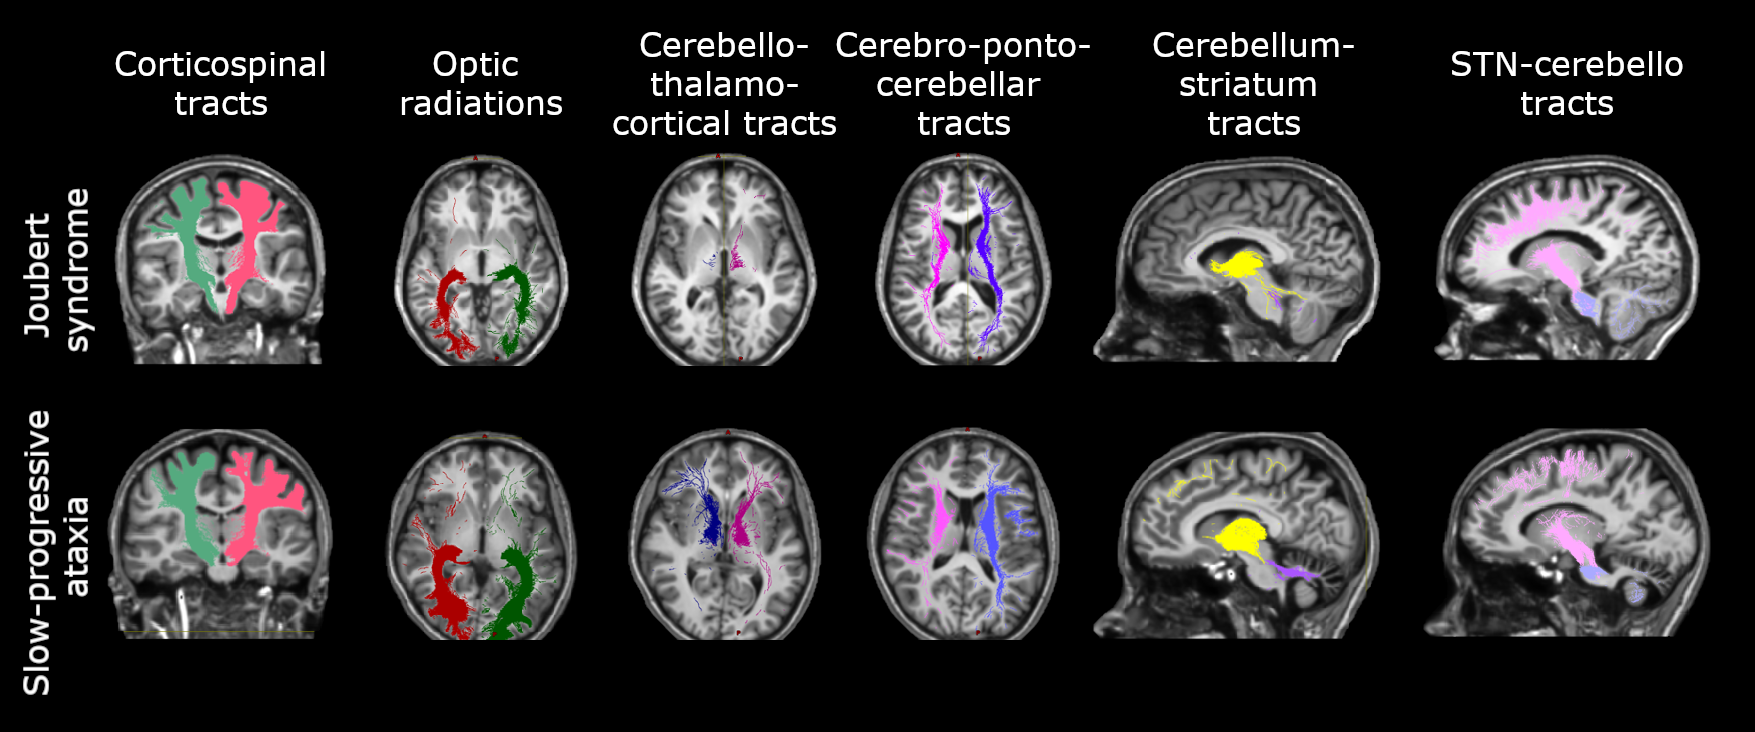
Brain connectivity was investigated reconstructing specific tracts such as the corticospinal tract (CST), the optic radiations (OR), the main afferent and efferent cerebro-cerebellar tracts to the cerebellum (cortico-ponto-cerebellar, CPC and cerebello-thalamo-cortical, CTC respectively), and the connections between basal ganglia and cerebellum, I.e. from subthalamic nucleus to cerebellum (STN-Cb) and from cerebellum to striatum (Striatum-Cb) (Figure 1). Tracts were characterized by calculating the number of streamlines, mean FA and MD within each tract.
Statistics
Statistical tests were performed using SPSS 25 (IBM, Armonk, New York, United States). All data were normally distributed (Shapiro-Wilk test), thus independent t-tests were performed between brain volumes and tracts features (streamlines, FA, MD) of NonP and SlowP patients. A multiple regression analysis for age and gender was performed to assess if SARA score variance could be explained by brain or tract volumes (I.e. number of streamlines).
Results
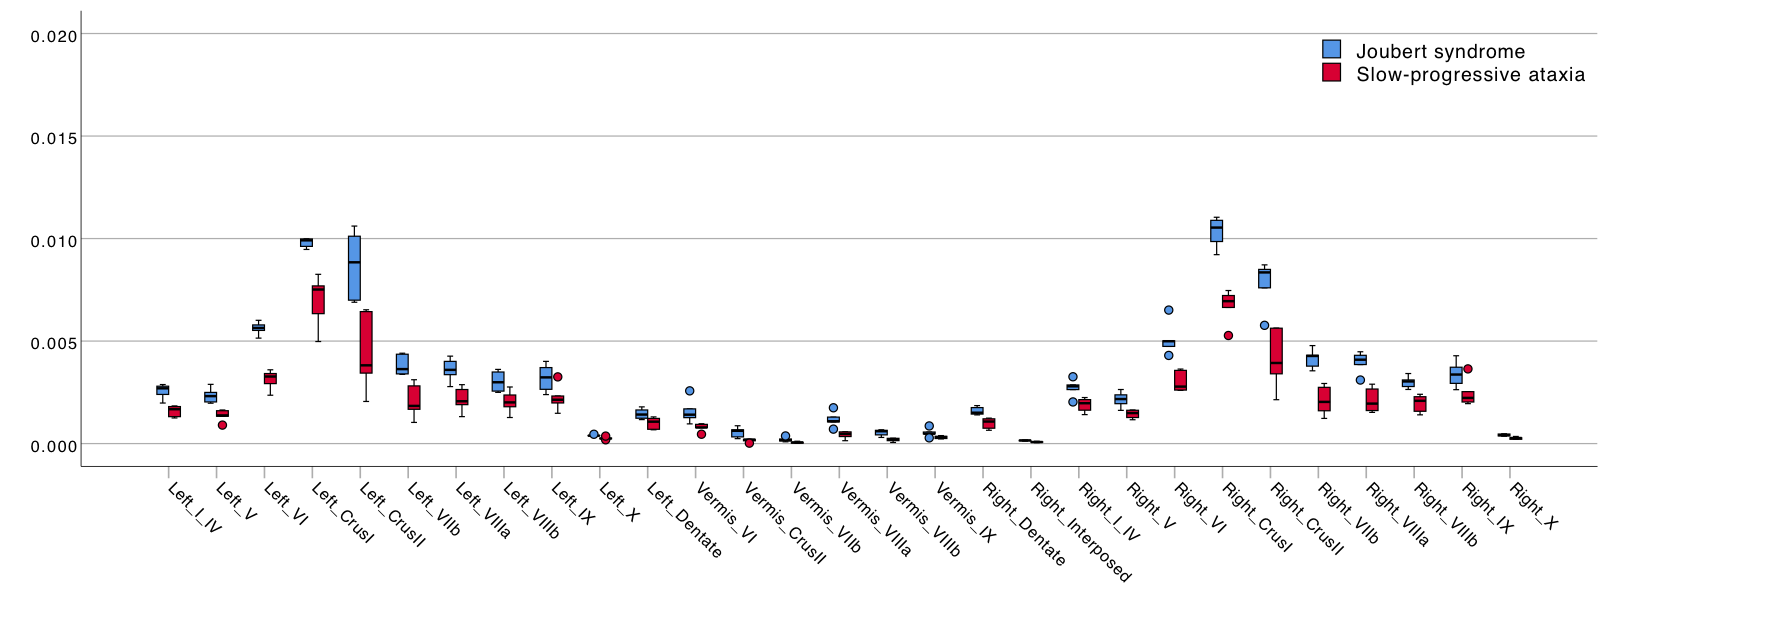
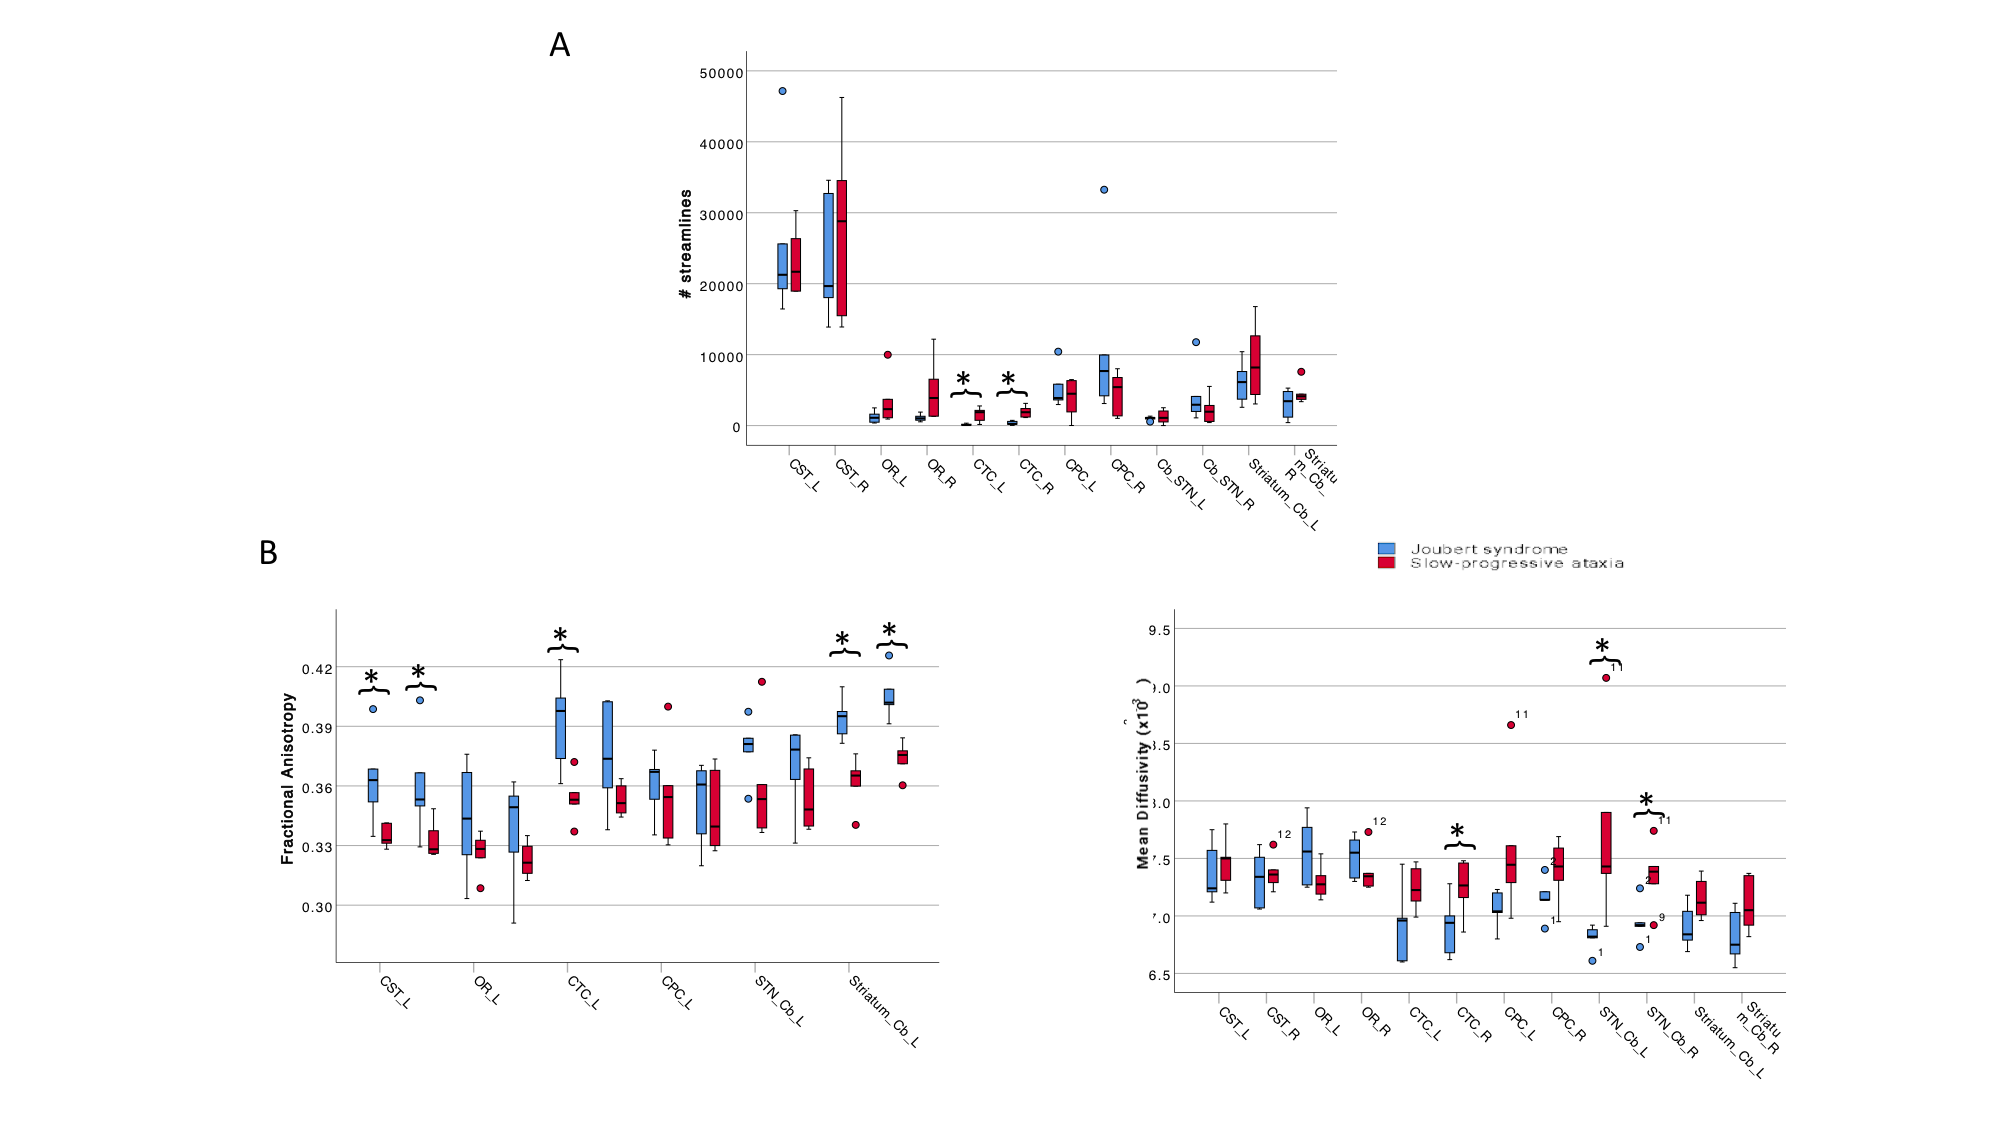
All cerebellar regions, with the only exception of the vermis of lobule X and left interposed nucleus, showed smaller volume in SlowP with respect to NonP patients (Figure 2).Figure 3 reports that NonP patients are characterized by lower number of streamlines of the right and left CTC tracts (Figure 3A), and higher FA of right and left CST, left CTC and right and left Striatum-Cb with respect to SlowP ones. On the other hand, MD values of right STN-Cb and left and right CTC were lower in NonP group compared to SlowP group (Figure 3B).
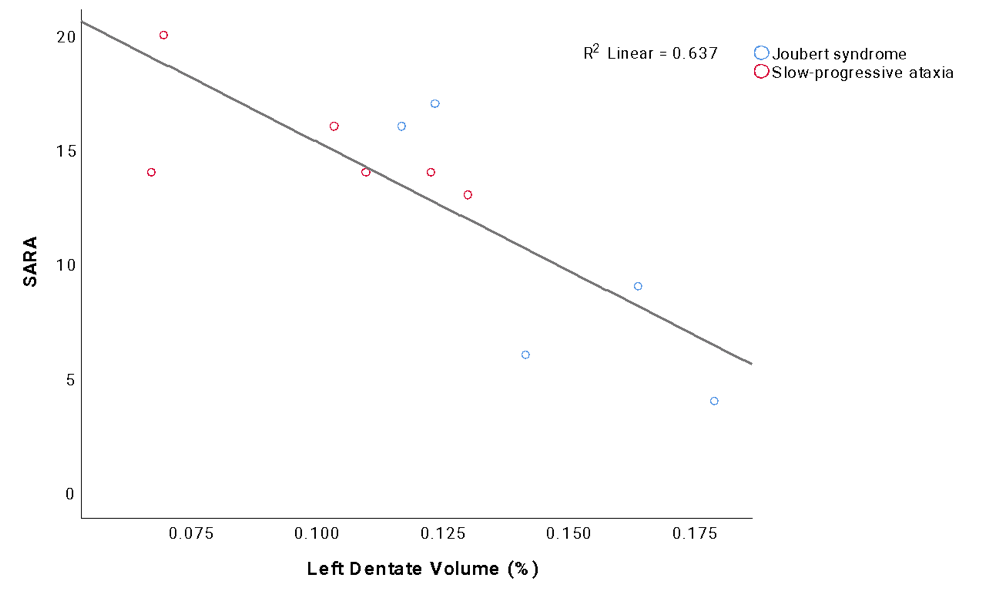
Correlation analysis revealed that no statistical relations were found between SARA and the number of streamlines, while most of the cerebellar volumes correlated with SARA scores. Multiple regression analysis demonstrated that 64% of SARA score variance could be explained (p=0.003) by the volume of left dentate nucleus, which was the region with the highest impact on SARA score (Figure 4).
Discussion
This work provided a biological background for explaining the different postural motor behavior of subjects with non-progressive and progressive ataxic forms by revealing volume differences in several cerebellar regions and specific alterations of WM tracts between different PCA groups.Although NonP subjects were characterized with a lower number of streamlines in bilateral CTC tracts, they showed higher FA and lower MD values with respect to SlowP patients, supporting a higher integrity of cerebro-cerebellar tracts and of bidirectional connections between basal ganglia and cerebellum. This may reinforce our hypothesis of the existence of a compensatory strategy which may involve cortical areas and basal ganglia compensating for cerebellar deficits12. Further attention should be given also to the dentate nucleus volume, given it is a predictor of SARA score variance, especially as a potential in vivo imaging biomarker of rehabilitative interventions.
Acknowledgements
This research received funding by H2020 Research and Innovation Action Grants Human Brain Project 785907 and 945539 (SGA2 and SGA3) and by the MNL Project “Local Neuronal Microcircuits” of the Centro Fermi (Rome, Italy) to ED and FP. CGWK receives funding from the UK MS Society (#77), Wings for Life (#169111), Horizon2020 (CDS-QUAMRI, #634541), BRC (#BRC704/CAP/CGW).References
(1) Farinelli, V.; Palmisano, C.; Marchese, S. M.; Strano, C. M. M.; D’Arrigo, S.; Pantaleoni, C.; Ardissone, A.; Nardocci, N.; Esposti, R.; Cavallari, P. Postural Control in Children with Cerebellar Ataxia. Appl. Sci. 2020, 10 (1606), 1–13. https://doi.org/10.3390/app10051606.
(2) Titomanlio, L.; Romaniello, R.; Borgatti, R. Cerebellar Agenesis. Handb. Cerebellum Cerebellar Disord. 2005, 1855–1872. https://doi.org/10.1007/978-94-007-1333-8.
(3) Schmitz-Hübsch, T.; Du Montcel, S. T.; Baliko, L.; Berciano, J.; Boesch, S.; Depondt, C.; Giunti, P.; Globas, C.; Infante, J.; Kang, J. S.; Kremer, B.; Mariotti, C.; Melegh, B.; Pandolfo, M.; Rakowicz, M.; Ribai, P.; Rola, R.; Schöls, L.; Szymanski, S.; Van De Warrenburg, B. P.; Dürr, A.; Klockgether, T.; Fancellu, R. Scale for the Assessment and Rating of Ataxia: Development of a New Clinical Scale. Neurology 2006, 66 (11), 1717–1720. https://doi.org/10.1212/01.wnl.0000219042.60538.92.
(4) Https://Fsl.Fmrib.Ox.Ac.Uk/Fsl/Fslwiki/.
(5) Tournier, J. D.; Smith, R.; Raffelt, D.; Tabbara, R.; Dhollander, T.; Pietsch, M.; Christiaens, D.; Jeurissen, B.; Yeh, C. H.; Connelly, A. MRtrix3: A Fast, Flexible and Open Software Framework for Medical Image Processing and Visualisation. Neuroimage 2019, 202. https://doi.org/10.1016/j.neuroimage.2019.116137.
(6) Https://It.Mathworks.Com/Products/Matlab.Html.
(7) Tzourio-Mazoyer, N.; Landeau, B.; Papathanassiou, D.; Crivello, F.; Etard, O.; Delcroix, N.; Mazoyer, B.; Joliot, M. Automated Anatomical Labeling of Activations in SPM Using a Macroscopic Anatomical Parcellation of the MNI MRI Single-Subject Brain. Neuroimage 2002, 15 (1), 273–289. https://doi.org/10.1006/nimg.2001.0978.
(8) Diedrichsen, J.; Balsters, J. H.; Flavell, J.; Cussans, E.; Ramnani, N. A Probabilistic MR Atlas of the Human Cerebellum. Neuroimage 2009, 46 (1), 39–46. https://doi.org/10.1016/j.neuroimage.2009.01.045.
(9) Jeurissen, B.; Tournier, J. D.; Dhollander, T.; Connelly, A.; Sijbers, J. Multi-Tissue Constrained Spherical Deconvolution for Improved Analysis of Multi-Shell Diffusion MRI Data. Neuroimage 2014, 103, 411–426. https://doi.org/10.1016/j.neuroimage.2014.07.061.
(10) Smith, R. E.; Tournier, J. D.; Calamante, F.; Connelly, A. Anatomically-Constrained Tractography: Improved Diffusion MRI Streamlines Tractography through Effective Use of Anatomical Information. Neuroimage 2012, 62 (3), 1924–1938. https://doi.org/10.1016/j.neuroimage.2012.06.005.
(11) Tournier, J.-D.; Calamante, F.; Connelly, A. Improved Probabilistic Streamlines Tractography by 2 Nd Order Integration over Fibre Orientation Distributions. In Proc Int Soc Magn Reson Med, 2010, p 1670. https://doi.org/10.1016/j.neuroimage.2012.06.005.
(12) Marchese, S. M.; Farinelli, V.; Bolzoni, F.; Esposti, R.; Cavallari, P. Overview of the Cerebellar Function in Anticipatory Postural Adjustments and of the Compensatory Mechanisms Developing in Neural Dysfunctions. 2020. https://doi.org/10.3390/app10155088.
Figures