5288
Impacts of compressed sense-parallel imaging on lung 19F-MRI ventilation imaging measured with tissue-mimicking 1H phantoms.1Newcastle Magnetic Resonance Centre, Newcastle University, Newcastle upon Tyne, United Kingdom, 2Translational and Clinical Research Institute, Newcastle University, Newcastle upon Tyne, United Kingdom
Synopsis
Keywords: Lung, Non-Proton, 19F-MRI
We used 1H test objects to assess the ability to detect and quantify lung ventilation defects using accelerated 19F-MRI ventilation scan protocols. The test objects replicated the spin density and relaxation properties of inhaled perfluoropropane gas and are constructed with signal voids of known dimensions to simulate ventilation defects. Scans were acquired on single- and multi-channel RF receiver arrays, with multiple compressed sensing and parallel imaging (CS/CS-PI) accelerations and scan resolutions at fixed scan duration and field-of-view (FOV). A negative relationship between acceleration and measured ventilation defect diameter was observed with increasing CS acceleration factor, but not for CS-PI scans.
Introduction
Multinuclear MRI scan protocols have been developed to probe the structural and functional properties of the human lung1-3. 19F-MRI of inhaled perfluoropropane (PFP) can report on lung ventilation properties without the need for gas tracer hyperpolarisation4. Our studies to date have employed a 19F transmit/receive single-channel coil, employing fully sampled and accelerated gradient echo scan protocols with compressed sensing (CS)5, 6. Combined compressed sensing-parallel imaging (CS-PI)7 with multi-channel coils offers additional scan acceleration that can enable higher spatial and/or temporal resolution. We performed a systematic evaluation of the impact of CS-PI scan acceleration on image quality using single- and multi-channel 1H RF coils and an aqueous 1H test object that replicated the spin density and relaxation properties of inhaled PFP observed by 19F-MRI at 3.0T (T1= 12.4 ms, T2*= 1.8 ms8), enabling assessment of lung 19F-MRI CS-PI image quality prior to purchase/construction of 19F-MRI receive array hardware. We assessed the performance of gradient echo scan protocols with a scan duration of no more than 15s (ie. achievable in a breathhold for patients with respiratory disease9) in their ability to accurately identify lung ventilation defects of three sizes, with CS/CS-PI acceleration factors of up to 4x, using three 1H RF receiver arrays (single-channel body coil, 6-channel torso and 16-channel torso coils).Methods
Test object constructionTwo containers of H2O-doped D2O solutions (98.75 mM), 2kg and 1.5kg, were constructed containing GdCl3 (6.55 mM) and MnCl2 (1.72 mM) to mimic the relaxation properties (T1= 12.4 ms, T2*= 1.8 ms)8 and spin density (197.5 mM)10 of a 79%/21% inhaled PFP/oxygen gas mixture observed in 19F-MRI. Concentrations of Gd3+ and Mn2+ were derived by simulating the T1 and T2* for an array of contrast agent concentration combinations using Equation 1&211, where CA is concentration of contrast agent, T1o and T2o* denote relaxation rate without contrast agent and r1 and r2* are molar relaxivities of each contrast agent. By finding the minima of resultant rates against our desired relaxation rates (Equation 3), required concentrations of Gd3+ and Mn2+ were determined. Two 2L bottles containing acrylic rods with diameters of 15.0±0.3 mm, 10.0±0.3 mm, and 5.0±0.3 mm were employed to generate signal voids of known sizes within the coronal imaging plane (Figure 1). Deviation of measured rod diameter from ground truth was used to compare scan protocols.
(1)$$ \frac{1}{T_1} = \frac{1}{{T_1}_o}+r_1\left[CA_{{Gd}^{3+}}\right]+r_1\left[CA_{{Mn}^{2+}}\right]$$ (2)$$\frac{1}{T_2^*} = \frac{1}{{T_2}_o^*}+r_2^*\left[CA_{{Gd}^{3+}}\right]+r_2^*\left[CA_{{Mn}^{2+}}\right]$$(3)$$min\left\{\parallel \overrightarrow{T_1}\left(\left[Gd^{3+}\right],\left[Mn^{2+}\right] \right)-12.4\parallel+\parallel \overrightarrow{T_2^*}\left(\left[Gd^{3+}\right],\left[Mn^{2+}\right] \right)-1.8\parallel\right\}$$
MRI data acquisition
Coronal 3D 1H spoiled gradient echo sequences were acquired with field of view (FOV)= 400x330x250 mm3, TR= 7.5 ms, TE= 1.7 ms, flip angle= 50°, and bandwidth= 500 Hz/pixel on a Philips Achieva 3T scanner. Scans were repeated with varying spatial resolution (range: 4x4x4 mm3‑6.25x10x10 mm3). Acquisition time was held approximately constant by varying the NSA used in retrospective CS/CS-PI image reconstruction. Table 1A shows matrix size, resolution, and scan times for an NSA=1 scan at each resolution. Table 1B shows the NSA employed at each resolution and retrospective CS/CS-PI acceleration factor to achieve a scan duration of 15s. This yielded 28 unique scan protocols per RF receiver array (single-channel body coil, 6-channel torso coil, and 16-channel torso coil (Philips)). CS/CS-PI reconstruction was as previously described, extended to CS-PI using ESPIRiT6,7. Scans were zero-filled in MATLAB by a factor of 3 in the in-plane directions.
MRI data analysis
Reconstructed images were segmented using an in-house threshold based semi-automated approach used in our patient 19F-MRI lung ventilation imaging studies9. We measured the diameter of signal voids from a central slice of the binary segmented image in L-R and H-F directions. This was repeated at n=8 known positions for each diameter (Figure 2). Diameter deviation from the ground truth was calculated for each rod size and plotted against acceleration for all resolutions/RF receiver arrays.
Results
Gd3+ and Mn2+ concentrations of 6.55 mM and 1.72 mM achieve 1H T1 and T2* of 12.4 ms and 1.8 ms respectively (Figure 3). Average absolute diameter deviation across acceleration was largest in 5 mm rod diameters for all scans. We expected this as 5 mm was chosen to test scan protocol capability limitation. Correlation coefficients for 5 mm diameter deviations against acceleration factor were: negative (range: -0.9 to -0.6) for single-channel CS reconstructions; mixed (range: -0.1 to 0.9) for 6-channel CS-PI reconstructions and positive (range: 0.3 to 0.9) for 16-channel CS-PI reconstructions (Figure 4). This suggests improved image fidelity for increased acceleration using CS-PI and decreased image fidelity using CS.Discussion and conclusion
Aqueous 1H test objects have been constructed with independent control of spin density, T1 and T2*, enabling replication of inhaled PFP properties as observed by 19F-MRI. We have tested 1H-MRI scan protocols using conventional MRI hardware for sequence optimisation that can be applied to patient lung 19F-MRI studies. Higher acquisition resolutions achieved the lowest absolute error of simulated ventilation defect diameter. A negative impact of acceleration on all measured diameter was observed for CS-accelerated scans. However, no systematic impact of increasing acceleration was observed for multi-channel CS-PI reconstructions. Our data illustrates the value of CS-PI for improvement of 19F-MRI lung scan spatial resolution without impact on scan duration. We plan to integrate optimised CS-PI accelerated scan protocols into studies of patients with respiratory disease.Acknowledgements
This project is funded by the UK Engineering and Physical Sciences Research Council’s Centre for Doctoral Training in Molecular Sciences for Medicine. The authors acknowledge assistance from Matthew Clemence (Philips Clinical Science), and the radiography team at the Newcastle Magnetic Resonance Centre, for help with data acquisition.References
1. Shukla, Y., et al., Hyperpolarized 129Xe Magnetic Resonance Imaging. Academic Radiology, 2012. 19(8): p. 941-951.
2. Van Beek, E.J.R., et al., Functional MRI of the lung using hyperpolarized 3-helium gas. Journal of Magnetic Resonance Imaging, 2004. 20(4): p. 540-554.
3. Schreiber, W.G., et al., Dynamic (19)F-MRI of pulmonary ventilation using sulfur hexafluoride (SF(6)) gas. Magn Reson Med, 2001. 45(4): p. 605-13.
4. Couch, M.J., et al., (19) F MRI of the Lungs Using Inert Fluorinated Gases: Challenges and New Developments. J Magn Reson Imaging, 2019. 49(2): p. 343-354.
5. Lustig, M., D. Donoho, and J.M. Pauly, Sparse MRI: The application of compressed sensing for rapid MR imaging. Magn Reson Med, 2007. 58(6): p. 1182-95.
6. Neal, M.A., et al., Optimized and accelerated 19 F‐MRI of inhaled perfluoropropane to assess regional pulmonary ventilation. Magnetic Resonance in Medicine, 2019. 82(4): p. 1301-1311.
7. Uecker, M., et al., ESPIRiT--an eigenvalue approach to autocalibrating parallel MRI: where SENSE meets GRAPPA. Magn Reson Med, 2014. 71(3): p. 990-1001.
8. Couch, M.J., et al., Pulmonary ultrashort echo time 19F MR imaging with inhaled fluorinated gas mixtures in healthy volunteers: feasibility. Radiology, 2013. 269(3): p. 903-9.
9. Pippard, B.J., et al., Reproducibility of 19 F‐MR ventilation imaging in healthy volunteers. Magnetic Resonance in Medicine, 2021. 85(6): p. 3343-3352.
10. Denison, D.M., M.D. Morgan, and A.B. Millar, Estimation of regional gas and tissue volumes of the lung in supine man using computed tomography. Thorax, 1986. 41(8): p. 620-628.
11. Nofiele, J.T. and H.-L.M. Cheng, Ultrashort Echo Time for Improved Positive-Contrast Manganese-Enhanced MRI of Cancer. PLoS ONE, 2013. 8(3): p. e58617.
Figures
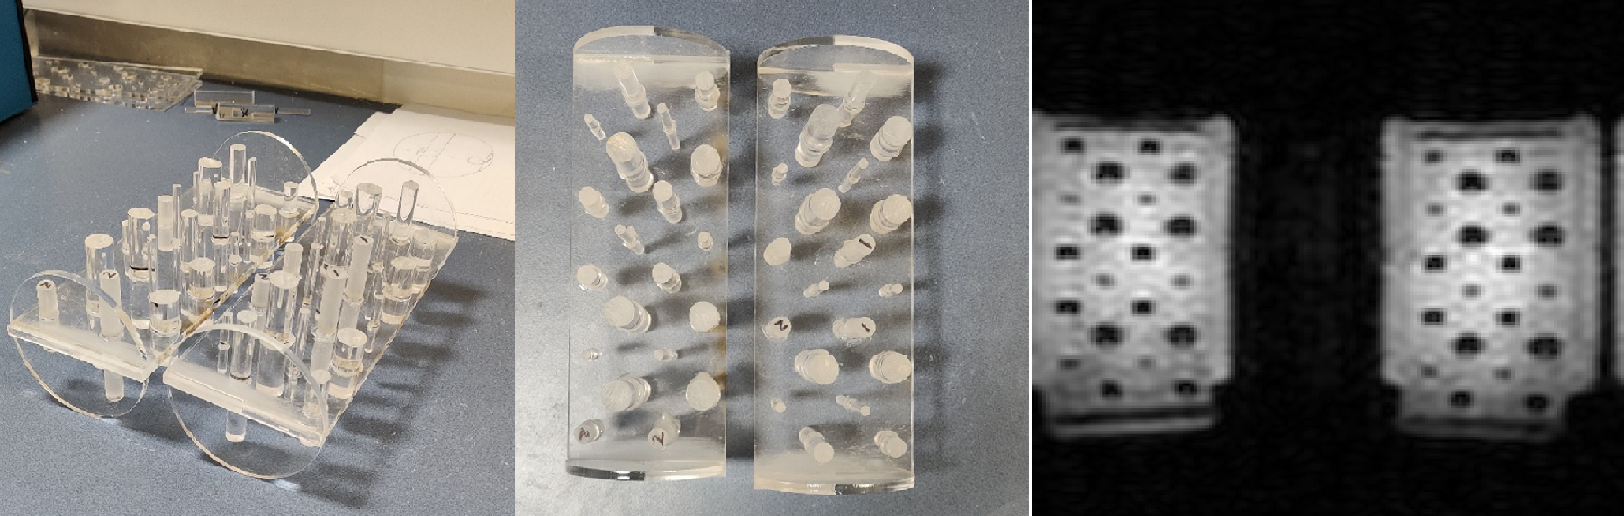
Figure 1: Acrylic inserts within the two D2O/H2O test object bottles with rods of known diameters (5.0±0.3 mm, 10.0±0.3 mm, and 15.0±0.3 mm), and central 1H-MRI image acquired with 6.25x6.25x10 mm resolution.
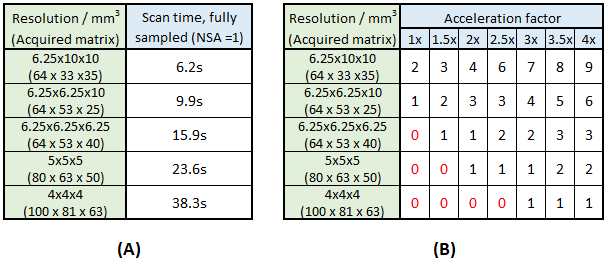
Table 1: A) Scan time for each chosen resolution for a single signal average with no CS-PI acceleration applied. B) Chosen number of signal averages (NSA) possible for each applied acceleration factor at each respective resolution for a fixed scan duration of 15s. Numbers in red show unviable scan duration (>15s).
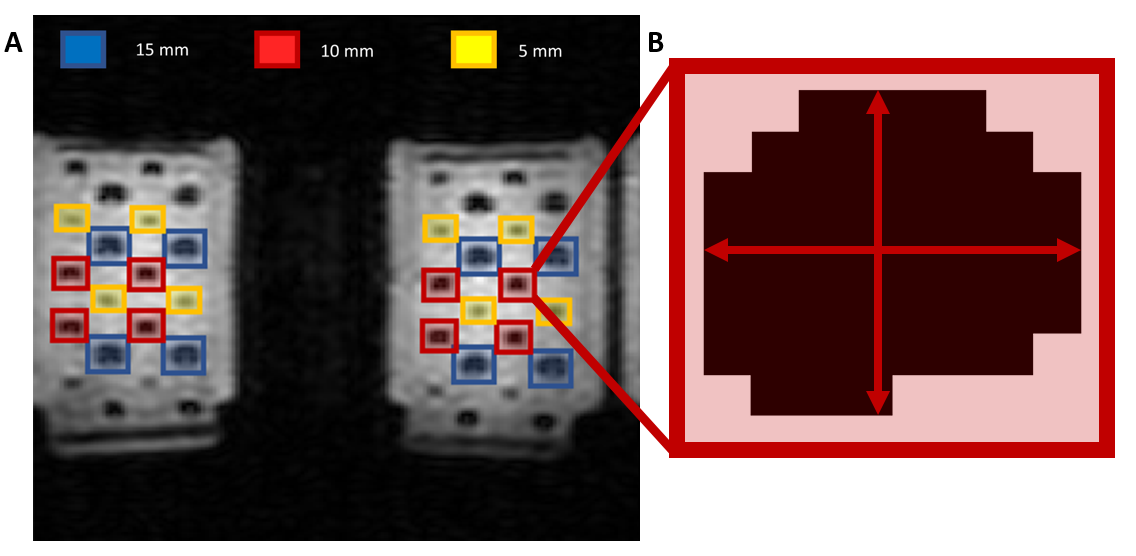
Figure 2: A) Region of interest (ROI) selection for 1H test objects (6.25x6.25x10 mm3 coronal 3D spoiled gradient echo sequence with scan acceleration of 2 and number of signal averages (NSA) = 3). Diameters of 8 acrylic rods of each size (5,10,15 mm) were analysed to determine dimensions for each in-plane direction. B) Segmented binary image from which signal void diameter was calculated in both in-plane directions.
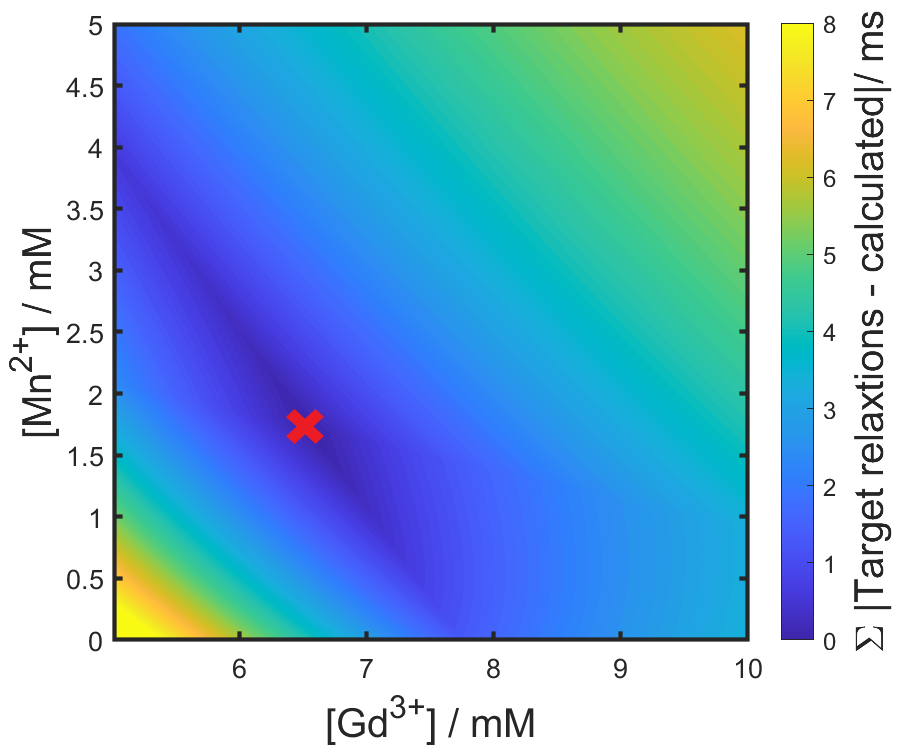
Figure 3: Contour plot of the sum of absolute difference of target 1H T1 (T1 = 12.4 ms) and T2* (T2* = 1.8 ms) against the calculated T1 and T2* for a range of Gd3+ and Mn2+ concentrations. Concentrations with the lowest difference from target relaxation rates are calculated to be 6.55 mM and 1.72 mM for Gd3+ and Mn2+ respectively, marked by a red cross.
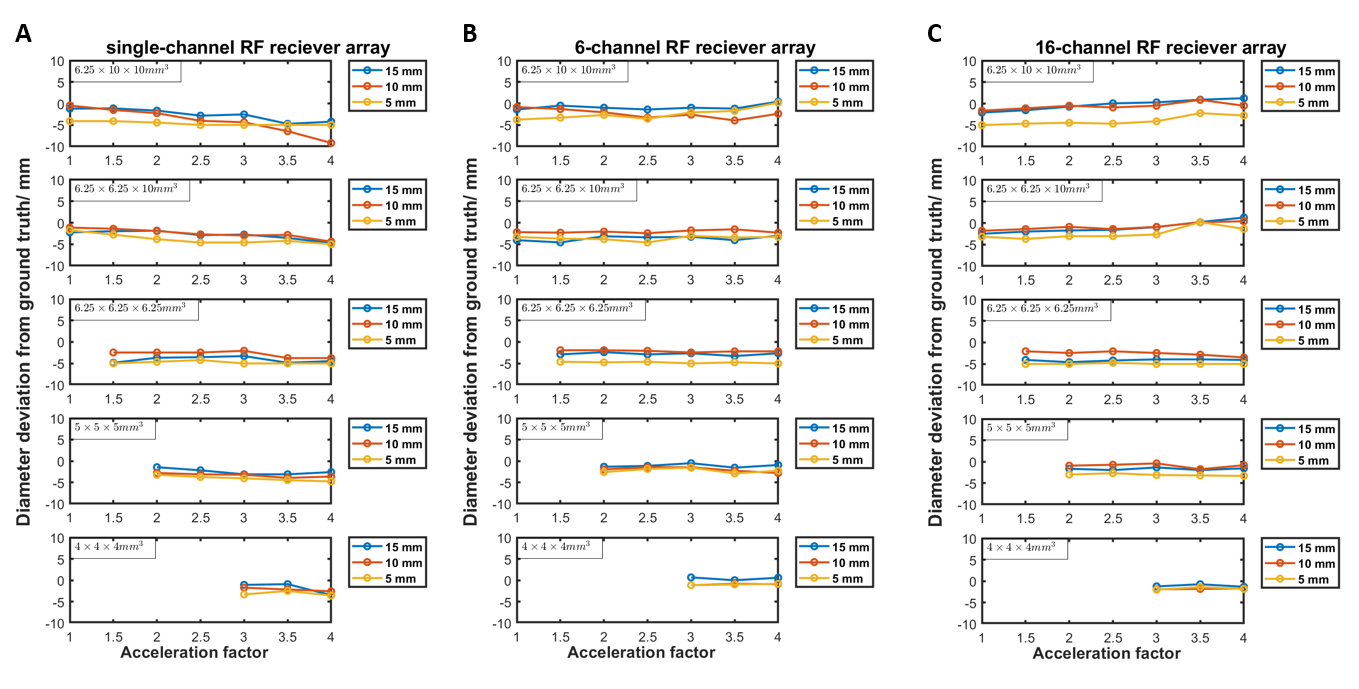
Figure 4: Measured diameter deviation from ground truth of each of the 3 rod diameters (15.0±0.3 mm, 10.0±0.3 mm, and 5.0±0.3 mm), plotted against acceleration factor for each of the acquired scan resolutions, for acquisitions made using (A) single-channel (CS only) (B) 6-channel (CS-PI) (C) 16-channel RF receiver array (CS-PI).