5287
Evaluation of a Wearable Bluetooth Sensor at 0.55T1Biomedical Engineering, University of Southern California, Los Angeles, CA, United States, 2Ming Hsieh Department of Electrical and Computer Engineering, University of Southern California, Los Angeles, CA, United States
Synopsis
Keywords: New Devices, Low-Field MRI, Wearable Devices
Compatibility of Bluetooth low energy (BLE) wearable sensors in the MRI environment will enable the creative use of wearable devices to monitor vital signs such as heart rate, respiration rate, blood pressure, temperature, and biochemical markers during a scan. In this work, we demonstrate efficacy of BLE sensors at the novel 0.55T MRI field strength and evaluate the noise in a wearable caused by rapidly switching MRI gradients, as well as MRI noise/artifacts introduced by a BLE wearable.Introduction
The development of wearable sensors is an emerging technology for monitoring subject’s physiological signals while reducing discomfort[1]. These devices can be integrated into clothing or used in standalone form factors such as patches, cuffs, or watches [2]. Most of these devices cannot be employed during a routine MRI scan due to induced currents by the gradient magnetic fields[3].There is value in the development of small wearable devices that can operate inside the MRI environment. The use of circuits, such as receivers, has already been shown to work inside this environment, if they are designed correctly[4, 5]. For wireless signal transfer, Bluetooth Low Energy (BLE) enables low energy transmission and has been used successfully in the MR environment [6–8]. In this work, we evaluate the performance of a custom-made small (25 mm x 25 mm) and low-cost (<$100) wearable BLE device inside the MR environment. The device’s performance is also compared to the optical plethysmograph (PPG) measurements of the Physiological Measurement Unit (PMU) of the scanner.
Methods
We tested a wearable that collects PPG signals via an optical sensor and a SFH 7050 photodiode at 50 Hz sampling frequency [9]. The circuit schematics are shown in Figure 1. The operation of the MR wearable is evaluated on a 0.55T MRI system (prototype MAGNETOM Aera, Siemens Healthineers, Erlangen, Germany) equipped with high-performance gradients (45 mT/m amplitude, 200 T/m/s slew rate). The signals were obtained from a healthy volunteer, after providing written informed consent, under a protocol approved by our Institutional Review Board.Evaluation of Induced Noise on the wearable:
To evaluate noise introduced by the imaging gradients on the wearable, the wearable is placed on a water phantom, as shown in Figure 2(a). As the sensor is operated in reflection mode, the water does not reflect light, thus only noise is obtained. The imaging sequence consists of multiple 2D gradient echo sequences with resolutions 1x1x2 mm3 to 1x1x4 mm3.
Evaluation of Induced Noise on the MR Scan by the Wearable:
To evaluate distortion of the static magnetic field by the ferromagnetic materials inside the wearable, the above setup is used to obtain an image with the wearable attached to a water bottle. Since there can also be interference by the BLE module with the MR receiver, an image is obtained where the wearable is placed at the lower end of the phantom, and this image is obtained again, but with the MR wearable removed.
Wearable Operation During Scanning:
The wearable sensor is placed as illustrated in Figure 2(b). While simultaneously recording data from both sensors, an MR image of the spine is obtained. To evaluate operation during high gradient slew rate sequences, such as spiral[10], a service sequence where the gradient amplitude rises from 0 to Gmax at a high slew rate is also performed during acquisition. The PPG waveforms from both sensors are obtained to evaluate alignment, and heart rate is also extracted (0.3 to 2.5 Hz bandpass) by calculating peak-to-peak duration for every heartbeat based on the peak detection algorithm by Python’s Peakdet [11]
Results
Induced Noise on the wearable:Noise measurements obtained from the wearable attached to the water phantom during imaging are shown in Figure 3. There was no observed increase in the noise during the imaging process.
Induced Noise on the MR Scan by the Wearable:
The 15 mm observed signal loss due to the wearable is shown in Figure 4(a). The results of the influence of the Bluetooth transmission on the MR receiver are shown Figure 4(b). There were no visible changes in the images, and the profile of the image across the cross-section did not show a change in noise level. Dark areas in the corners of the image were used to analyze the noise variance relative to the maximum signal amplitude. With the sensor active, this variance was 0.82%, and 0.83% without. This indicates that Bluetooth transmission does not significantly affect MR receiver noise.
Wearable operation during scanning:
Recorded PPG waves from both sensors are shown in Figure 5(a). There was excellent alignment between the detected peaks of the waves. The calculated heart rate is shown in Figure 5(b). The heart rate from the wearable shows less than 2.15 BPM RMSE with respect to the reference sensor. The time difference between detected peaks (TBLE– TREF) was 20.2 ms ± 13.8 ms.
Discussion
While the sensor was not affected by the MR environment, we observed high sensitivity to motion. Also, the light from the room interfered with the PPG signal, adding noise. The observed 20.2 ms bias is likely due to the delay in the timestamps generation by the mobile device. The next steps are to address these problems for a more seamless operation of the sensor.Conclusion
We demonstrate that a custom-made BLE PPG sensor can operate effectively during 0.55T MRI scanning, with no observable effect on either the sensor signal or image quality. This allowed accurate and precise (within 20ms) wireless monitoring of cardiac pulse wave during MR scans, even at high slew rates. We plan to use this platform to develop new non-invasive sensors for real-time physiological monitoring at 0.55T.Acknowledgements
We acknowledge grant support from the National Science Foundation (#1828736) and research support from Siemens Healthineers.References
[1] Mohammadzadeh N, Gholamzadeh M, Saeedi S, Rezayi S. The application of wearable smart sensors for monitoring the vital signs of patients in epidemics: a systematic literature review. Journal of Ambient Intelligence and Humanized Computing. 2020;1:1–15. doi:10.1007/s12652-020-02656-x
[2] Dieffenderfer JP, Goodell H, Bent B, Beppler E, Jayakumar R, Yokus M, Jur JS, Bozkurt A, Peden D. Wearable wireless sensors for chronic respiratory disease monitoring. In: 2015 IEEE 12th International Conference on Wearable and Implantable Body Sensor Networks (BSN). IEEE; 2015. p. 1–6. http://ieeexplore.ieee.org/document/7299411/. doi:10.1109/BSN.2015.7299411
[3] Medical Advisory Secretariat. Patient Monitoring System for MRI. Ontario Health Technology Assessment Series. 2003;3(7):1–16. http://www.health.gov.on.ca/ohtas.
[4] Reber J, Marjanovic J, Brunner DO, Port A, Schmid T, Dietrich BE, Moser U, Barmet C, Pruessmann KP. An In-Bore Receiver for Magnetic Resonance Imaging. IEEE Transactions on Medical Imaging. 2020;39(4):997–1007. doi:10.1109/TMI.2019.2939090
[5] Sporrer B, Wu L, Bettini L, Vogt C, Reber J, Marjanovic J, Burger T, Brunner DO, Pruessmann KP, Troster G, et al. A Fully Integrated Dual-Channel On-Coil CMOS Receiver for Array Coils in 1.5-10.5 T MRI. IEEE Transactions on Biomedical Circuits and Systems. 2017;11(6):1245–1255. doi:10.1109/TBCAS.2017.2764443
[6] Silemek B, Acikel V, Oto C, Alipour A, Aykut ZG, Algin O, Atalar E. A temperature sensor implant for active implantable medical devices for in vivo subacute heating tests under MRI. Magnetic Resonance in Medicine. 2018;79(5):2824–2832. doi:10.1002/mrm.26914
[7] Pribil J, Přibilová A, Frollo I. Wearable PPG sensor with bluetooth data transmission for continual measurement in low magnetic field environment. In: International Conference on Applied Electronics. Vols. 2021-September. IEEE Computer Society; 2021. doi:10.23919/AE51540.2021.9542901
[8] Vogt C, Reber J, Waltisberg D, Buthe L, Marjanovic J, Munzenrieder N, Pruessmann KP, Troster G. A wearable bluetooth le sensor for patient monitoring during MRI scans. Proceedings of the Annual International Conference of the IEEE Engineering in Medicine and Biology Society, EMBS. 2016;2016-Octob:4975–4978. doi:10.1109/EMBC.2016.7591844
[9] Khan Y, Mauriello ML, Nowruzi P, Motani A, Hon G, Vitale N, Kim J, Foudeh A, Duvio D, Shols E, et al. Design considerations of a wearable electronic-skin for mental health and wellness: balancing biosignals and human factors. bioRxiv. 2021. doi:10.1101/2021.01.20.427496
[10] Lingala SG, Zhu Y, Lim Y, Toutios A, Ji Y, Lo WC, Seiberlich N, Narayanan S, Nayak KS. Feasibility of through-time spiral generalized autocalibrating partial parallel acquisition for low latency accelerated real-time MRI of speech. Magnetic Resonance in Medicine. 2017;78(6):2275–2282. doi:10.1002/mrm.26611
[11] Ross Markello, Elizabeth DuPre. peakdet. 2022 [accessed 2022 Oct 31]. https://github.com/rmarkello/peakdet
Figures
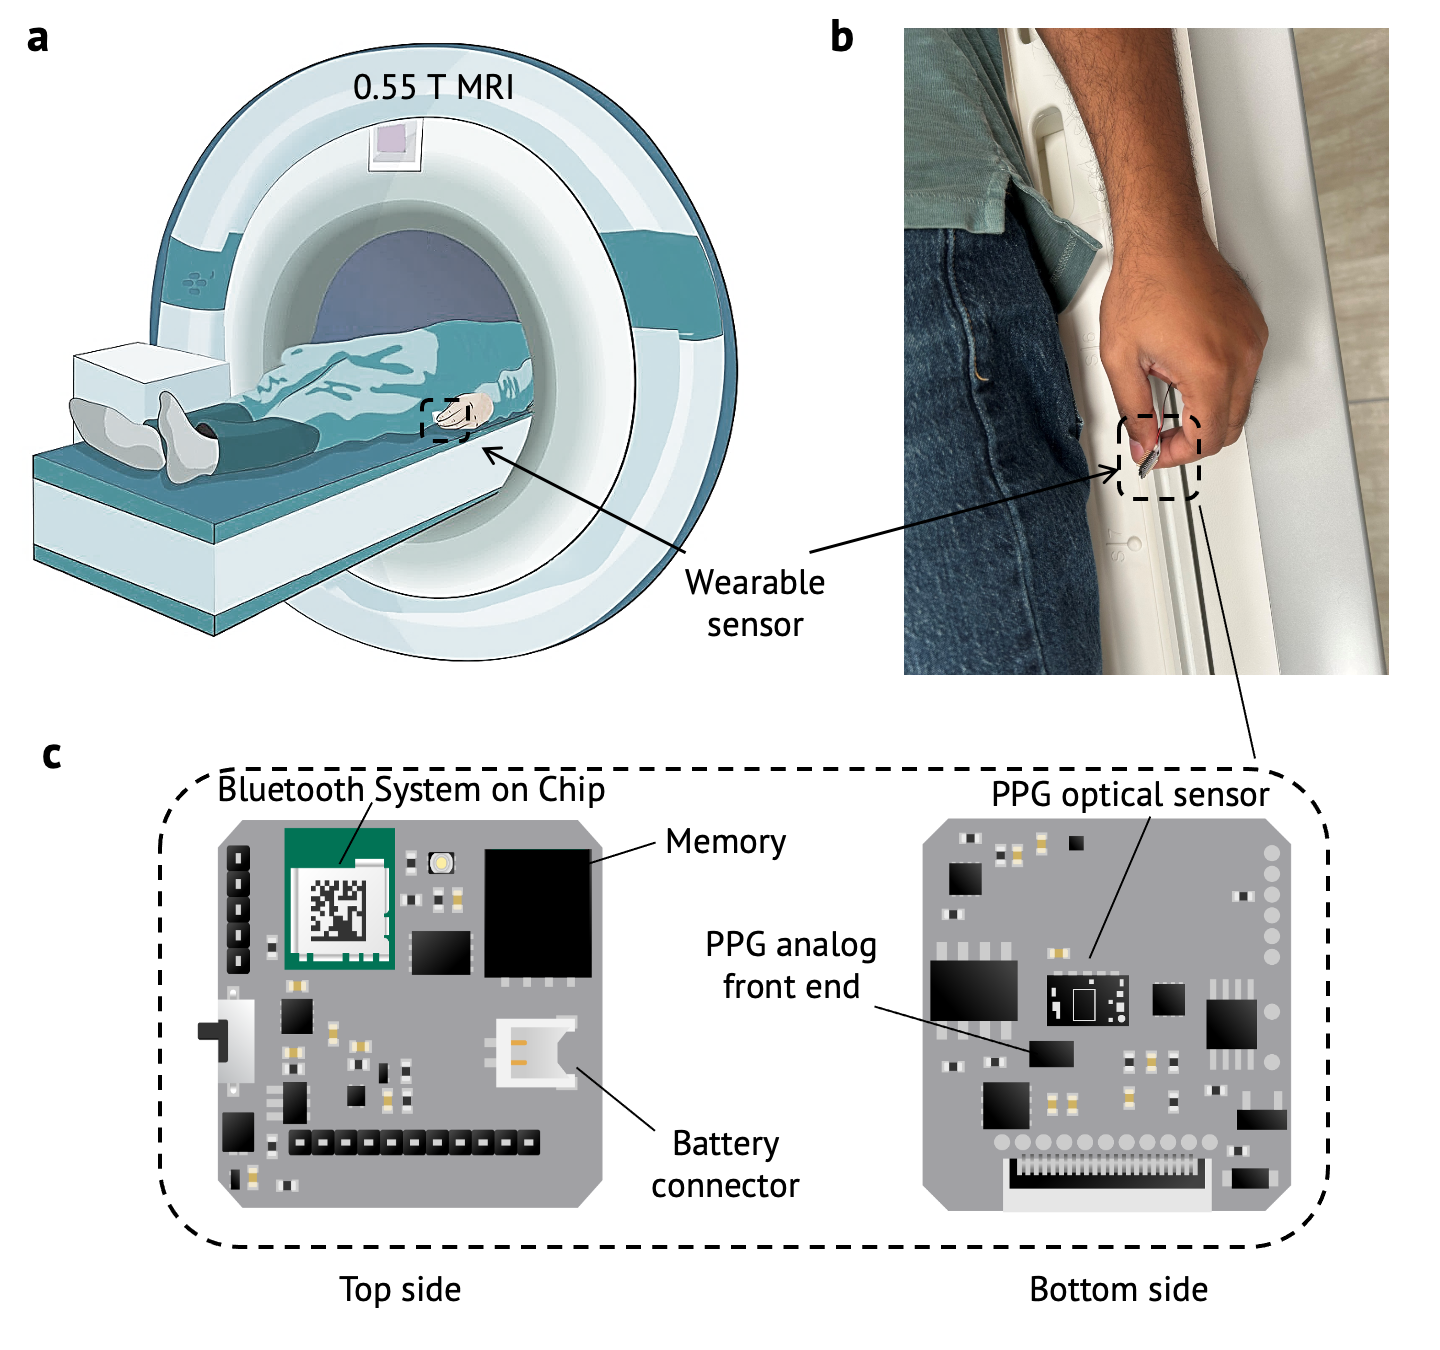
Figure 1: BLE sensor and positioning within the 0.55T MRI environment. a: Positioning of the wearable during scanning. b: The sensor is placed under the left index finger of the volunteer. c: The optical PPG sensor and circuit board components are shown. The dimensions of the sensor are 22 mm by 22 mm.
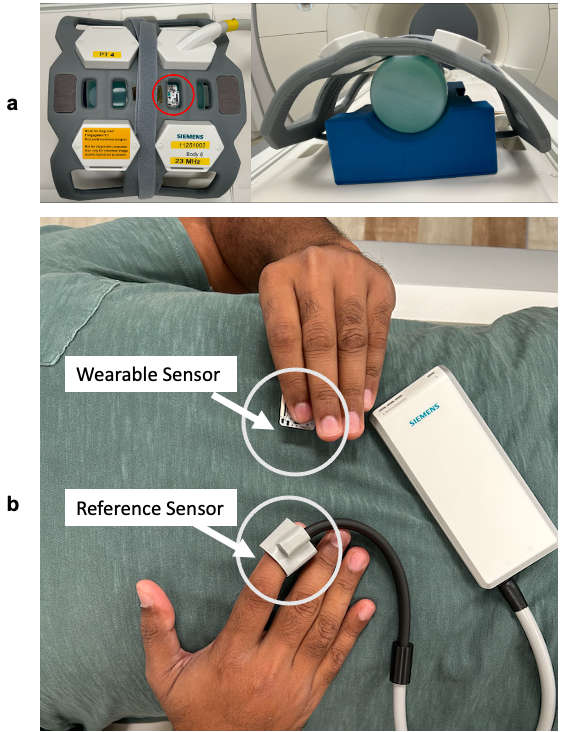
Figure 2: Two testing configurations. a: Setup for evaluating the induced noise on the sensor by the MR gradients, as well as the noise induced in the MR by the wearable. The red circle indicates the location of the wearable above the water phantom. b: Setup for validating heart rate measurements from BLE PPG against the vendor-provided PPG reference sensor. The wearable is placed under the subject’s left thumb, while the reference sensor is placed on the right index finger.
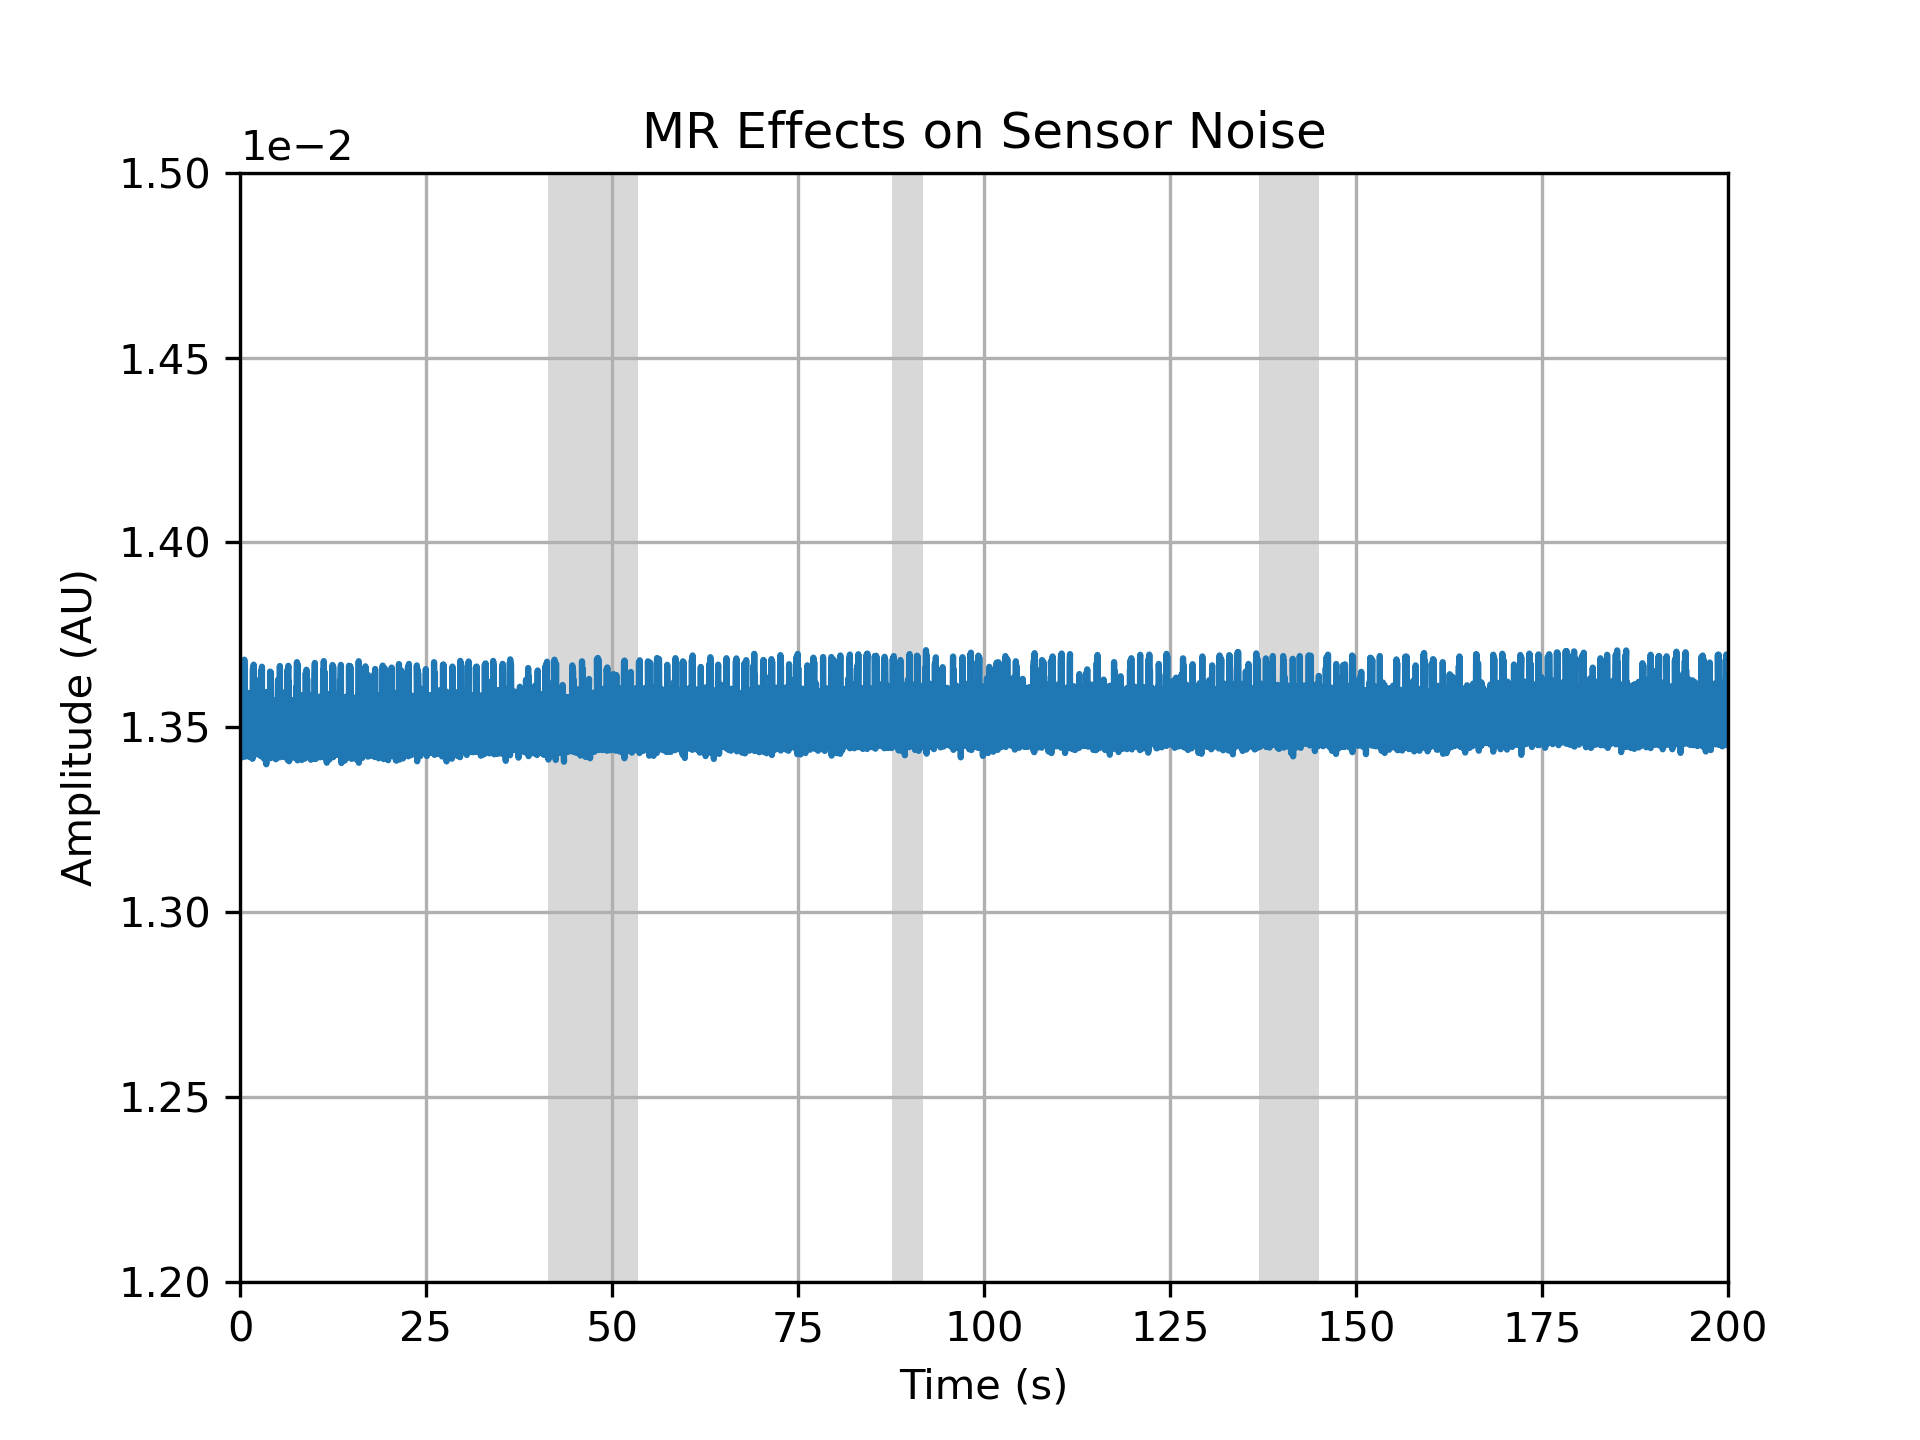
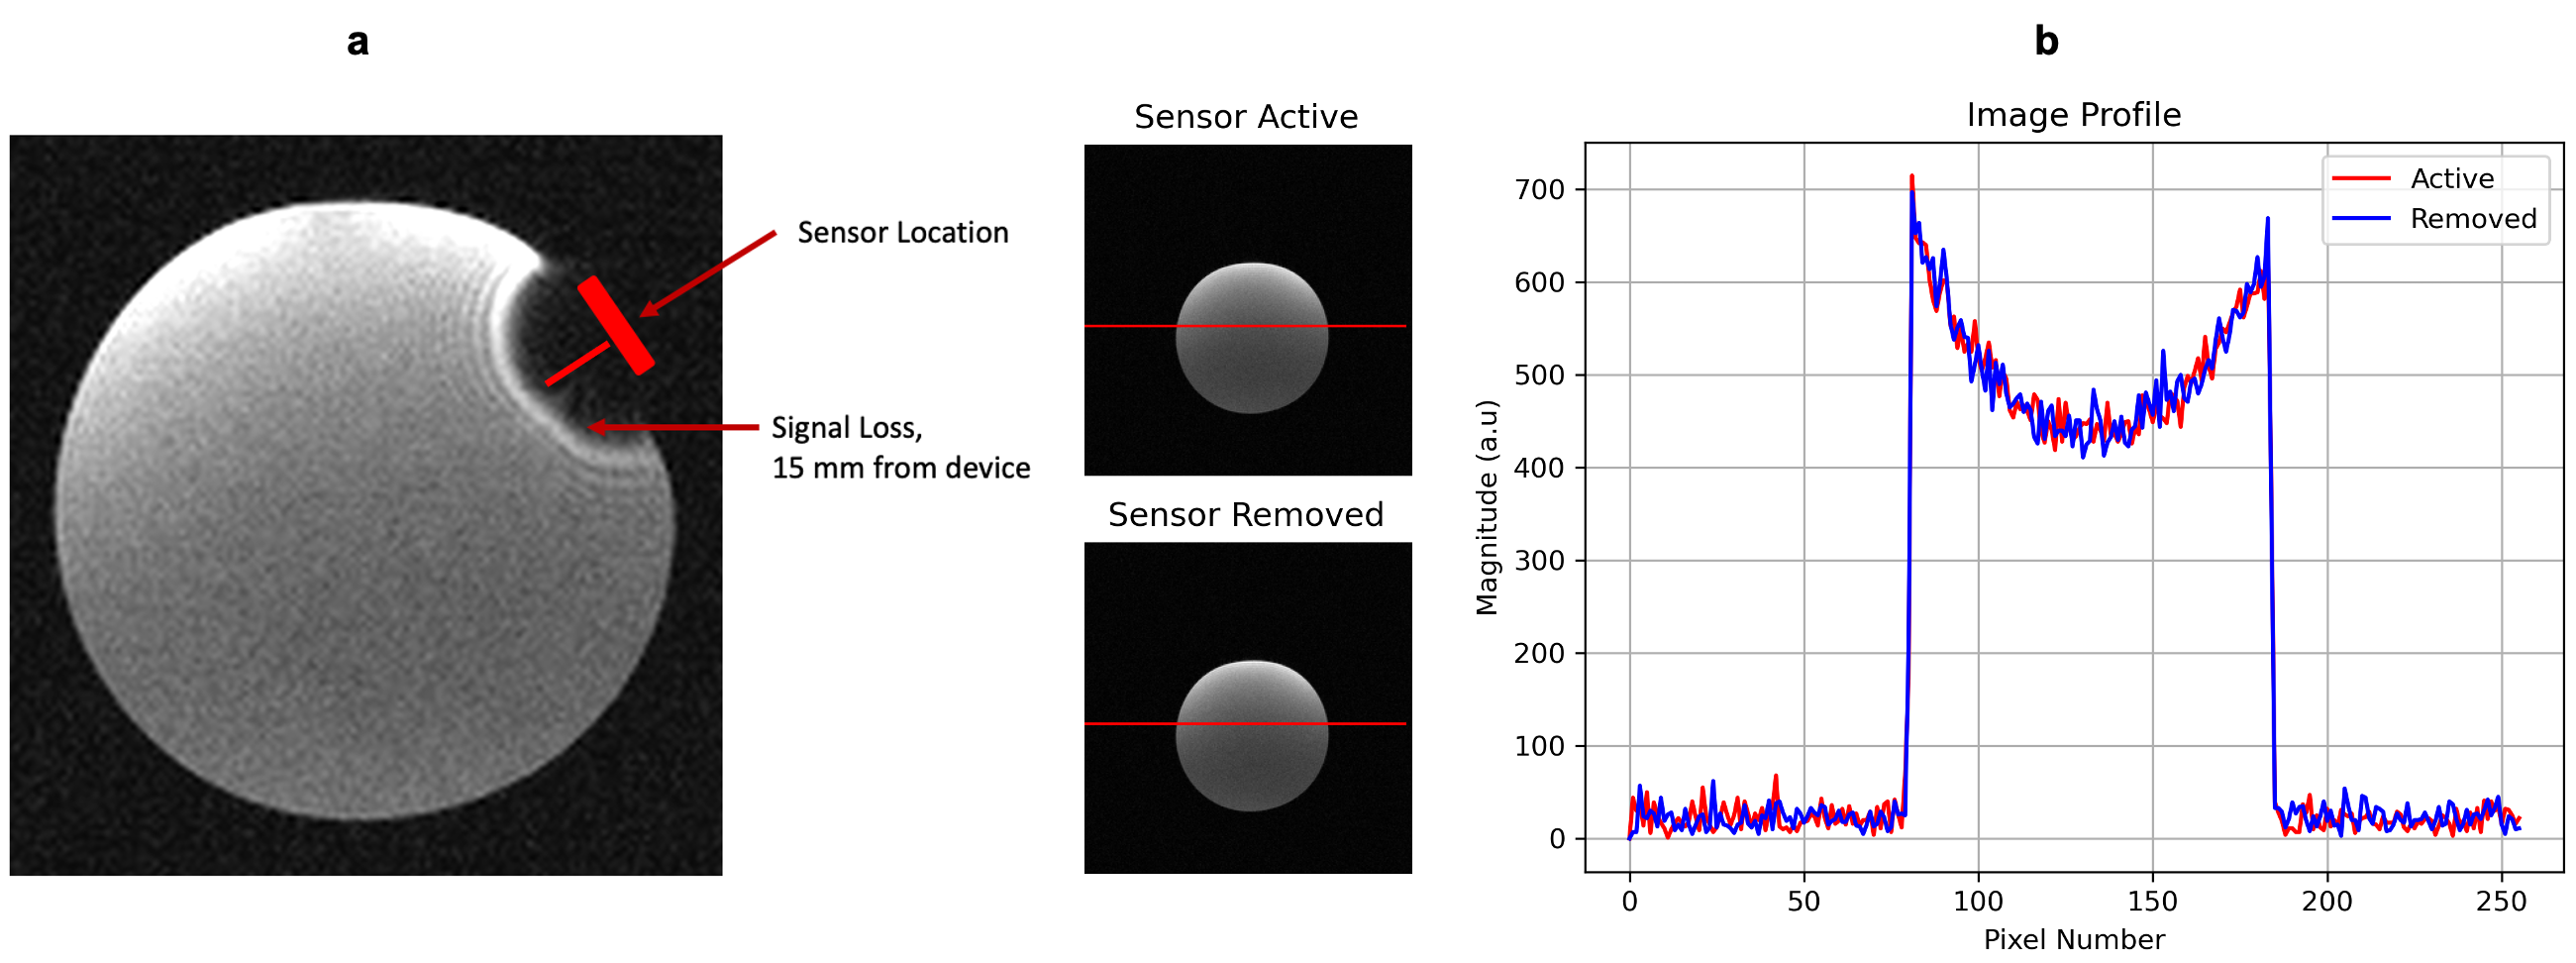
Figure 4: Induced Noise by the Wearable a: Signal loss due to the ferromagnetic materials in the wearable casing. There is a 15 mm signal loss from the device location. b: Reconstructed images with the sensor active and with the sensor removed. There is no visible difference in the reconstructed image, nor in the image profile, as indicated by the profile view on the rightmost graph.
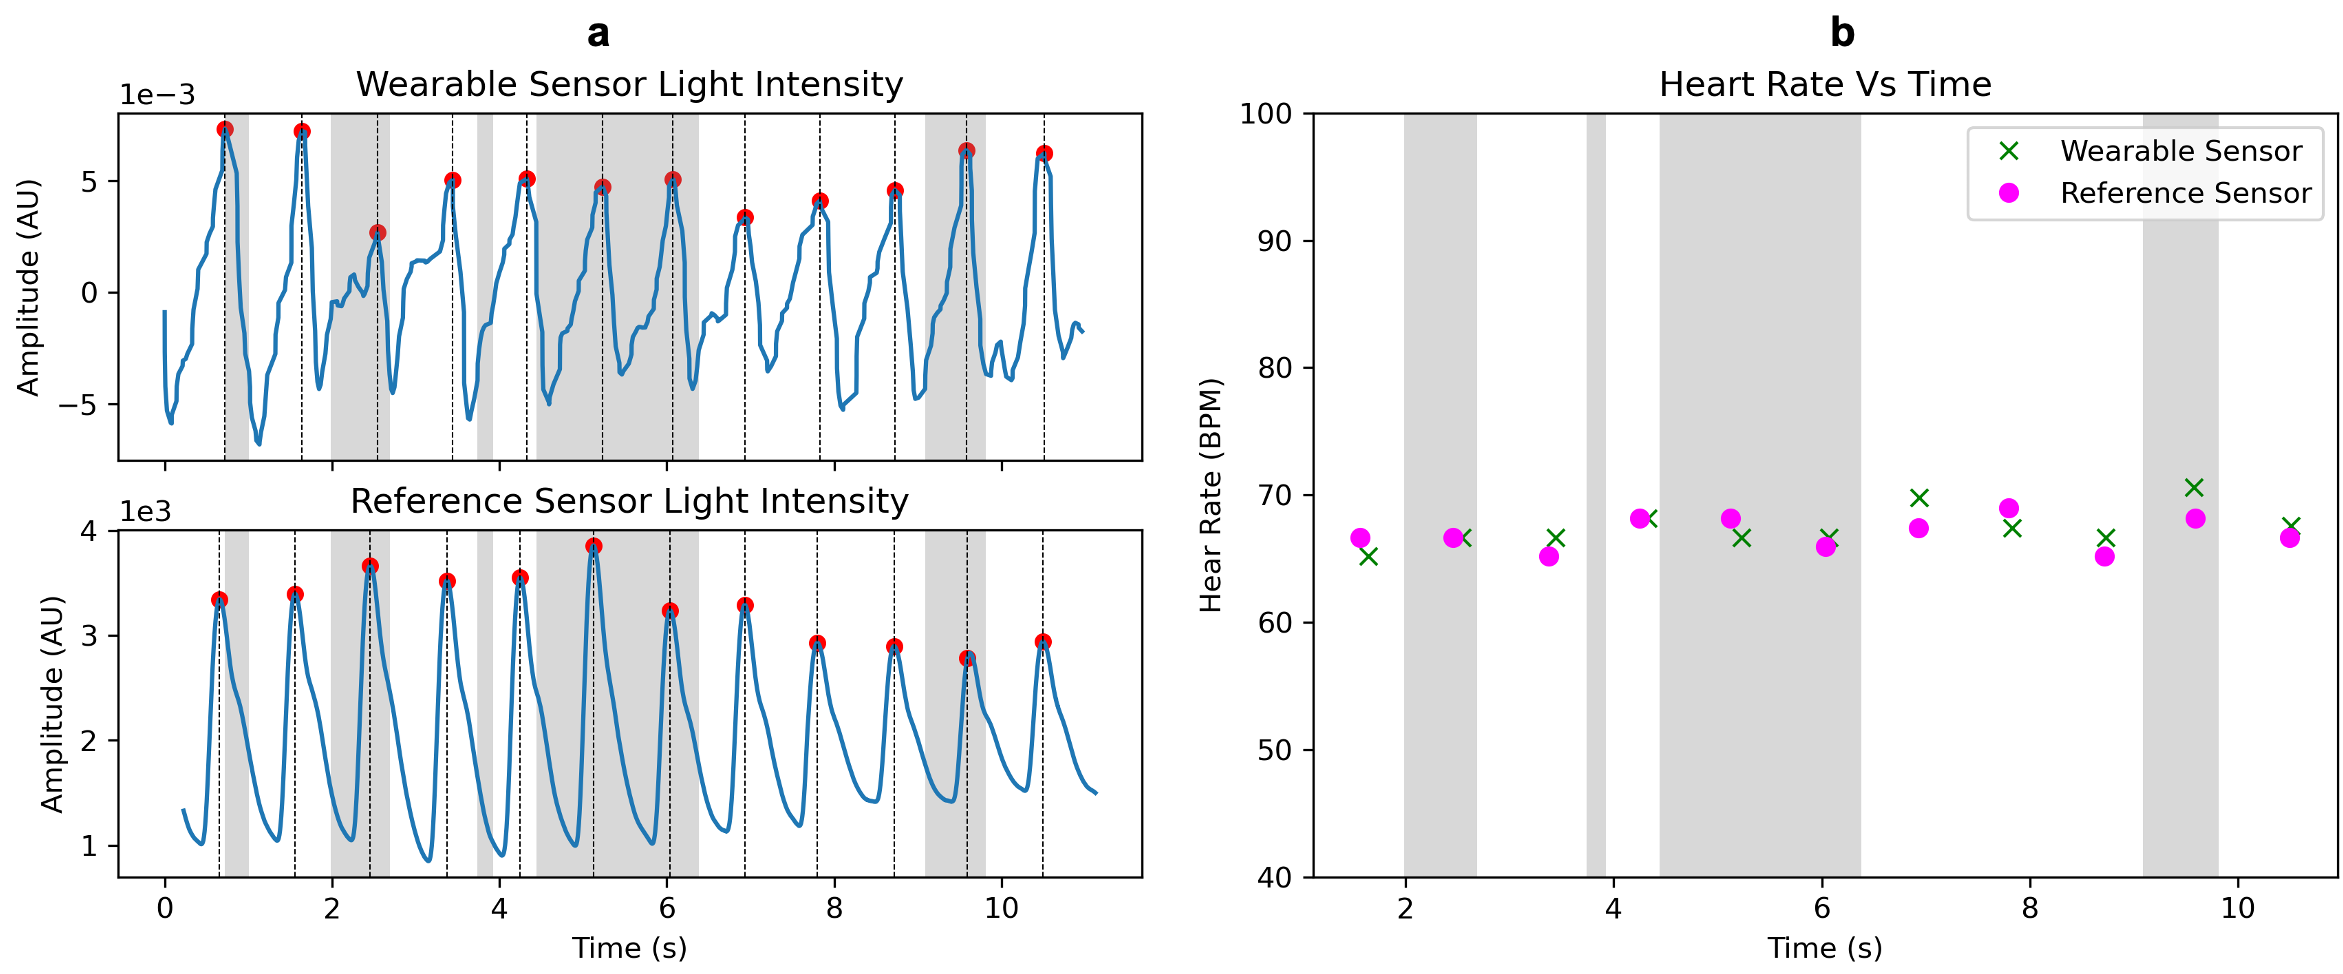
Figure 5: Validation Results. a: Comparison of the (top) wearable PPG with the (bottom) reference PPG. The PPG waves are clearly visible, and the detected peaks from both sensors are aligned within 20.2 ms ± 13.8 ms . b: The heart rate measured during an MR scan, obtained from the peak locations on the left. The RMSE of the wearable with respect to the PMU sensor is less than 2.15 bpm. The gray shaded areas indicate times when the magnetic field gradients are slewing.