5284
Longitudinal MRI study of white matter in multiple sclerosis using surrogates measures of myelin and axonal damage.1Translational Imaging in Neurology (ThINk) Basel, Department of Biomedical Engineering, University Hospital Basel and University of Basel, Basel, Switzerland, 2Department of Neurology, University Hospital Basel, Basel, Switzerland, 3Research Center for Clinical Neuroimmunology and Neuroscience Basel (RC2NB), University Hospital Basel and University of Basel, Basel, Switzerland, 4Division of Radiological Physics, Department of Radiology, University Hospital Basel, Basel, Switzerland, 5Laboratory for Research in Neuroimaging, Department of Clinical Neuroscience, Lausanne University Hospital and University of Lausanne, Lausanne, Switzerland
Synopsis
Keywords: Multiple Sclerosis, Multiple Sclerosis
Damage to the myelin sheath and the neuroaxonal unit are features of multiple sclerosis, as well as reparative processes for both. However, a detailed characterization of the dynamics of those in vivo is challenging. In this longitudinal study, we applied a multi-contrast quantitative MRI approach to disentangle lesion progression in vivo in patients with MS. The microstructural measures were compared between multiple sclerosis groups (55 relapsing-remitting, 24 progressive) and 34 healthy controls. Our results indicate changes in microstructural MRI measures in white matter lesions and normal appearing tissue related to myelin and axonal integrity in RRMS and PMS.Introduction
Pathological studies showed that white matter lesions (WML) in multiple sclerosis (MS) harbor different degrees of axon and myelin damage depending on the lesion type and also on the lesion stage1. Nevertheless, there remains the need to understand and measure the interplay between axon and myelin damage and repair – in vivo in MS patients, which ultimately influences MS evolution and disability. Quantitative MRI (qMRI) techniques provide complementary measures that are sensitive and specific to myelin and axon characteristics2 and some of them have been previously exploited to assess lesion characteristics evolution over time2. In this work, we have exploited a unique combination of qMRI measures providing complementary information about axon properties (i.e. T1-relaxometry, measures derived from models applied to multishell-diffusion) and myelin characteristics (myelin water fraction, MT-saturation) or the relative features of both (g-ratio) so that we could comprehensively describe the microstructural changes occurring in WML over time.Purpose
To investigate the dynamics of myelin, axon damage, and repair in white matter lesions of MS patients using multiple quantitative MRI measures that are sensitive to both myelin and axon integrity.Material and Methods
We performed a longitudinal MRI study (baseline(TP1); two years follow-up(TP2)) in a prospective cohort of 79 patients with MS (RRMS=55, PMS=24) and 34 healthy controls(HC), who underwent a magnetic resonance imaging (MRI)(Table-1). Different tissue microstructure descriptors were assessed: Neurite density index(NDI), Myelin water fraction(MWF), Myelin volume fraction(MVF), Magnetic Transfer saturation(MTsat), Axon Volume Fraction(AVF), g-ratio, and T1- relaxation-time.MRI was performed on a 3 T whole-body MR system(Prisma, Siemens Healthcare, Erlangen, Germany) using a 64-channel phased-array head and neck coil. The MRI protocols included:
(1) 3D FLAIR(TR/TE/TI=5000/386/1800 ms) with 1 mm3 isotropic spatial resolution for lesion detection and morphometric analyses;
(2) Fast acquisition with spiral trajectory and adiabatic T2prep (FAST-T2; spiral TR/TE=7.5/0.5 ms, 6 T2prep times=0,7.5,17.5,67.5,147.5, and 307.5 ms, voxel size=1.25x1.25x5.0mm3, as described in3. MWF maps were reconstructed using a spatially constrained nonlinear fitting applied to FAST-T2 data3;
(3) 3D-RF-spoiled gradient-echo acquisitions with predominantly Magnetization Transfer-weighted (MTw:TR/α=25ms/5o), Proton Density-weighted (PDw:TR/α=25ms/5o) and T1-weighted (T1w:TR/α =11ms/15o) contrast456) to estimate Magnetization Transfer saturation map (MTsat)7. A single gradient echo was acquired TE=4.92ms.
(4) Multi-shell diffusion protocol, 2D-EPI, GRAPPA_aceleration_factor=3, 1.8mm3 isotropic resolution, b-values[0,700,1000,2000, 3000]s/mm2,TE/TR=75ms/4500ms, for neurite orientation and density imaging(NODDI)8;
(5) MP2RAGE (TR/TI1/TI2=5000/700/2500ms), 1mm3 isotropic spatial resolution, for lesion detection and T1w maps assessment.
MTsat maps calculation was implemented with the hMRI-Toolbox9(https://github.com/hMRI-group/hMRI-toolbox). The MVF was estimated based on MTsat map following the calibration procedure in the literature1011121314, utilizing a subset of normal subjects (age range 20-30 years). AVF was assessed based on MVF, and NODDI-intracellular (Neurite Density Index-NDI) and isotropic volume fractions estimated from diffusion protocol imaging12. The g-ratio aggregate measure combines AVF and MVF based on the formula: g-ratio=sqrt(1/(1+MVF/AVF)) Segmentation of WM lesions (WMLs) was performed automatically by using a deep-learning-based method applied to FLAIR and MP2RAGE images15. Afterward, manual correction of automatic WML was performed as a consensus between experienced readers (authors E.R.J, A.C., X.C. and C.G.).
A linear mixed model (LMM) was used to identify the tissue-microstructure variables that best capture changing in time in both NAWM and WML for HC, RRMS and PMS patients. With this model we also explored differences in rate of change between NAWM and lesions. We used as fixed effect factors the group (HC,RRMS,PMS), region(NAWM,WML). Age at first time point, time, and gender as covariates, the subject was defined as random effect (random intercept). Post-hoc Bonferroni correction for multiple comparisons was used.
Results
There were significant differences between groups in age, gender, disease duration and age at TP1 and TP2 (Bonferroni p<0.05)(Table 1).In WML, LMM revealed significant longitudinal decreases in NDI for both patients groups (RRMS: t(77)=19.01,Bonferroni-corrected p<0.001; PMS t(77)=11.40,Bonferroni-corrected p<0.001), AVF (RRMS: t(77)=11.45,Bonferroni-corrected p<0.001; PMS t(77)=5.60),Bonferroni-corrected p<0.001) and gRatio (RRMS: t(77)=10.32, Bonferroni-corrected p<0.001; PMS t(77)=5.14, Bonferroni-corrected p<0.001). An increase in MWF (RRMS: t(77)=−3.02,Bonferroni-corrected p=0.01) was also found in RRMS patients(Table 2 and 3).
In NAWM, LMM showed a significant decrease in NDI for RRMS and PMS patients (RRMS: t(77)=10.57, Bonferroni-corrected p<0.001; PMS t(77)=6.60), Bonferroni-corrected p<0.001) and AVF in RRMS (t(77)=-2.98, Bonferroni-corrected p=0.02)(Table 2 and 3).
Discussion
In this study, we found changes in microstructural MRI measures in WML and NAWM over two years in RRMS and PMS patients. In WML, there was a decrease in NDI for both groups, while gRatio and AVF only decrease in RRMS. The MWF was the only measure showing an increase in WML. In NAWM, a longitudinal decrease in NDI for both groups and an increase in gRatio and AVF for RRMS was found. On the other hand, AVF showed an increase in RRMS.The longitudinal decline in NDI in both lesions and NAWM in RRMS and PMS patients is an indicator of axonal degeneration16 or axonal pathological changes in the form of blisters and blebs17that have been previously described in both WML and NAWM. The gRatio and AVF decrease in WML suggest a loss in axonal integrity18 whereas the increase in WML points to some reparative mechanisms.
Conclusion
We have identified signs of axon and myelin damage and repair by using multiparametric quantitative MRI. Future work will aim at identifying the evolution profiles of single lesions both regionally and voxel-wise.Acknowledgements
No acknowledgement found.References
1. Absinta M, Sati P, Reich DS. Advanced MRI and staging of multiple sclerosis lesions. Nat Rev Neurol. 2016;12(6):358-368. doi:10.1038/nrneurol.2016.59
2. Granziera C, Wuerfel J, Barkhof F, et al. Quantitative magnetic resonance imaging towards clinical application in multiple sclerosis. Brain. 2021;144(5):1296-1311. doi:10.1093/brain/awab029
3. Nguyen TD, Wisnieff C, Cooper MA, et al. T2prep three-dimensional spiral imaging with efficient whole brain coverage for myelin water quantification at 1.5 tesla. Magn Reson Med. 2012;67(3):614-621. doi:10.1002/MRM.24128
4. Helms G, Dathe H, Kallenberg K, Dechent P. High-resolution maps of magnetization transfer with inherent correction for RF inhomogeneity and T 1 relaxation obtained from 3D FLASH MRI. Magn Reson Med. 2008;60(6):1396-1407. doi:10.1002/mrm.21732
5. Helms G, Dechent P. Increased SNR and reduced distortions by averaging multiple gradient echo signals in 3D FLASH imaging of the human brain at 3T. J Magn Reson imaging JMRI. 2009;29(1):198-204. doi:10.1002/jmri.21629
6. Helms G, Dathe H, Dechent P. Quantitative FLASH MRI at 3T using a rational approximation of the Ernst equation. Magn Reson Med Off J Soc Magn Reson Med / Soc Magn Reson Med. 2008;59(3):667-672. doi:10.1002/mrm.21542
7. Weiskopf N, Suckling J, Williams G, et al. Quantitative multi-parameter mapping of R1, PD(*), MT, and R2(*) at 3T: a multi-center validation. Front Neurosci. 2013;7:95. doi:10.3389/fnins.2013.00095
8. Zhang H, Schneider T, Wheeler-Kingshott CA, Alexander DC. NODDI: Practical in vivo neurite orientation dispersion and density imaging of the human brain. Neuroimage. 2012;61(4):1000-1016. doi:10.1016/j.neuroimage.2012.03.072
9. Tabelow K, Balteau E, Ashburner J, et al. hMRI - A toolbox for quantitative MRI in neuroscience and clinical research. Neuroimage. 2019;194:191-210. doi:10.1016/J.NEUROIMAGE.2019.01.029
10. Cercignani M, Giulietti G, Dowell NG, et al. Characterizing axonal myelination within the healthy population: a tract-by-tract mapping of effects of age and gender on the fiber g-ratio. Neurobiol Aging. 2016;49:109-118. doi:10.1016/j.neurobiolaging.2016.09.016
11. Mohammadi S, Carey D, Dick F, et al. Whole-brain in-vivo measurements of the axonal G-ratio in a group of 37 healthy volunteers. Front Neurosci. 2015;9(NOV):1-13. doi:10.3389/fnins.2015.00441
12. Stikov N, Campbell JSW, Stroh T, et al. In vivo histology of the myelin g-ratio with magnetic resonance imaging. Neuroimage. 2015;118:397-405. doi:10.1016/j.neuroimage.2015.05.023
13. Slater DA, Melie-Garcia L, Preisig M, Kherif F, Lutti A, Draganski B. Evolution of white matter tract microstructure across the life span. Hum Brain Mapp. 2019;40(7). doi:10.1002/hbm.24522
14. Mancini M, Giulietti G, Dowell N, et al. Introducing axonal myelination in connectomics: A preliminary analysis of g-ratio distribution in healthy subjects. Neuroimage. 2018;182:351-359. doi:10.1016/J.NEUROIMAGE.2017.09.018
15. La Rosa F, Abdulkadir A, Fartaria MJ, et al. Multiple sclerosis cortical and WM lesion segmentation at 3T MRI: a deep learning method based on FLAIR and MP2RAGE. NeuroImage Clin. 2020;27:102335. doi:10.1016/J.NICL.2020.102335
16. Grussu F, Schneider T, Tur C, et al. Neurite dispersion: a new marker of multiple sclerosis spinal cord pathology? Ann Clin Transl Neurol. 2017;4(9):663-679. doi:10.1002/ACN3.445
17. Luchicchi A, Hart B, Frigerio I, et al. Axon-Myelin Unit Blistering as Early Event in MS Normal Appearing White Matter. Ann Neurol. 2021;89(4):711-725. doi:10.1002/ana.26014
18. Yu F, Fan Q, Tian Q, et al. Imaging G-Ratio in Multiple Sclerosis Using High-Gradient Diffusion MRI and Macromolecular Tissue Volume. Am J Neuroradiol. 2019;40(11):1871-1877. doi:10.3174/AJNR.A6283
Figures
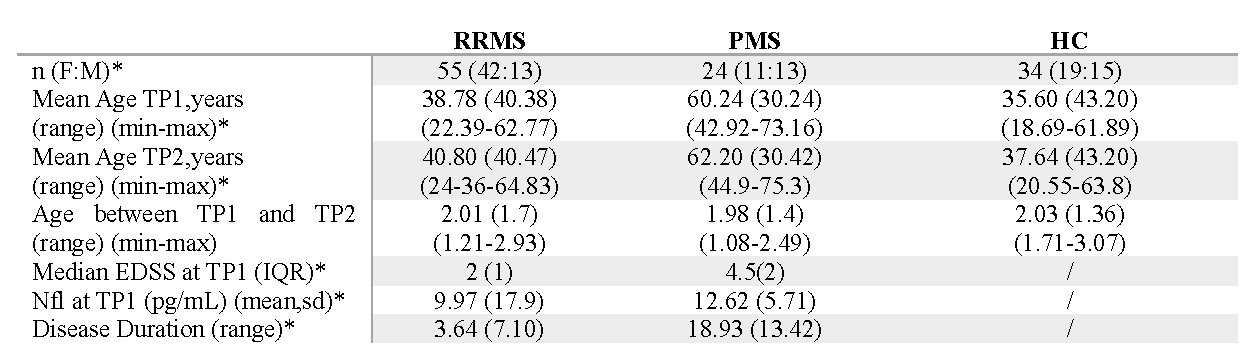
Table1. Cohort’s characteristics. RRMS: relapsing-remitting multiple sclerosis; PMS: progressive multiple sclerosis; HC: healthy controls; EDSS: Expanded Disability Status Scale score; NFL: Neurofilament light.
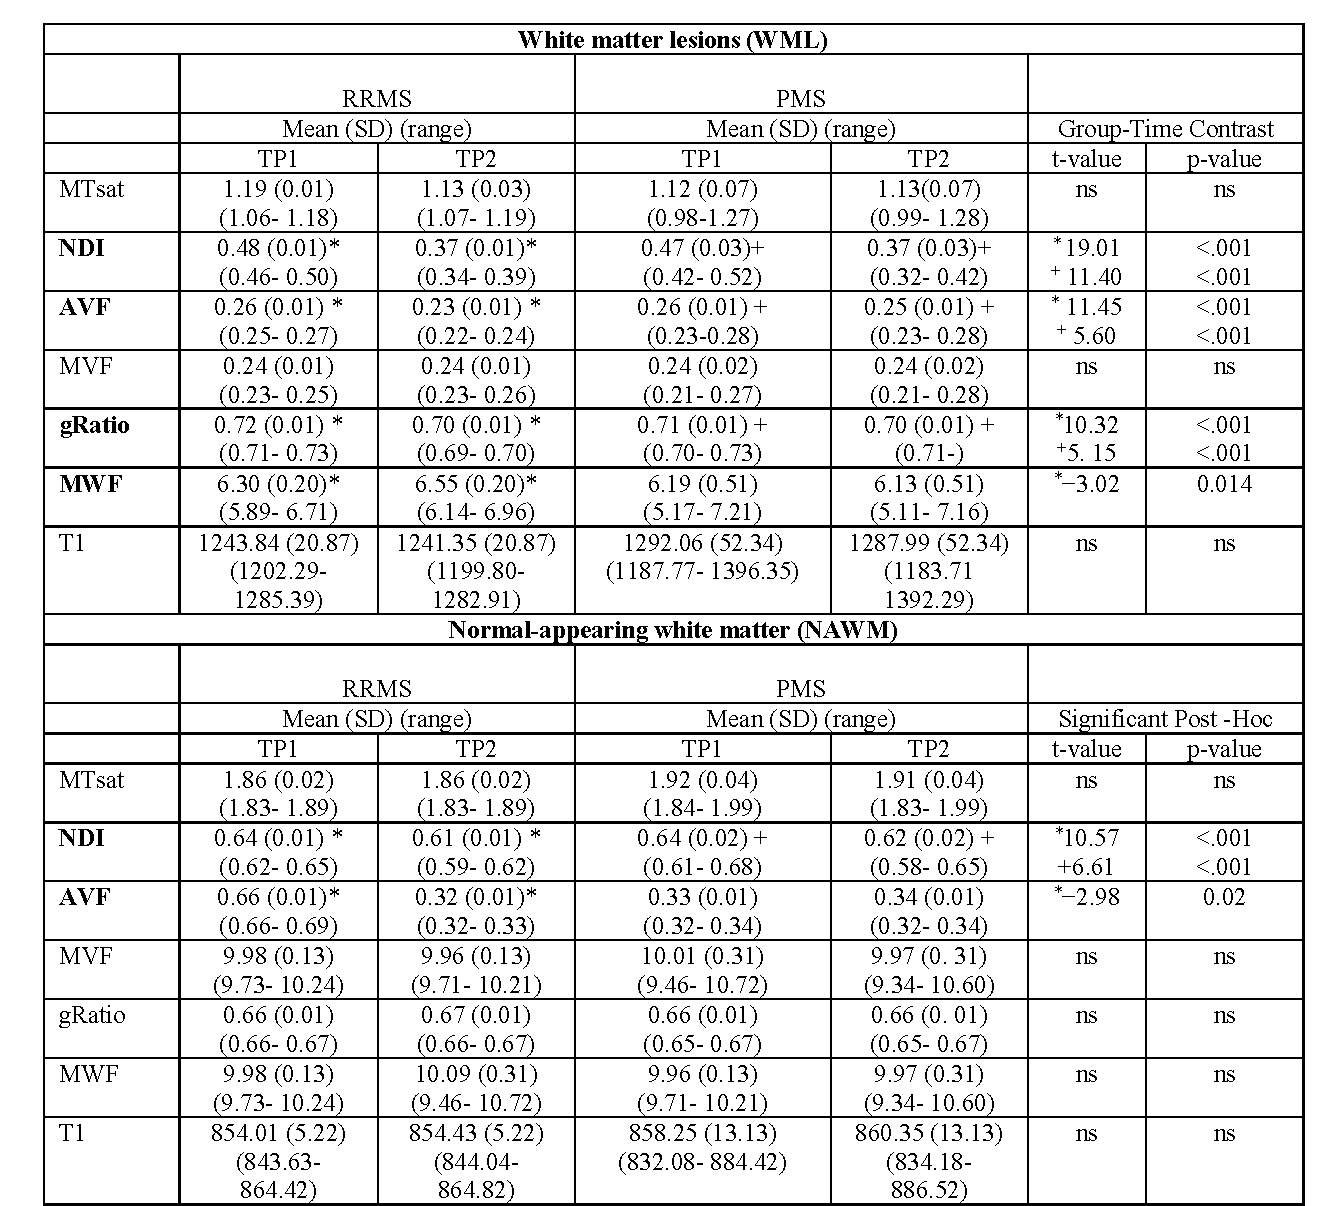
Table 2. Linear mixed modeling results for MTsat, NDI, AVF, MVF, gRatio, MWF and T1 for TP1 and TP2 in WML and NAWM for RRMS and PMS patients. Values represent Estimated Marginal Means (Lower-Upper 95% CI). Abbreviations: MTsat: magnetization transfer saturation; NDI: Neurite Density Index; AVF: Axon Volume Fraction; MVF: Myelin volume fraction; gRatio: g-ratio; MWF: Myelin volume fraction; T1: T1- relaxation-time; SD: standard deviation; TP1: baseline; TP2: follow-up. *Excludes cerebellum for metrics. In bold measures with significant contrasts. * RRMS TP1 vs T2; + PMS TP1 vs TP2.
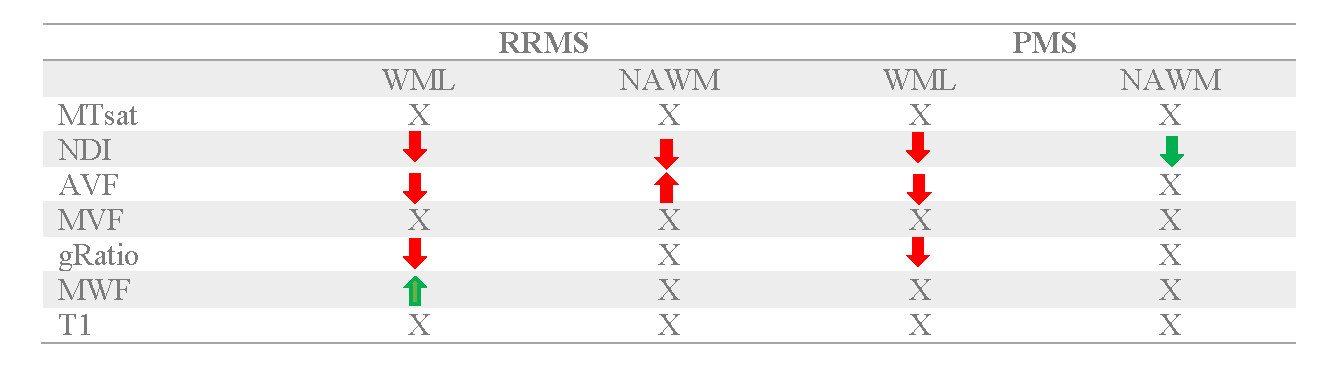
Table 3. Summary of findings for all microstructural measures in WML and NAWM in RRMS and PMS groups. MTsat: magnetization transfer saturation; NDI: Neurite Density Index; AVF: Axon Volume Fraction; MVF: Myelin volume fraction; gRatio: g-ratio; MWF: Myelin volume fraction, WML: White matter lesion; NAWM: Normal-appearing white matter.