5283
Differences in vascularity between recurrent glioblastoma and brain metastasis using dynamic contrast enhanced MRI
Sapir Fajerzstein1,2,3, Moran Artzi1,3,4, Deborah T. Blumenthal4,5, Dror Limon4,6, Orna Aizenstein7, Felix Bokestein4,5, Netanell Avisdris1, and Dafna Ben, Bashat1,3,4
1Sagol Brain Institute, Tel Aviv Sourasky Medical Center (TASMC), Tel Aviv, Israel, 2The Iby and Aladar Fleischman Faculty of Engineering TAU, Tel Aviv, Israel, 3Sagol School of Neuroscience, Tel Aviv University, Tel Aviv, Israel, 4Sackler Faculty of Medicine, Tel Aviv University (TAU), Tel Aviv, Israel, 5Division of Oncology, TASMC, Tel Aviv, Israel, 6Neuro-Oncology Service, TASMC, Tel Aviv, Israel, 7Division of Radiology, TASMC, Tel Aviv, Israel
1Sagol Brain Institute, Tel Aviv Sourasky Medical Center (TASMC), Tel Aviv, Israel, 2The Iby and Aladar Fleischman Faculty of Engineering TAU, Tel Aviv, Israel, 3Sagol School of Neuroscience, Tel Aviv University, Tel Aviv, Israel, 4Sackler Faculty of Medicine, Tel Aviv University (TAU), Tel Aviv, Israel, 5Division of Oncology, TASMC, Tel Aviv, Israel, 6Neuro-Oncology Service, TASMC, Tel Aviv, Israel, 7Division of Radiology, TASMC, Tel Aviv, Israel
Synopsis
Keywords: Tumors, DSC & DCE Perfusion
High grade glioma (HGG) and brain-metastasis are known to have different vascularity. Dynamic contrast-enhanced (DCE) was suggested to assess disease progression, and to differentiate between tumor recurrence and radiation necrosis. However, previous methods did not relate to the differences in vascularity of the two tumor types and often offer the same method and same threshold values. We show differences between groups with: higher vascularity, slightly increased permeability, higher percent of arteries overlapping of the tumor, and differences in several radiomics features, in recurrent HGG compared with recurrent brain-metastasis. Future studies should relate to these differences between the two tumor types.Introduction
Differentiation between recurrent tumors and treatment related changes (TRC) is highly important due to differing medical treatment strategies for each diagnosis. MRI is the standard of care for brain tumor diagnosis and follow-up monitoring. However, differentiation between recurrence and TRC is highly challenging due to their similar appearance on conventional MRI. A few methods have been suggested to differentiate between these conditions based on vascularity, however, most of these methods did not relate to the specific type of the tumor. High grade glioma (HGG) and brain metastasis (MET) are known to have different vascularity, thus different methods or threshold values should be used when differentiating between recurrent tumor and TRC, in each tumor type.
The aim of this study was to quantify the differences in vascularity between recurrent HGG and recurrent MET using dynamic contrast enhanced (DCE) MRI.
Methods
Patients and MRI Protocol: A total of 79 patients were included in this study, 45 patients with recurrent HGG and 34 patients with recurrent MET. Scans were performed on a 3.0 Tesla MRI scanner (Siemens MAGNETOM Prisma). The protocol included: high-resolution T1 weighted fast spoiled gradient echo (SPGR) imaging, performed before and after contrast agent injection. The DCE data was acquired using multiphase 3D T1-weighted SPGR imaging before, during and after contrast agent injection with in-plan resolution of 1X1X5 mm3 and temporal resolution of 6 sec. T1 maps were acquired using the variable flip angle method.
Data analysis: Analysis workflow is illustrated in Figure 1, and includes:
DCE analysis: DCE images were registered to the T1-weighted images using (XXX0; the pharmacokinetic parameters were extraction using DUSTER (an in-house code written in MATLAB for DCE Up Sampled Temporal Resolution based on the Extended Tofts Model (ETM)1, which incorporates correction for bolus arrival time (BAT).
The enhanced lesion area was segmented using ITK-SNAP.
Independent component analysis (ICA) was performed on the raw DCE data in order to exclude large blood vessels from the tumor area. The ICA was performed using FSL multivariate exploratory linear decomposition into independent components (MELODIC) tool2.
Radiomics features were extracted from each of the DCE’s parameters maps, within the segmented lesion area (using Pyradiomics, an open-source platform implemented as a Python package3.)
Statistical analysis: Differences between groups were assessed using independent two-sample t-test with Bonferroni correction for multiple comparisons, based on the mean values for each pharmacokinetics parameter and the radiomic features within the segmented lesion area.
In order to choose the features that contribute the most to differentiation between these two tumor types and remove highly correlated features, an Extreme Gradient Boosting (XGB) model was used (ref), with 5 models tested and averaged. This model provides importance scores that indicate how useful was each feature in the construction of the boosted decision trees within the model.
Results
Tumor Vascularity: Mean values of the 3 pharmacokinetics parameters were measured for each group within the enhanced lesion area and are presented in table 1. Higher vascularity and slightly increased permeability were observed in the HGG group compared with MET group.
ICA Results: Four components were identified for all patients displaying different concentration time curves: arteries, veins, choroid plexus, and the permeable component, consisting of the enhanced lesion area,. Figure 2 presents representative results from two subjects: one from the HGG group and one from MET group. Differences in tumor vascularity can be observed for the arteries component. Around 30% of the subjects within the HGG group showed similar results, with the arteries component overlapping the lesion component . This finding was not detected in the metastasis group.
Feature Selection: A total of 59 features were found to be statistically significant after multiple testing correction (α=0.0005): 15 features relating to Vp; 14 features relating to BAT; 15 features relating to Ktrans; and 15 features relating to Kep. The features can be divided into 5 groups: 3D shape features, first order features, gray level co-occurrence matrix features, gray level size zone matrix features and gray level dependance matrix features. Most of these features related to different measures of entropy in the given ROI, which emphasized the differences in heterogeneity between these two tumor types.
Discussion & Conclusion
This study demonstrated significant differences in vascularity, permeability and heterogeneity between recurrent HGG and MET, that should be considered when developing automatic classification methods for clinical use. The results demonstrate the potential use of DCE with radiomics analysis to improve classification between tumor types and between recurrent tumors and TRC.
Acknowledgements
No acknowledgement found.References
1. Liberman, G., Louzoun, Y., Artzi, M., Nadav, G., Ewing, J. R., & ben Bashat, D. (2016). DUSTER: Dynamic contrast enhance up-sampled temporal resolution analysis method. Magnetic Resonance Imaging, 34(4), 442–450. https://doi.org/10.1016/J.MRI.2015.12.014 2. Park, Y. W., Choi, D., Park, J. E., Ahn, S. S., Kim, H., Chang, J. H., Kim, S. H., Kim, H. S., & Lee, S. K. (2021). Differentiation of recurrent glioblastoma from radiation necrosis using diffusion radiomics with machine learning model development and external validation. Scientific Reports 2021 11:1, 11(1), 1–9. https://doi.org/10.1038/s41598-021-82467-y 3. van Griethuysen, J. J. M., Fedorov, A., Parmar, C., Hosny, A., Aucoin, N., Narayan, V., Beets-Tan, R. G. H., Fillion-Robin, J. C., Pieper, S., & Aerts, H. J. W. L. (2017). Computational radiomics system to decode the radiographic phenotype. Cancer Research, 77(21), e104–e107. https://doi.org/10.1158/0008-5472.CAN-17-0339/SUPPLEMENTARY-VIDEO-S2Figures
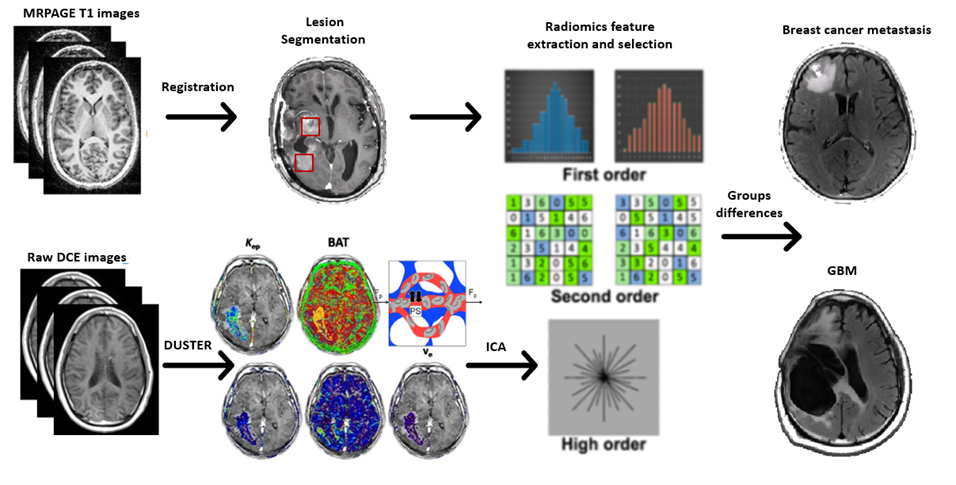
Fig. 1: Illustration of the analysis
pipeline.
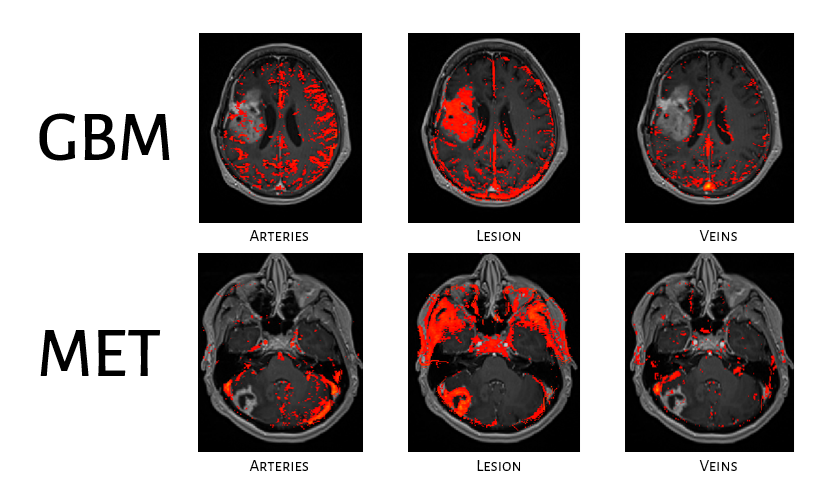
Fig. 2: Representative
segmentation results of the independent component analysis (ICA) on the DCE
data of the 3 major components: arteries, lesion (permeable component) and
veins.
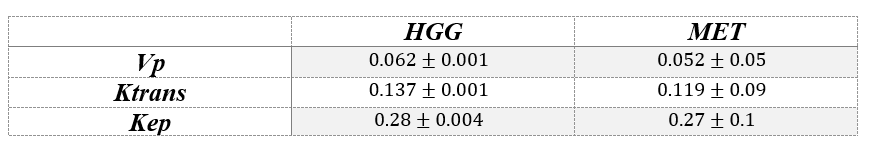
Table 1: Mean and Standard deviation (SD) of the extracted
pharmacokinetics parameters between tumor types.
DOI: https://doi.org/10.58530/2023/5283