5282
Demonstration of Distinct Iron Deposition Patterns in Gliomas using 7T Quantitative Susceptibility Mapping1Radiology, Perelman School of Medicine, Philadelphia, PA, United States, 2University of Pennsylvania, Philadelphia, PA, United States
Synopsis
Keywords: Tumors, Blood vessels, Glioma
Evidence has shown that abnormal iron levels and gliomas are heavily correlated. Due to this, iron presents a possibility to serve as a glioma biomarker. This study will utilize susceptibility-weighted imaging (SWI) to identify the glioma, and quantitative susceptibility mapping (QSM) to explicitly classify iron deposits in the glioma on an ultra-high field (7T) scanner.
A total of 6 untreated glioma patients with high- and low-grade gliomas underwent 7T QSM. Patients with high-grade gliomas showed distinct, geometric iron deposits that low-grade gliomas did not. These results illustrate that 7T QSM may be helpful in classifying low- and high-grade gliomas.
Introduction
Strong evidence indicates that abnormal accumulation of heme (deoxyhemoglobin) and non-heme (ferritin, hemosiderin) iron reflects a multiplicity of pathological and physiological processes in gliomas. Up-regulation of transferrin receptor expression has also been observed on glioma cell surface.1,2 Collectively, these studies suggest that iron has the unique potential to serve as a potential surrogate biomarker for characterizing gliomas. Susceptibility weighted imaging (SWI) is a non-quantitative technique that employs high-resolution, flow-compensated three-dimensional gradient recalled echo (GRE) sequence derived phase images to enhance small susceptibility variations present between different tissue compartments on the corresponding magnitude images.3 On SWI, susceptibility-based signals within tumor beds are visible as low signal intensity with fine linear or dot-like structures with or without conglomeration. It is believed that susceptibility variations within brain tumors are related to different forms of iron in blood products caused by extensive vascular proliferation, microhemorrhages, or small vessels.4-6 However, these tumor-related susceptibility variations may be also caused by calcifications secondary to presence of oligodendroglial components.7 Quantitative susceptibility mapping (QSM) offers a highly sensitive tool for iron detection and quantification by deconvolving the phase images. 8,9 While paramagnetic (e.g., iron) and diamagnetic materials (e.g., calcium) present low signal intensity on SWI, these susceptibility sources can be well-differentiated on corresponding QSM with paramagnetic materials presenting high signal and diamagnetic materials presenting low signal intensities. The purpose of this study is to demonstrate the presence of distinct geometric patterns of iron deposition in high and low-grade gliomas using ultra high-field (7T) QSM.Methods
A total of 6 treatment naïve glioma patients (mean age=42.5±12.7years, M/F=2/4) were recruited. Based upon histopathological analyses, three patients had high-grade glioma (grade-4 astrocytoma) and two patients had low-grade glioma [(grade-2 astrocytoma (n=1) and grade-2 oligodendroglioma (n=1)]. One patient was diagnosed with a low-grade glioma by neuroimaging findings. All patients underwent MR imaging on a 7T scanner prior to surgical resection. The imaging protocol included conventional T1-weighted MPRAGE and T2-FLAIR sequences. Additionally, high-resolution, flow compensated 3D-susceptibility weighted imaging (3D-SWI) was acquired (in-plane resolution=0.5x0.5mm2, slice thickness=2mm). Susceptibility weighted imaging and mapping (SWIM) algorithm developed by Haacke’s group10 was used to reconstruct QSM maps from 3D-SWI data. Gliomas were classified as “iron-laden” if they demonstrated hypointensity on SWI and hyperintensity on QSM. Gliomas were classified as “non-iron-laden” if they were iso-intense/hyperintense on SWI and isointense on QSM.Results
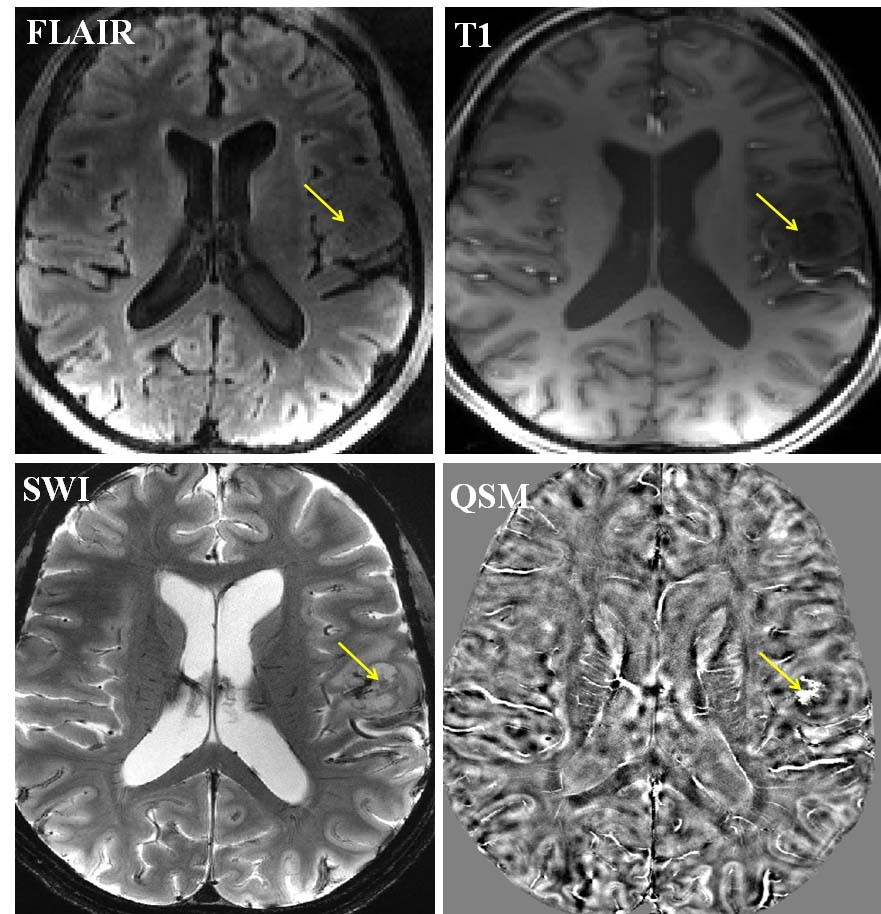
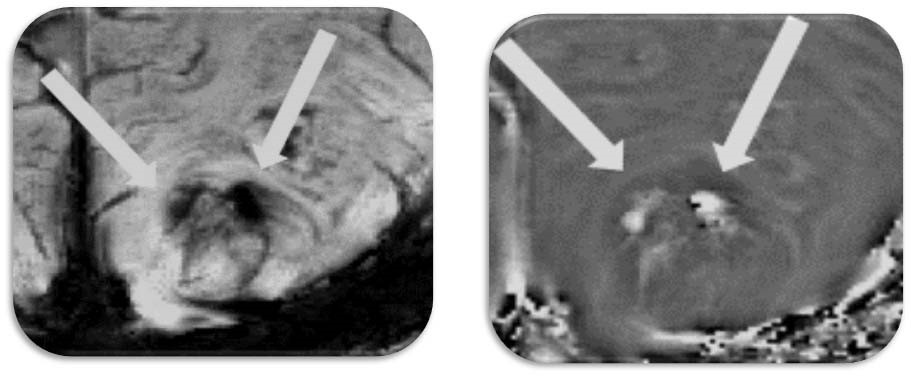
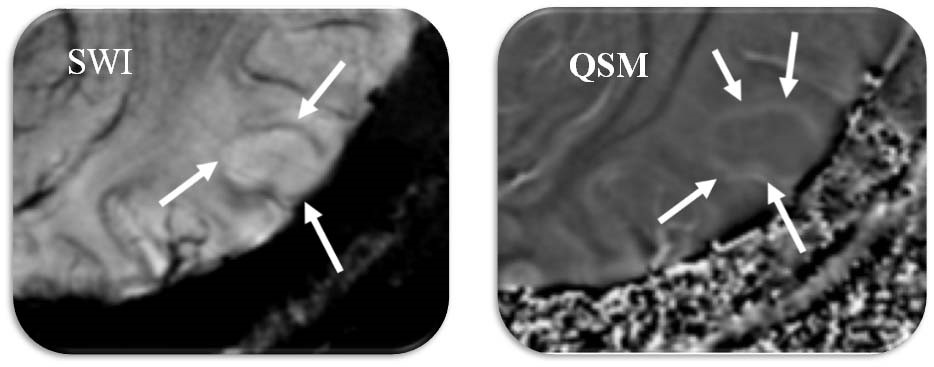
Anatomical images, SWI and QSM from a representative case of glioma are shown in figure 1. Three morphologically distinct patterns were observed. All three high-grade gliomas were iron-laden and showed hyperintense signal intensity on QSM in the form of nodular areas of susceptibility (Figure 2). The mean QSM values from these nodules were 42±15ppb. On the other hand, two low-grade gliomas had no evidence of iron deposition. However, one low-grade glioma exhibited a hyperintense peripheral rim on the QSM with a corresponding value of 26.85ppb (Figure 3).Discussion
In this pilot study, we report the potential of ultra-high field (7T) QSM in detecting different signal intensity patterns related to iron and non-iron pathologies in gliomas. 7T imaging by virtue of increased signal to noise ratio and spatial resolution increases the conspicuity of the intratumoral susceptibility signals. By combining information both from magnitude and phase images, SWI enhances the conspicuity of small susceptibility variations present between different tissue components. On SWI, rim like pattern in gliomas has been demonstrated in a mouse model after the injection of iron-oxide based contrast agents.11 In comparison to SWI, QSM is a more sensitive tool for iron detection and quantification by deconvolving the phase images.8.9 The clinical utility of 7T QSM has not been reported in gliomas previously. While we observed iron accumulation in the form of nodules (single or multiple nodules) in high-grade gliomas in the present study, low-grade gliomas were either non-iron laden or had the iron deposition only along the edges of lesions indicating relatively well-circumscribed margins.Conclusion
7T QSM may be helpful in distinguishing low from high-grade gliomas. However, correlative imaging and histochemical analyses from a larger patient population are required to confirm these findings.Acknowledgements
This work was supported by Research Grants obtained from University Research Foundation (URF, PI: Sanjeev Chawla, PhD, DABMP) and Penn Center for Precision Medicine (PCPM, PI: Suyash Mohan, MD, PDCC), Perelman School of Medicine at the University of Pennsylvania, Philadelphia, USA.References
1. Verbovšek U, Motaln H, Rotter A, et al. Correction: Expression Analysis of All Protease Genes Reveals Cathepsin K to Be Overexpressed in Glioblastoma. PLOS ONE 2015;10:e0142116.
2. Huang X. Iron overload and its association with cancer risk in humans: evidence for iron as a carcinogenic metal. Mutat Res. 2003 Dec 10;533(1-2):153-71.
3. Haacke EM, Mittal S, Wu Z, et al. Susceptibility-weighted imaging: technical aspects and clinical applications, part 1. AJNR Am J Neuroradiol 2009;30:19–30.
4. Li C, Ai B, Li Y, Qi H, Wu L (2010) Susceptibility-weighted imaging in grading brain astrocytomas. Eur J Radiol 75: e81–85.
5. Sehgal V, Delproposto Z, Haddar D, Haacke EM, Sloan AE, et al. (2006) Susceptibility-weighted imaging to visualize blood products and improve tumor contrast in the study of brain masses. J Magn Reson Imaging 24: 41–51.
6. Radbruch A, Wiestler B, Kramp L, Lutz K, Baumer P, et al. (2012) Differentiation of glioblastoma and primary CNS lymphomas using susceptibility weighted imaging. Eur J Radiol 2012 Dec 10
7. He J, Mokhtari K, Sanson M, Marie Y, Kujas M, et al. (2001) Glioblastomas with an oligodendroglial component: a pathological and molecular study. J Neuropathol Exp Neurol 60: 863–871.
8. Reichenbach JR, Schweser F, Serres B, Deistung A. Quantitative Susceptibility Mapping: Concepts and Applications. Clin Neuroradiol. 2015 Oct;25 Suppl 2:225-30.
9. Chawla S, Kister I, Wuerfel J, et al. Iron and Non-Iron-Related Characteristics of Multiple Sclerosis and Neuromyelitis Optica Lesions at 7T MRI. AJNR Am J Neuroradiol 2016;37:1223–30.
10. Haacke EM, Tang J, Neelavalli J, et al.. Susceptibility mapping as a means to visualize veins and quantify oxygen saturation. J Magn Reson Imaging 2010;32:663–76.
11. Blasiak B, Landry J, Tyson R, Sharp J, Iqbal U, Abulrob A, Rushforth D, Matyas J, Ponjevic D, Sutherland GR, Wolfsberger S, Tomanek B. Molecular susceptibility weighted imaging of the glioma rim in a mouse model. J Neurosci Methods. 2014 Apr 15;226:132-138.
Figures