5269
Super-Resolution Magnetic Resonance Fingerprinting1Radiology, Stanford University, Stanford, CA, United States
Synopsis
Keywords: Hybrid & Novel Systems Technology, Data Processing, super-resolution, high resolution, Fingerprinting
We introduce a novel approach, Super-Resolution Magnetic Resonance Fingerprinting (SR-MRF), which is a combination of an optical super-resolution microscopy method, Super-resolution Optical Fluctuation Imaging (SOFI) and MR-Fingerprinting. Our preliminary results in simulated MRF data demonstrate both 2-fold resolution improvement, as demonstrated by point spread function (PSF) analysis, and tissue-type segmentation. This technique represents an original crossover between the fields of MR-imaging and super-resolution microscopy, and lays the groundwork for other such techniques to follow.Purpose
Magnetic Resonance Imaging (MRI) is a powerful and versatile imaging technique, yet it is intrinsically limited by a fundamental tradeoff between image resolution and acquisition time. This is particularly impactful in clinical practice, where long imaging times can be a significant hurdle. Several techniques have been proposed to improve MR-resolution in post-processing, however they typically fall into the categories of machine learning and k-space deconvolution. While these methods hold tremendous promise, to our knowledge there are no methods that utilize any of the established optical super-resolution microscopy techniques that have emerged over the past decade. These optical methods were designed to overcome Abbe’s diffraction limit, which is the fundamental limitation that light cannot be used to resolve an object smaller than its wavelength. This principle was circumvented by the advent if various techniques that work by shifting analysis into the temporal, rather than spatial domain. As these techniques effective narrow the point spread function (PSF) of signal in an image, they could, in principle, also be applied to improve resolution in imaging modalities beyond microscopy.One such technique, Super-resolution Optical Fluctuation Imaging (SOFI) is unique in that it achieves sub-diffraction limit resolution without the need for special optics, labelling, or laser excitation1-3. SOFI is a post-processing method that employs pixel-wise cumulant analysis of temporal image stacks to achieve substantial PSF narrowing. The only demand of SOFI analysis is that the signal time trace must exhibit random optical blinking. That is, the emitter must be oscillating between at least two distinct visible states, such as on and off, over time as captured in the image stack.MR Fingerprinting (MRF) achieves quantitative analysis of tissue-specific parameters by using a deliberately varying pseudo-random pulse sequence to create unique tissue-specific “fingerprints” that can be compared with pre-computed dictionary values and used for qualitative analysis of several tissue parameters4,5. The pseudo-random pulse sequence incidentally generates an image stack with a blinking signal that can be deconvolved and configured for compatibility with SOFI super-resolution analysis. The combination of MRF and SOFI into a single modality provides both quantitative tissue-type analysis and substantial resolution improvement.Method
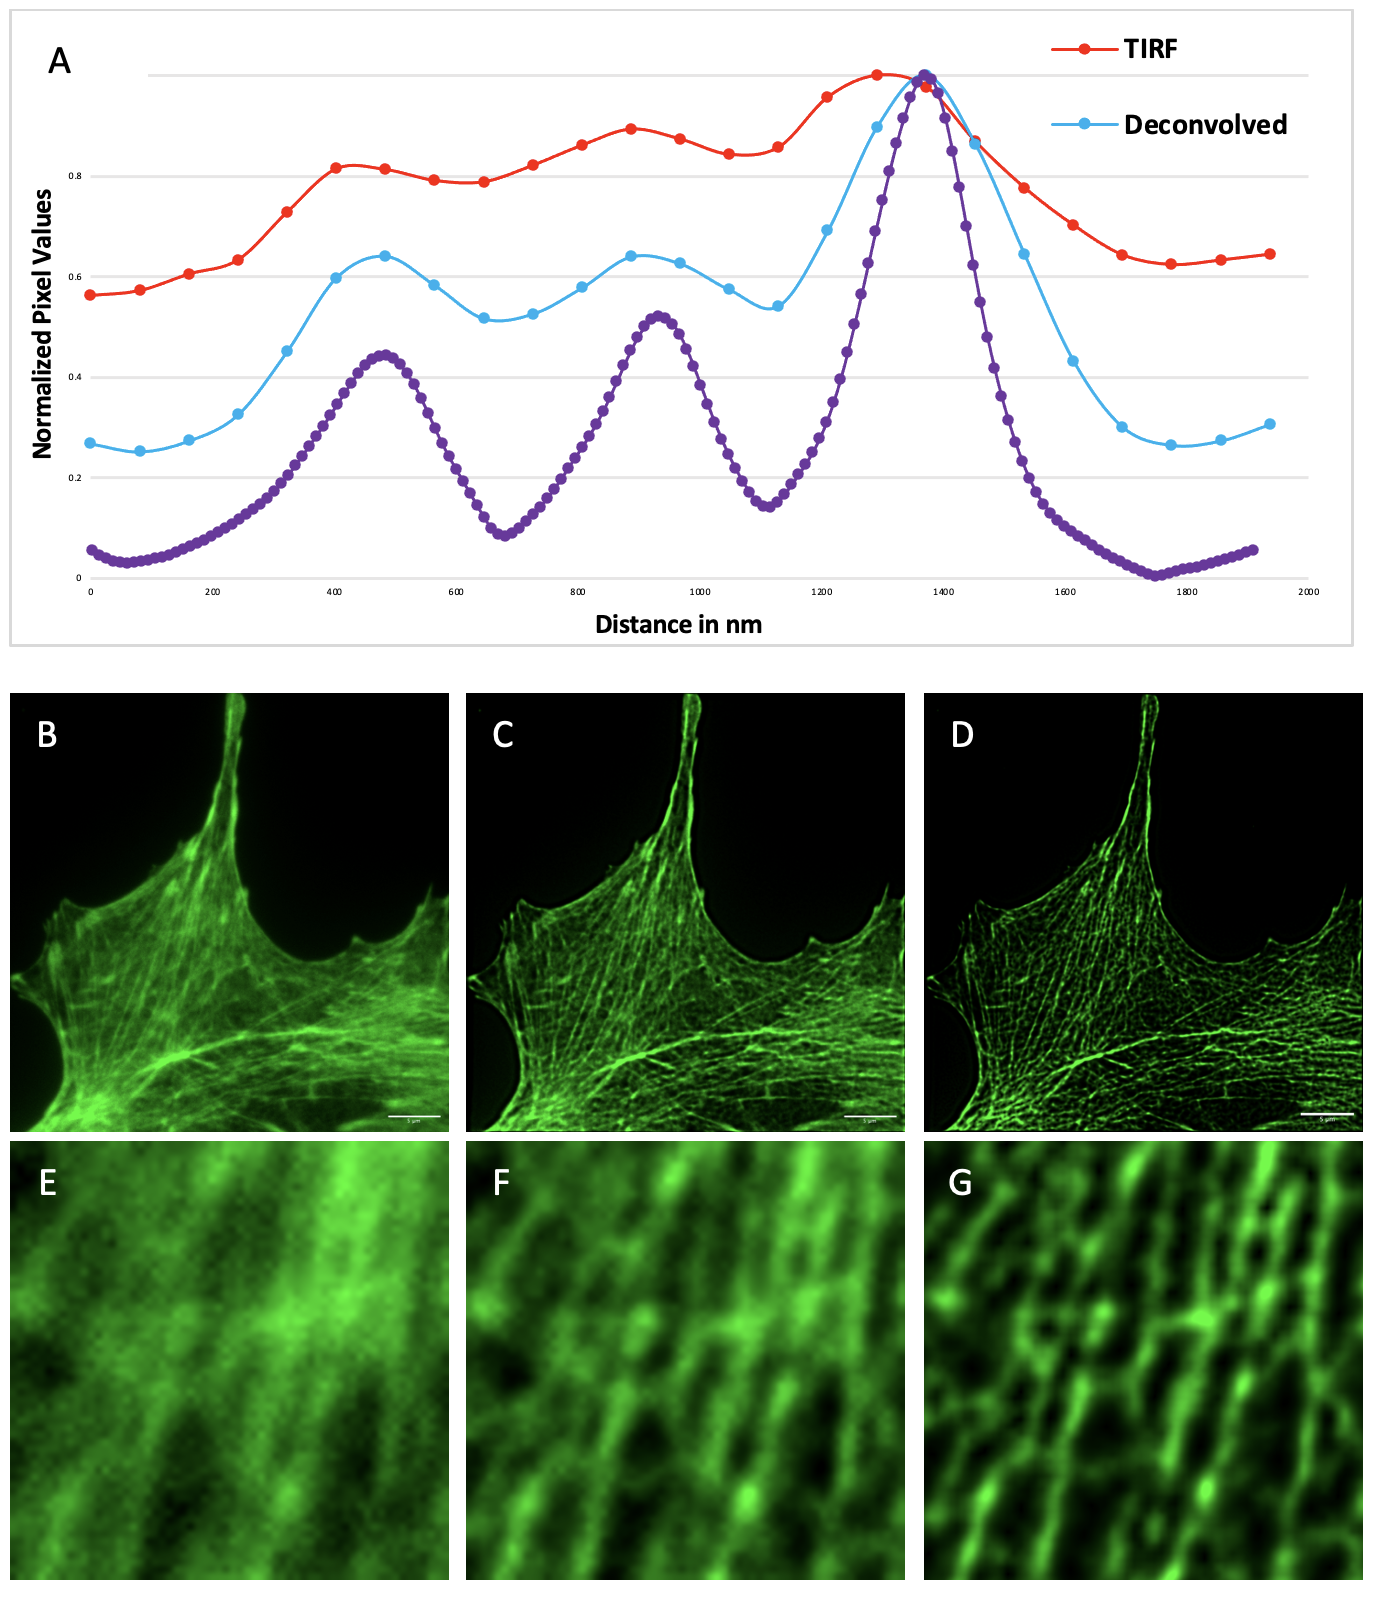
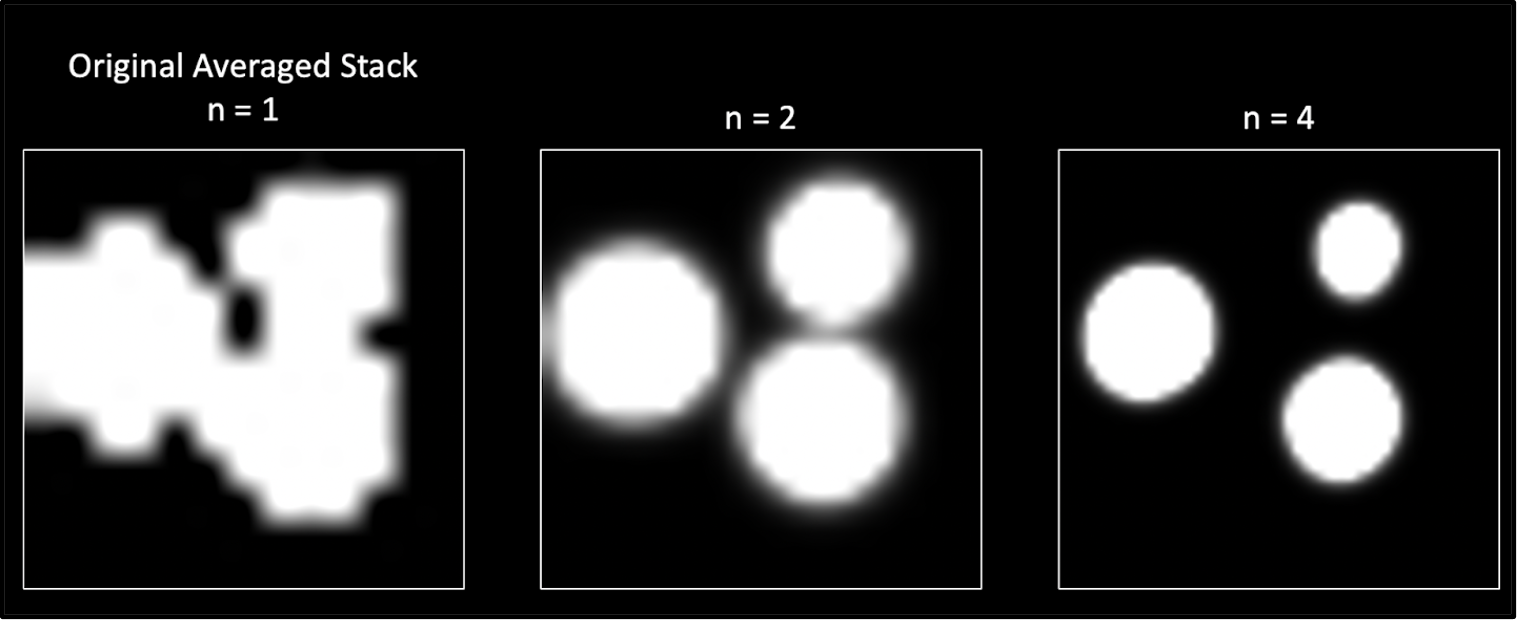
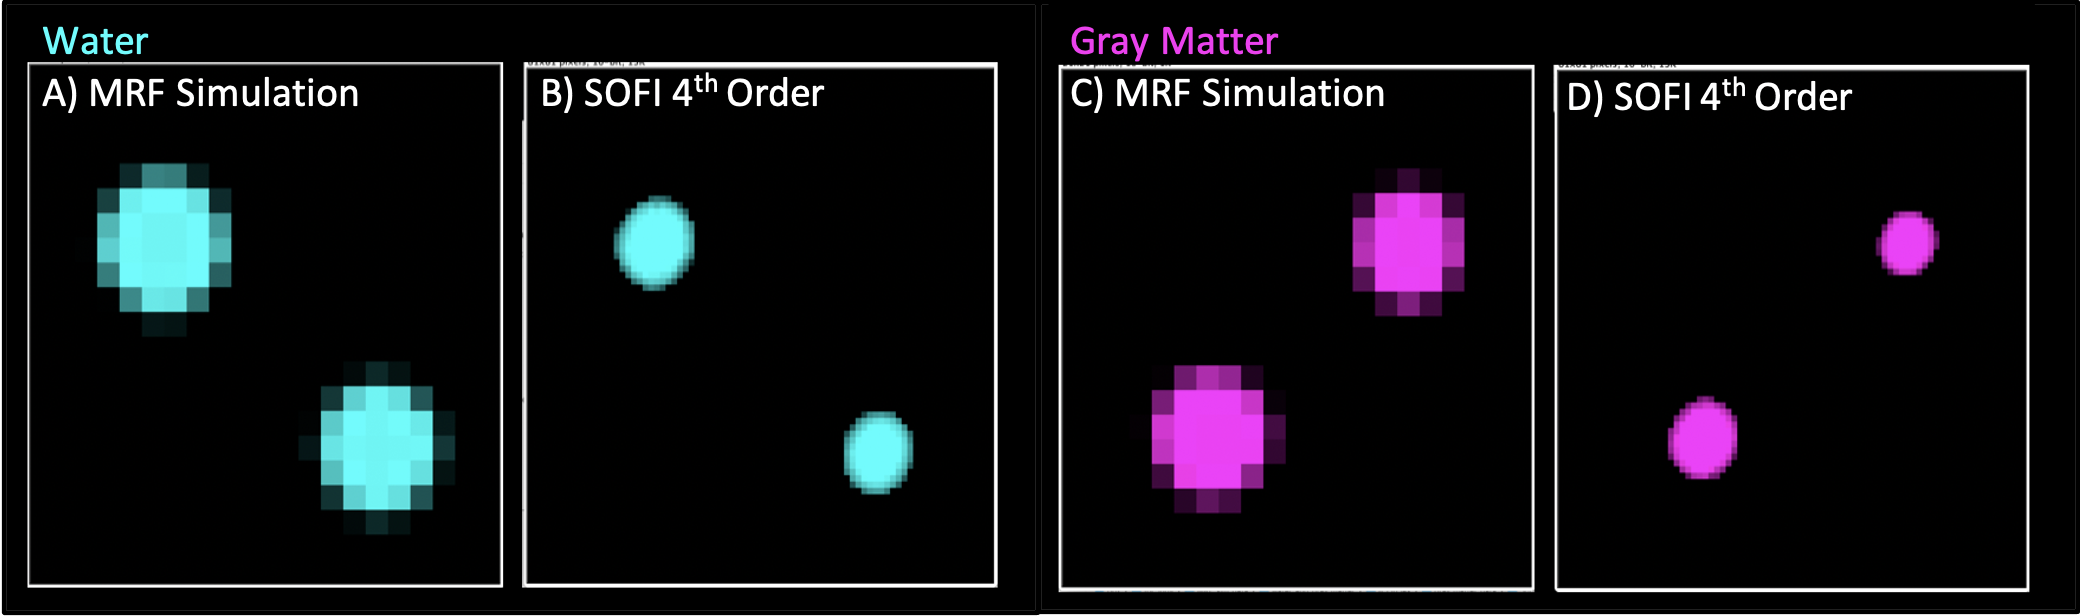
The first step was to demonstrate the ability of SOFI to produce resolution improvement in a typical microscopy platform as a simple proof of concept. This was done by acquiring microscopy data of a pre-made sample, then processing the data with our customized SOFI software package. To this end, TIRF microscopy was used to acquire a 5,000-frame stack of actin filaments immunolabelled with Alexa Fluor 488. Deconvolution was then performed, followed by 7th order SOFI super-resolution analysis. The resulting data is shown in Figure 1.The next step was to demonstrate the ability to apply our customized SOFI super-resolution package to MRF image data with a simple simulated data set. Simulated MRF imaging data was generated of a phantom of three water circles of varying sizes. The original data set was a 16x16x1000 frame set of complex single variables acquired with an MRF sequence. The simulated data was then processed with our customized SOFI platform, demonstrating compatibility between the two platforms. The resulting 4th order SR-MRF image is a 49x49pixel image with 2x resolution improvement, shown in Figure 2.While this was a meaningful initial demonstration of SR-MRF, it was further necessary to demonstrate the applicability of the SR-MRF method to improve image resolution across tissue types. This was done by generating simulated MRF data of a phantom of water and gray matter circles. The customized SOFI super-resolution software package was used to segment the water and gray matter by tissue type, immediately followed by super-resolution analysis of the two tissue types separately. These results are shown in Figure 3.Finally, it was necessary to demonstrate the applicability of SR-MRF to imaging of complex structures, particularly with a variety of tissue type contributions to each pixel time-trace. This was done by generating simulated MRF brain image data with a spiral MRF acquisition sequence that was visibly under-sampled. It was necessary to make the MRF brain data compatible with our SOFI super-resolution package, so an algorithm was created to deconvolve the MRF-brain image set. To do this, an appropriate image-space PSF needed to be generated. The acquisition of a single dot of water, smaller in size than a single MRF voxel, was therefore simulated using a spiral MRF acquisition sequence. A customized Lucy-Richardson deconvolution software pipeline was then created for the deconvolution step. This was followed by 2nd order SOFI super-resolution analysis. The resulting images and quantitative resolution improvement analysis are shown in Figure 4.Results
Demonstration of the use of SOFI super-resolution microscopy to TIRF image data is shown in Figure 1. Application of the SOFI software package to simulated MRF data of three water circles is shown in Figure 2. Application of SOFI to simulated MRF data of water and gray matter circles is shown in Figure 3. Finally, a demonstration of deconvolution followed by SOFI analysis of simulated MRF brain data, with a line analysis quantifying resolution improvement, is shown in Figure 4.Acknowledgements
Support from GE Healthcare, NIH EB002524 and NIH K24AR062068References
1. T. Dertinger, R. Colyer, G. Iyer, S. Weiss, and J. Enderlein. Fast, background-free, 3D super-resolution optical fluctuation imaging (SOFI). PNAS Vol 106 Issue 52 (2009). https://doi.org/10.1073/pnas.0907866106
2. Dertinger, T. et al. (2012). Superresolution Optical Fluctuation Imaging (SOFI). Nano-Biotechnology for Biomedical and Diagnostic Research. Advances in Experimental Medicine and Biology, vol 733. Springer, Dordrecht. https://doi.org/10.1007/978-94-007-2555-3_2
3. Dertinger, T., Heilemann, M., Vogel, R., Sauer, M. and Weiss, S. (2010), Superresolution Optical Fluctuation Imaging with Organic Dyes. Angew. Chem. Int. Ed., 49: 9441-9443. https://doi.org/10.1002/anie.201004138
4. Ma, D., Gulani, V., Seiberlich, N. et al. Magnetic resonance fingerprinting. Nature 495, 187–192 (2013). https://doi.org/10.1038/nature11971
5. Panda A, Mehta BB, Coppo S, Jiang Y, Ma D, Seiberlich N, Griswold MA, Gulani V. Magnetic Resonance Fingerprinting-An Overview. Curr Opin Biomed Eng. 2017 Sep;3:56-66. doi: 10.1016/j.cobme.2017.11.001. PMID: 29868647; PMCID: PMC5984038.
6. Schick, F. Whole-body MRI at high field: technical limits and clinical potential. Eur Radiol 15, 946–959 (2005). https://doi.org/10.1007/s00330-005-2678-0
Figures