5268
Radiomics analysis of apparent diffusion coefficient maps of parotid gland to diagnose morphologically normal Sjogren’s syndrome
Chen Chu1, Jie Meng1, Huayong Zhang2, Qianqian Feng1, Weibo Chen3, Jian He1, Lingyun Sun2, and Zhengyang Zhou1
1Department of Radiology, Nanjing Drum Tower Hospital, The Affiliated Hospital of Nanjing University Medical School, Nanjing, China, 2Department of Rheumatology, Nanjing Drum Tower Hospital, The Affiliated Hospital of Nanjing University Medical School, Nanjing, China, 3Philips Healthcare, Shanghai, China, Shanghai, China
1Department of Radiology, Nanjing Drum Tower Hospital, The Affiliated Hospital of Nanjing University Medical School, Nanjing, China, 2Department of Rheumatology, Nanjing Drum Tower Hospital, The Affiliated Hospital of Nanjing University Medical School, Nanjing, China, 3Philips Healthcare, Shanghai, China, Shanghai, China
Synopsis
Keywords: Radiomics, Diffusion/other diffusion imaging techniques
The study explored more promising radiomics extracted from apparent diffusion coefficient maps for diagnosing Sjogren’s syndrome (SS) without head&neck MR morphology changes. A total of 119 consecutive SS participants and 95 healthy volunteers were prospectively analyzed by 3.0 T MR including diffusion weighted imaging. Forty-five radiomic parameters were selected and twenty-two radiomic parameters showed significant difference between SS and controls, in which 11 parameters had an area under the ROC curve (AUC) greater than 0.700. The SVM classification model differentiated SS from healthy controls with an AUC of 0.932 and 0.911 in the training and testing sets, respectively.Introduction
Sjogren’s
Syndrome (SS) is a chronic systemic autoimmune disease that is characterized by
direct injury of the exocrine glands1, 2. So, early and accurate
diagnosis of SS is vital for treatment planning3,4. Early diagnosis of SS patients
without the accrual of MRI morphological changes has become a hot research point
in the investigation of many functional MRIs as early diagnosis of SS allows
early intervention, avoiding treatment delay5-7. In the diagnosis of SS, diffusion-weighted
imaging (DWI) has been proved to have high diagnostic value5, 8, 9. According to the previous
studies, only the mean apparent diffusion coefficient (ADC) values were
obtained from the region of interest (ROI), but were insufficient for assessing
the changes in the intra-glandular microenvironment and the spatial
heterogeneity of the gland. Radiomics analysis assists in evaluating the
gray-level intensity and the position of pixels within an image, and directly
measures the heterogeneity of ROI10. Radiomics analysis has been widely used
in various types of tumors11-13, and is also used to evaluate
inflammatory lesions, such as multiple sclerosis and Crohn’s disease through texture
features that reflect the heterogeneity14, 15. To the best of our
knowledge, there were no reports till date that applied radiomics analysis
based on ADC maps for diagnosing SS. This study aimed to explore more promising
radiomic features extracted from the ADC maps of patients without any obvious
morphological changes to accomplish early diagnosis of SS.
Methods
A total
of 119 consecutive patients with SS (with 238 parotid glands) and 95 healthy
volunteers (with 190 parotid glands) were enrolled in our study. All
participants were scanned on a 3.0 T scanner (Ingenia, Philips Medical Systems,
Best, the Netherlands) including DWI.. The ROIs were drawn manually on DWI (b=1000 s/mm2) to cover the
largest slice of each parotid gland and then were copied to ADC maps. Feature
selection was performed using R software, version 3.4.4. 45 feature parameters
were selected for further processing of the study. Radiomics features with statistical
significance in univariate analysis (p<
0.05) entered into a multivariate logistic regression analysis. Backward
stepwise selection based on the Akaike information criterion (AIC) was applied using
“MASS” package (ver. 7.3-50). The AIC value and the Hosmer-Lemeshow test were
used as the measure of goodness of fit. After feature selection, the support
vector machine (SVM) model with a radial basis function kernel was performed by
repeated 10-fold cross-validation with 100 trials. The differences in continuous
variables were analyzed by Mann-Whitney U test, and the differences in categorical
variables were analyzed by chi-square test. The diagnostic performance of 45
selected radiomic features or multivariate models was evaluated using the receiver
operating characteristic (ROC) analysis and the area under the ROC curve (AUC).
All statistical analyses were performed with SPSS 22.0 software (SPSS Inc.,
Chicago, IL). A two-tailed p value of
less than 0.05 was considered to be statistically significant.
Results
The mean value of ADC in patients with SS was
significantly higher than that of healthy controls (p=0.001), with an AUC of 0.607. Among the 45 selected radiomic
feature parameters, the value of 15 feature parameters was significantly higher
in SS patient group than those in healthy volunteers group. The value of 7 feature
parameters was significantly lower in the SS patient group than those in the
healthy group. There were 11 parameters with AUC values greater than 0.700. The
SVM classification model differentiates patients with no morphological changes
from healthy volunteers with an AUC of 0.932 in the training set and an AUC of 0.911
in the testing set.
Discussion
We
found that the ADC mean values of patients with SS were significantly higher than
that of healthy volunteers, which might be due to parotid lymphocyte
infiltration, glandular edema and increased capillary permeability, which in
turn causes expanded extracellular space and increased water molecular
diffusion, but still had a relatively low diagnostic value (AUC=0.607). Radiomics
analysis is useful for the detection of different patterns of signal
intensities that are not easily quantifiable by the human eye. We speculated
that texture analysis of ADC maps can be used to reflect the microenvironment
changes and the heterogeneity inside the parotid gland in SS patients without morphological
changes in MR.
Among the 11 positive parameters, 8 parameters belonged
to GLCM classification, which is widely applied in texture description, and the
results from the co-occurrence of matrices are better than those of the other
texture discrimination methods16,17. There are two feature
parameters that belonged to the Shape classification, which can distinguish the
SS patients and healthy volunteers well (AUCs were 0.709 and 0.878,
respectively). We speculated that the microenvironment and heterogeneity of the
parotid gland have been changed in patients with early-stage SS and who were
negative by conventional MRI.Our study included larger sample size for SS
imaging studies and obtained 45 independent and significant feature parameters through
ICC and ACC. Therefore, a diagnostic model with wide clinical application value
was constructed by SVM.
Conclusion
We
suggest that SVM modeling based on ADC texture analysis can be used for
diagnosing patients with SS who were negative by conventional MRI.
Acknowledgements
No acknowledgement found.References
1. Vitali C, Monti P, Giuggioli C, et al., Parotid sialography and lip biopsy in the evaluation of oral component in Sjogren's syndrome, Clin Exp Rheumatol. 1989;7(2):131-135. 2. Vitali C, Bombardieri S, Jonsson R, et al., Classification criteria for Sjogren's syndrome: a revised version of the European criteria proposed by the American-European Consensus Group, Ann Rheum Dis. 2002;61(6):554-558. 3. Fox RI, Sjogren's syndrome, Lancet. 2005;366(9482):321-331. 4. Shiboski SC, Shiboski CH, Criswell L, et al., American College of Rheumatology classification criteria for Sjogren's syndrome: a data-driven, expert consensus approach in the Sjogren's International Collaborative Clinical Alliance cohort, Arthritis Care Res (Hoboken). 2012;64(4):475-487. 5. Regier M, Ries T, Arndt C, et al., Sjogren's syndrome of the parotid gland: value of diffusion-weighted echo-planar MRI for diagnosis at an early stage based on MR sialography grading in comparison with healthy volunteers, Rofo. 2009; 181(3):242-248. 6. Su GY, Xu XQ, Wang YY, et al., Feasibility study of using intravoxel incoherent motion mri to detect parotid gland abnormalities in early-stage Sjogren syndrome patients, J Magn Reson Imaging. 2016;43(6):1455-1461. 7. Chu C, Zhou N, Zhang H, et al., Use of T1rhoMR imaging in Sjogren's syndrome with normal appearing parotid glands: Initial findings, J Magn Reson Imaging. 2017;45(4):1005-1012. 8. Ding C, Xing X, Guo Q, et al., Diffusion-weighted MRI findings in Sjogren's syndrome: a preliminary study, Acta Radiol. 2016;57(6):691-700. 9. Xu X, Su G, Hu H, et al., Effects of regions of interest methods on apparent coefficient measurement of the parotid gland in early Sjogren's syndrome at 3T MRI, Acta Radiol. 2017;58(1):27-33. 10. Davnall F, Yip CS, Ljungqvist G, et al., Assessment of tumor heterogeneity: an emerging imaging tool for clinical practice?, Insights Imaging. 2012;3(6):573-589. 11. Li H, Zhu Y, Burnside ES, et al., MR Imaging Radiomics Signatures for Predicting the Risk of Breast Cancer Recurrence as Given by Research Versions of MammaPrint, Oncotype DX, and PAM50 Gene Assays, Radiology. 2016;281 (2):382-391. 12. Huang Y, Liu Z, He L, et al., Radiomics Signature: A Potential Biomarker for the Prediction of Disease-Free Survival in Early-Stage (I or II) Non-Small Cell Lung Cancer, Radiology. 2016;281(3):947-957. 13. Ren J, Tian J, Yuan Y, et al., Magnetic resonance imaging based radiomics signature for the preoperative discrimination of stage I-II and III-IV head and neck squamous cell carcinoma. Eur J Radiol. 2018;106:1-6. 14. Zhang Y, Moore GR, Laule C, et al., Pathological correlates of magnetic resonance imaging texture heterogeneity in 5. 15. Makanyanga J, Ganeshan B, Rodriguez-Justo M, et al., MRI texture analysis (MRTA) of T2-weighted images in Crohn's disease may provide information on histological and MRI disease activity in patients undergoing ileal resection. Eur Radiol. 2017;27(2):589-597. 16. Haralick RM, Shanmugam K, Dinstein I, TEXTURAL FEATURES FOR IMAGE CLASSIFICATION, Ieee Transactions on Systems Man And Cybernetics. 1973; SMC3 (6):610-621. 17. Zhang X, Cui J, Wang W, Lin C, A Study for Texture Feature Extraction of High-Resolution Satellite Images Based on a Direction Measure and Gray Level Co-Occurrence Matrix Fusion Algorithm, Sensors (Basel). 2017;17(7).Figures
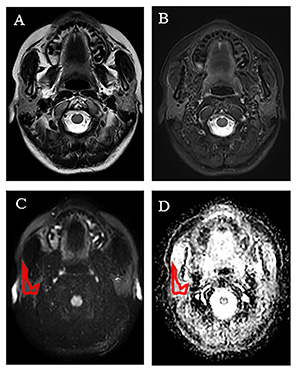
Figure 1: A 30-year-old female Sjogren’s
Syndrome patient. (A) Axial T2-weighted image and (B) Axial fat suppression
T2-weighted showed no obvious changes of the right parotid gland.
(C) Diffusion weighted image (DWI, b =
1000s/mm2) shows the ROI in the red outline covering the largest image slice of
the right parotid gland, which is copied to the (D) the apparent diffusion
coefficient map (ADC map), to generate 838 radiomic feature parameters.
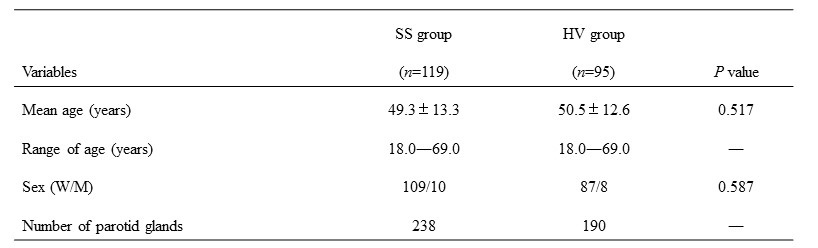
Table 1. Demographic Morphological Data of
SS and HC Group. Note, SS, Sjogren’s Syndrome; HC, healthy controls; W, woman;
M, man.
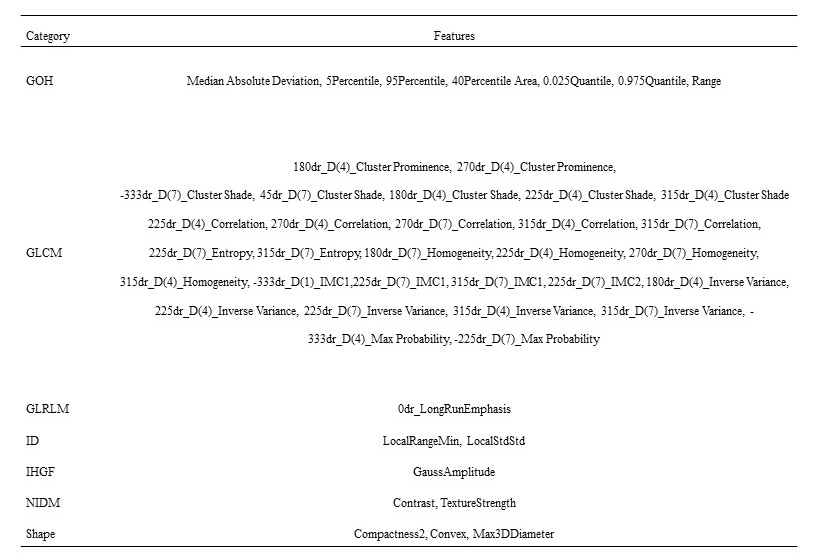
Table 2. The 45 selected features and their categories after absolute correlation coefficient and intra-class correlation coefficient. Note, dr, degree; D, inter-pixel distance.
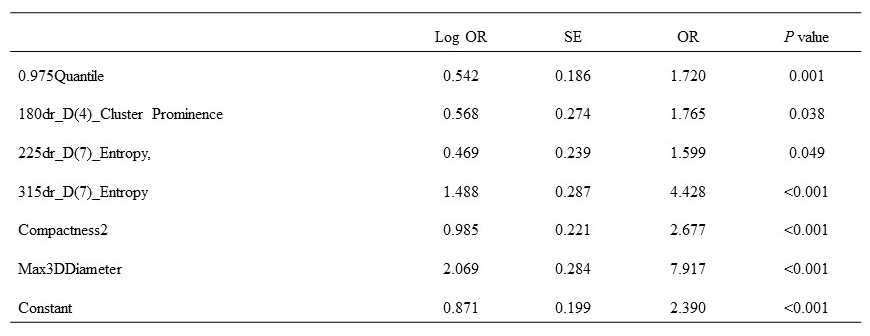
Table 3. The Details of a Combination of
Six Parameters for Distinguishing Sjogren’s Syndrome Patients from Healthy
Controls. Note, Log OR, Logarithm of odds ratio; OR, odds ratio; SE, standard
deviation.
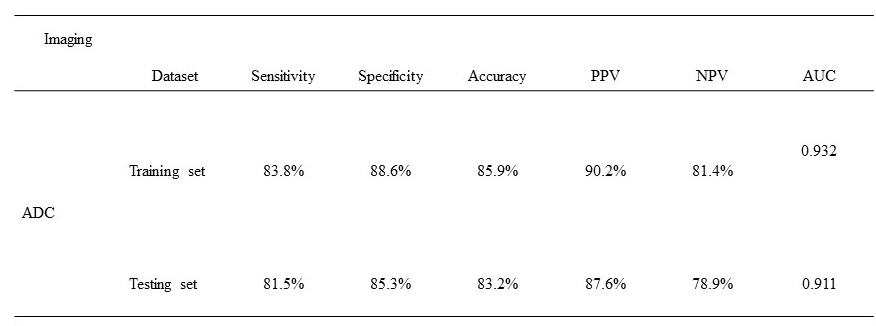
Table 4. The Performance of Support Vector
Machine (SVM) Classification Obtained from 45 Selected Feature Parameters for
distinguishing Sjogren’s Syndrome Patients from Healthy Controls.
Note, PPV=positive predictive value;
NPV=negative predictive value; AUC=area under the curve; ADC=apparent diffusion
coefficient.
DOI: https://doi.org/10.58530/2023/5268