5264
Reliable Glutamate Measurements at 3T: Which Sequence should I Choose?1College of Health and Human Sciences, Purdue University, West Lafayette, IN, United States, 2Department of Psychological Sciences, Purdue University, West Lafayette, IN, United States, 3Purdue Life Sciences MRI Facility, Purdue University, West Lafayette, IN, United States, 4Department of Radiology and Imaging Sciences, Indiana University School of Medicine, Indianapolis, IN, United States
Synopsis
Keywords: Data Acquisition, Brain, Glutamate, MRS
This meta-analysis discusses the intra- and inter-subject variability of glutamate measurements in MRS, comparing widely used sequences on clinical scanners (PRESS, sLASER, MEGA-PRESS, MEGA-sLASER, HERMES). To minimize variance in glutamate measurements, the authors recommend sLASER over PRESS, non-edited over edited MRS, and OFF over DIFF spectra.Introduction
IntroductionAs the main excitatory neurotransmitter, glutamate plays a vital role in many neurological and psychiatric disorders.1 You want to run a clinical MRI study in which the measurement of Glutamate plays a central role? Do you have a standard clinical 3T MRI scanner, possibly equipped with one or more of the widely available Magnetic Resonance Spectroscopy (MRS) research sequences such as sLASER, MEGA-PRESS, MEGA-sLASER and/or HERMES, and you’re wondering which one to use? This educational poster presents a meta-analysis of several studies, comparing inter- and intrasubject variability and sensitivity of eight different possibilities for measuring glutamate (GLU).
Methods
All data was acquired on a 3T Siemens MAGNETOM Prisma scanner, with the standard 64-channel head coil. And a combination of the following sequences: the standard Siemens PRESS, the Siemens WIP MEGA-PRESS, sLASER and MEGA-sLASER2, and HERMES3. All sequences were run using optimized parameters for their respective studies, given below.Study A (Test-Retest)
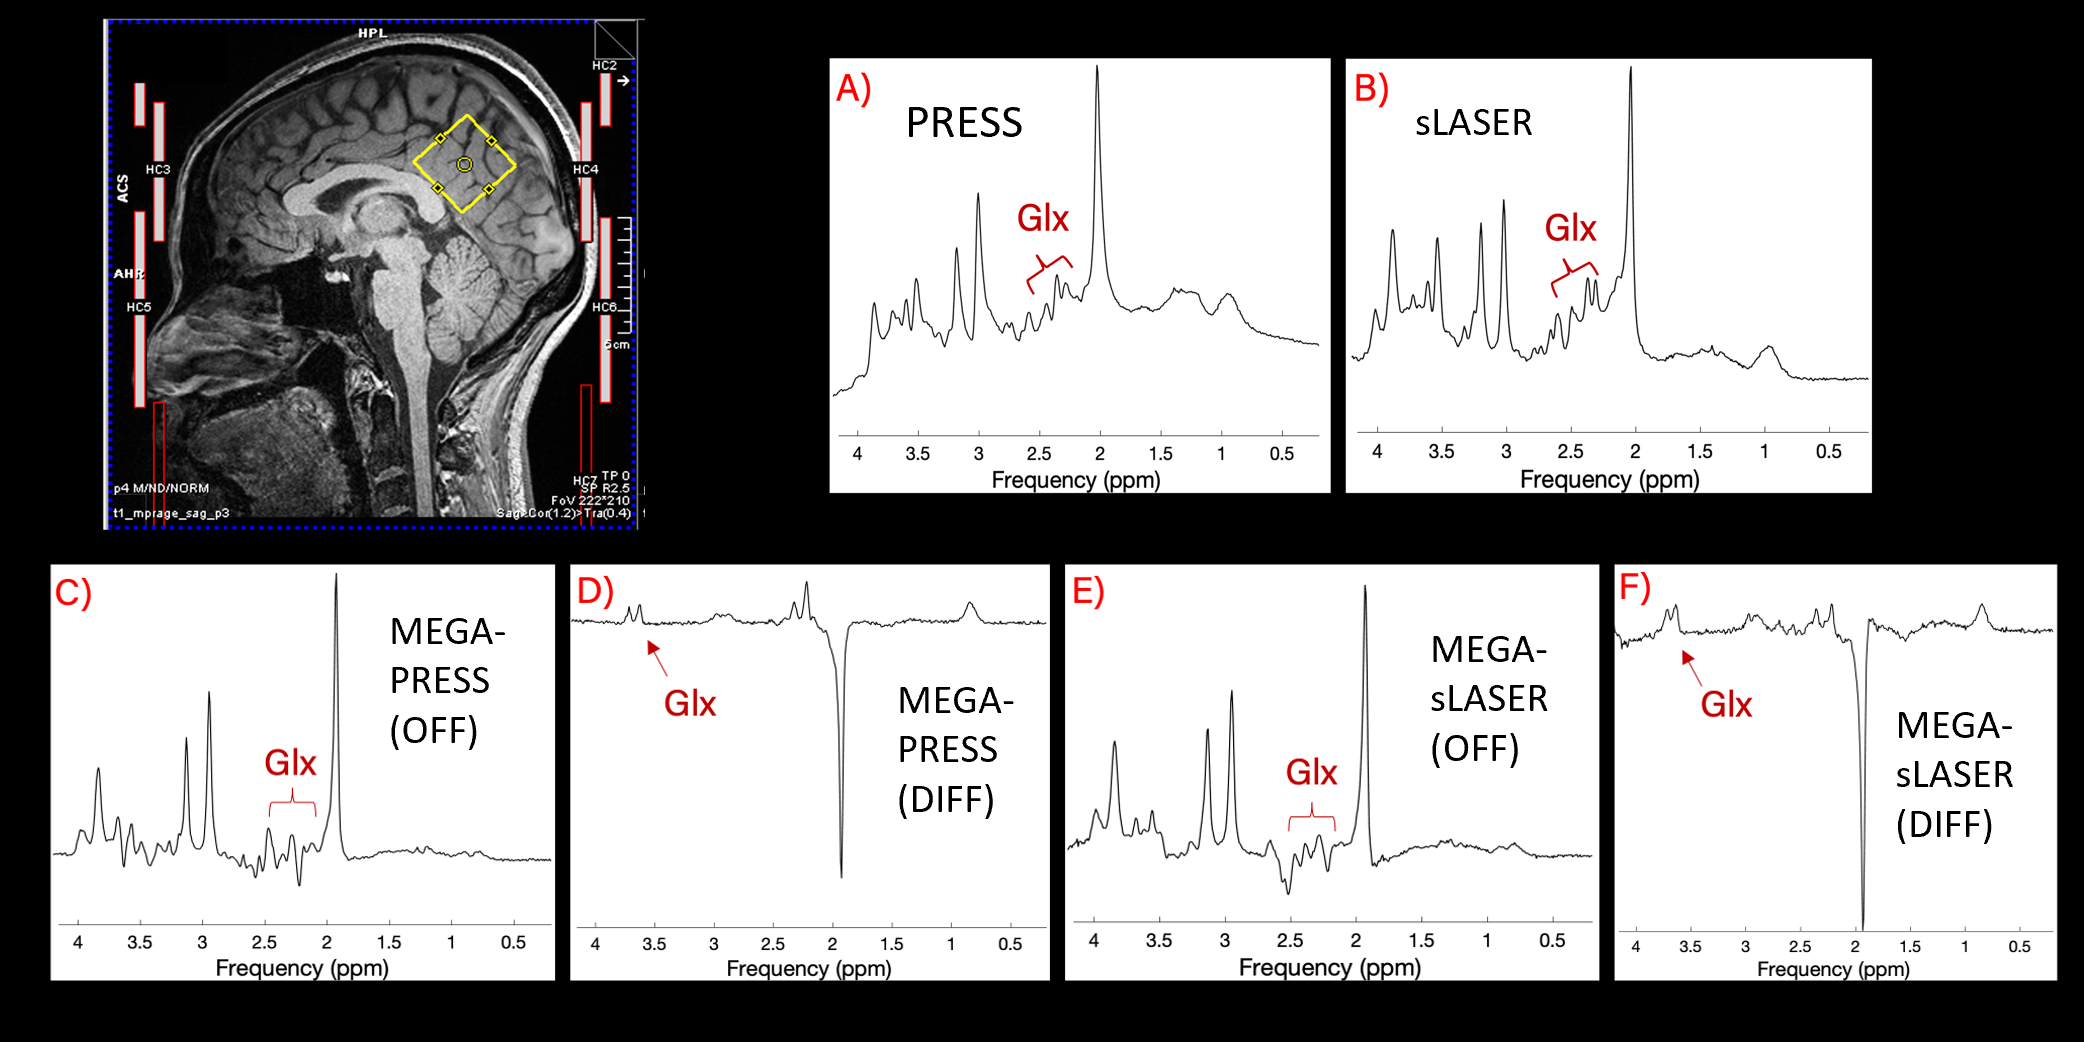
Written informed consent was obtained from 9 healthy subjects (29 ± 2 years; 4 F) to participate in two scan sessions, performed on the same day with repositioning of the subject A 30x30x30 mm3 VOI was placed in the parietal cortex (Fig.1). GLU was quantified from the following MRS sequences: PRESS (TE=35 ms, 64 averages), semi-LASER (TE=35 ms, 64 averages), MEGA-PRESS (TE=68 ms, 160 averages total) and MEGA-sLASER (TE=68 ms, 160 averages total). Both the “off” (unedited) and the “diff” (edited) spectra were used from the MEGA sequences. TR = 2s for all acquisitions.
Study B (Patient-Control Study)
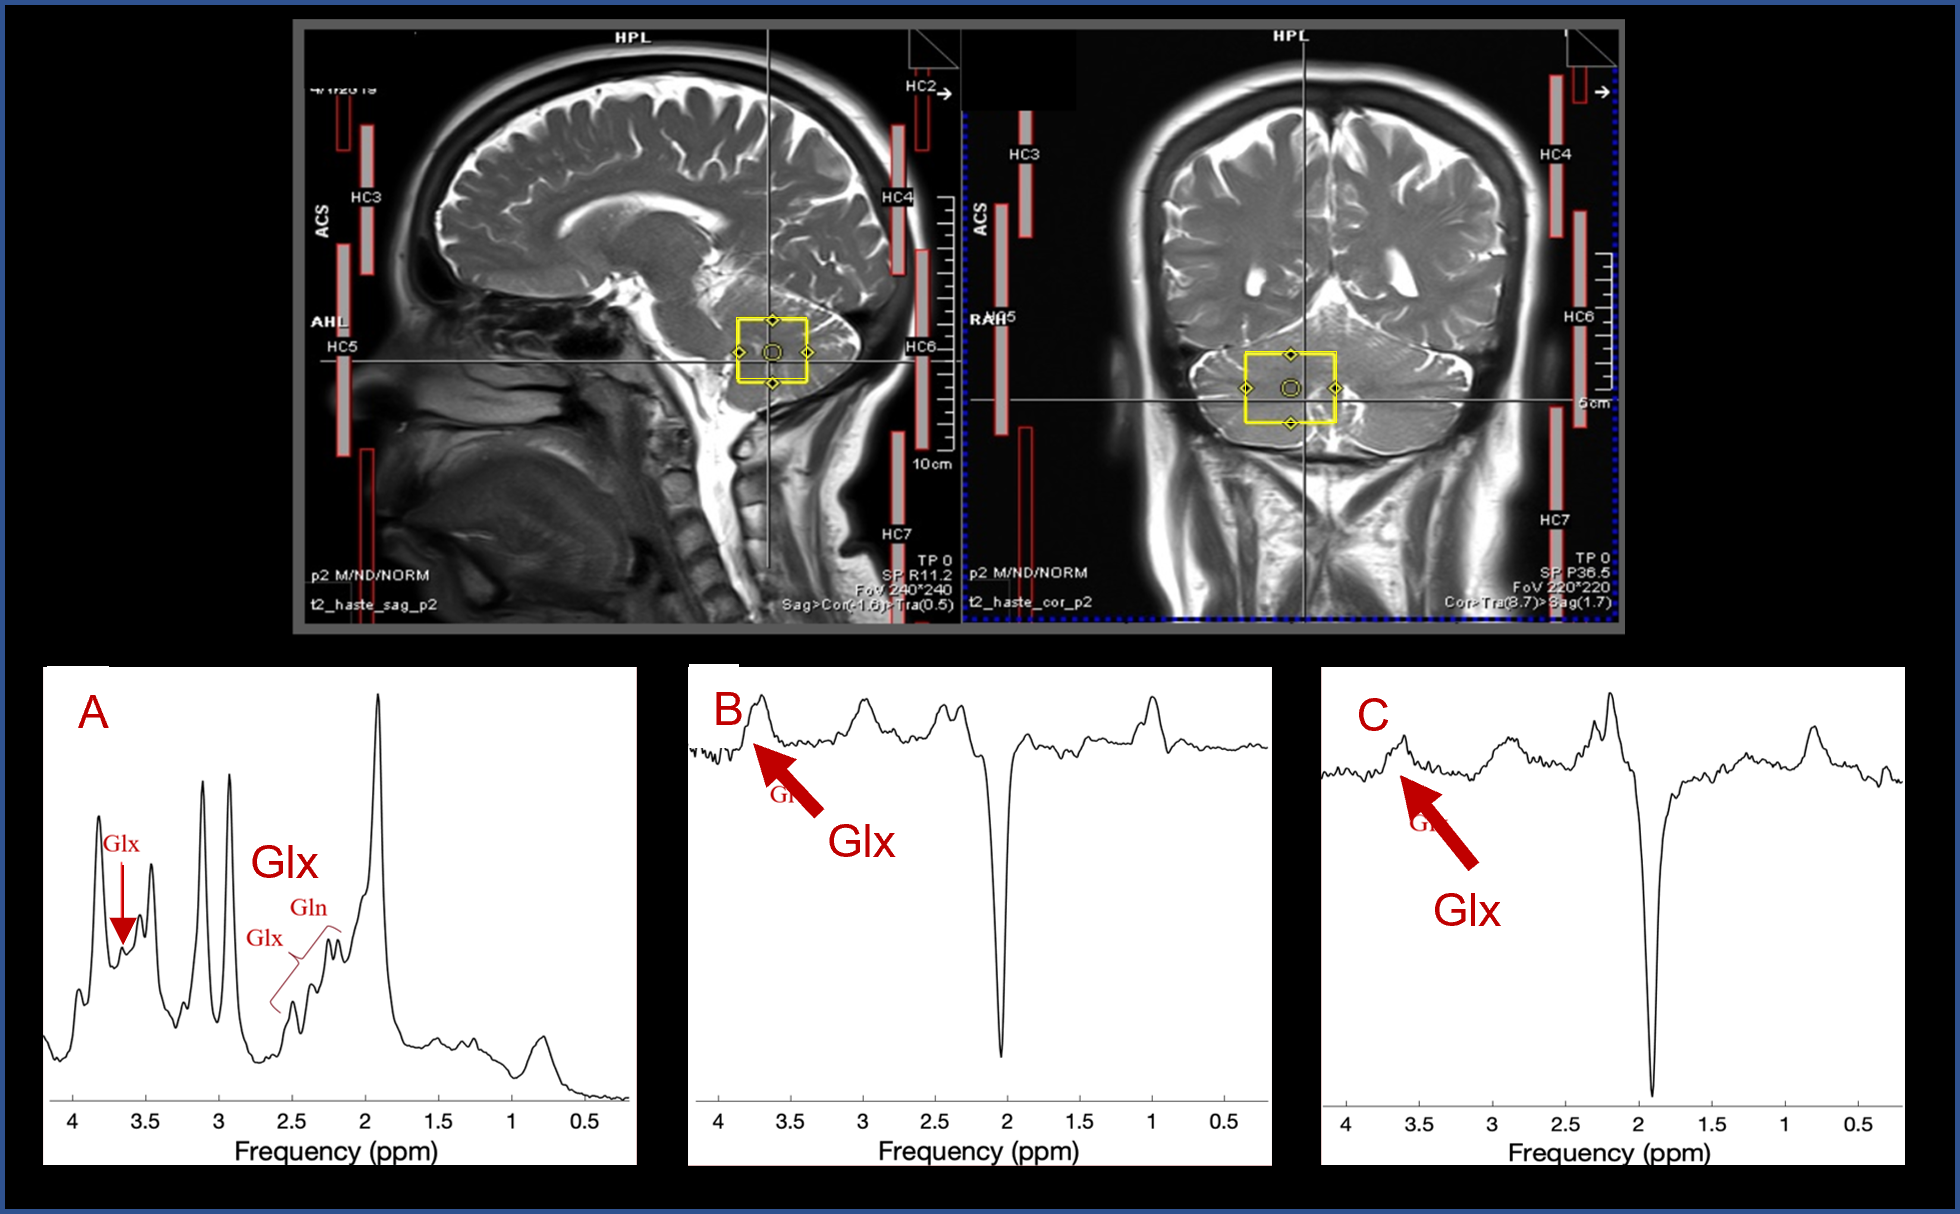
Data was obtained from an MRS study on 15 female carriers of the FMR1 premutation (age 18 - 60) and a control group of 13 females (age 28 - 60) with no personal or family history of fragile X syndrome, autism, or intellectual disability. Glu was assessed from a VOI (25x25x30 mm3) in the cerebellum (Fig.2), using three sequences: s-LASER (TE = 35 ms, 64 averages), MEGA-sLASER (TE = 68 ms, 128 averages), and HERMES (TE = 80 ms, 320 averages). TR was set to 2s for all acquisitions.
Data Analysis, Quantification and Statistical Analysis
All spectra were saved as dicom data and pre-processed in Osprey4. Quantification of Glu (and Glx) was performed using LCModel (version 6.3-1M). The inter-individual coefficient of variance (CV) was calculated as the standard deviation divided by the mean across all subjects, whereas the intra-individual CV was calculated as the mean of the CVs per subject across the test-retest scans. Group differences in Study B were assessed using a two-tailed, unpaired t-test using p<0.05 as significant.
Results
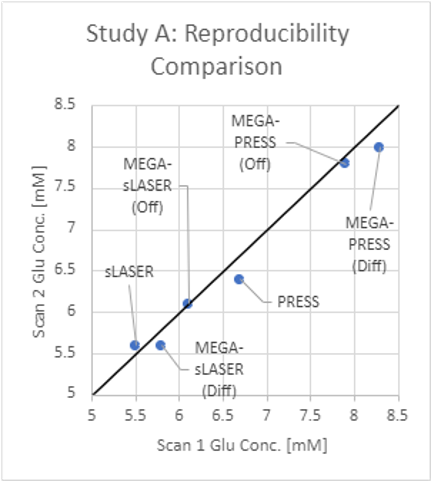
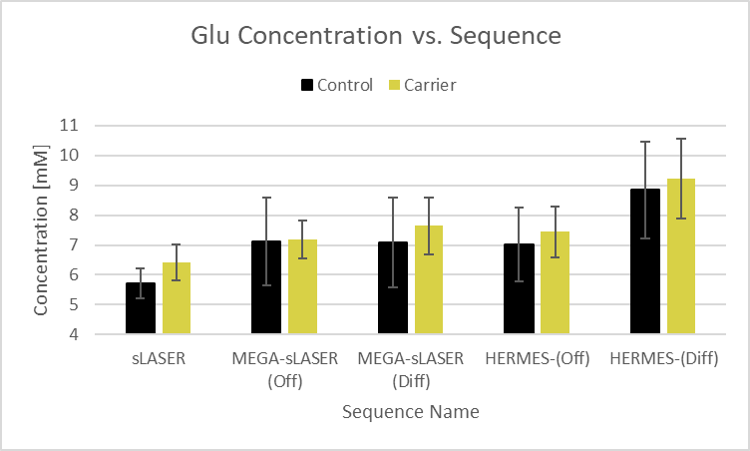
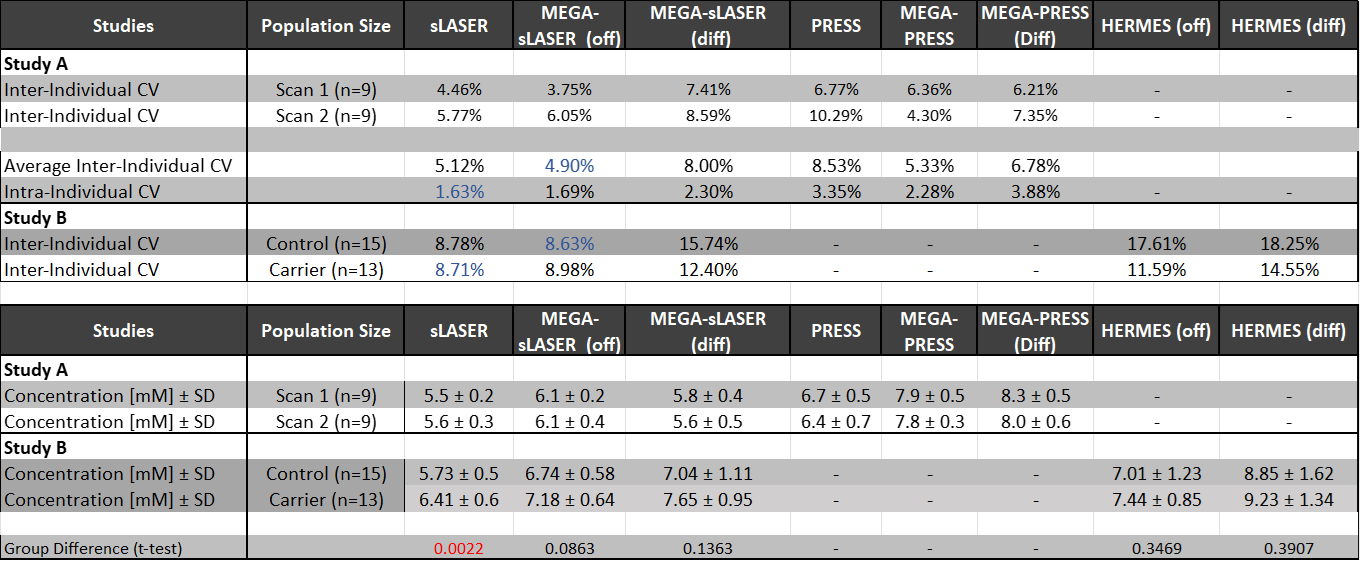
Table 1 summarizes the CVs found for each of the scans and sequences. Reproducibility in Study A was highest for the sLASER sequence (intra-individual CV = 1.63%), closely followed by MEGA-sLASER (intra-individua CV = 1.69%). Inter-individual variance was slightly higher, ranging from 3.76%-10.29%, and was best for the off-spectrum from MEGA-sLASER (4.9%), closely followed by sLASER (5.12%) and MEGA-PRESS (off) (5.33%). Figure 3 shows how these three sequences are nearly on the identity line, and that sLASER produced the smallest concentration estimates and MEGA-PRESS (diff) the highest, ranging from 5.5 – 8.3mM.Within Study B, a clinical study, inter-individual variance was higher in general, ranging from 8.71%-18.25%. Similarly to Study A, PRESS and MEGA-PRESS are outperformed by sLASER and MEGA-sLASER with CVs of 8.78% and 8.63% respectively. The smaller variance of the sLASER sequence also translated to a significant group difference between controls and carriers of the FMR1 premutation (p=0.002), which was missed by all other sequences (Fig.4).
Discussion and Recommendation
Overall, all sequences demonstrated high intra-subject reproducibility of measuring GLU with sLASER and MEGA-sLASER showing the best reproducibility. Inter-individual variance across healthy volunteers, which is often used as baseline measure for power analyses, was smaller in the test-retest study run on young (~30 yrs) adults (3.8 – 10.3%), than in the clinical study on adult females (8.7 – 21%). This could be due to more motion in subjects being scanned in a clinical study than students in a technical study, e.g. due to differences in anxiety or instructions to hold still. Despite that within both studies, sLASER as well as the off-spectra of MEGA-sLASER had very similar low variance (<5.5%), the edited spectra did perform better than the unedited. This latter result is not in line with previous literature, recommending the use of unedited MRS over edited MRS.5,6Our findings further reflect the consensus paper on using sLASER over PRESS7, both for edited (MEGA) or unedited sequences, since sLASER has a more accurate localization, which directly results in a smaller variance since signal from chemical shift displacement will be different for every different placement and angulation of the head. If a study only has time to run an edited MEGA scan (e.g. due to focus on GABA rather than GLU), the off spectra should be used for a more robust quantification of GLU, also in line with previous literature.8
Acknowledgements
This work was supported by an Indiana CTSI Grant.
This work was supported by an Indiana CTSI Core Facility Grant (D.J.F.)
References
1. Foerster, B.R., Nascimento., et al. Excitatory and Inhibitory Brain. 2015 Feb;67(2):576-81
2. Deelchand DK, Berrington A, Noeske R, Joers JM, Arani A, Gillen J, Schär M, Nielsen JF, Peltier S, Seraji-Bozorgzad N, Landheer K, Juchem C, Soher BJ, Noll DC, Kantarci K, Ratai EM, Mareci TH, Barker PB, Öz G. Across-vendor standardization of semi-LASER for single voxel MRS at 3 Tesla. NMR Biomed 2019;doi: 10.1002/nbm.4218.
3 Tesla. NMR Biomed 2019;doi: 10.1002/nbm.4218. 3. Edden RAE, Puts NAJ, Harris AD, Barker PB, Evans CJ. Gannet: A batch-processing tool for the quantitative analysis of gamma-aminobutyric acid-edited MR spectroscopy spectra. J Magn Reson Imaging. 2014;40(6):1445-1452. doi:10.1002/JMRI.24478
4. Oeltzschner G, Zollner HJ, Hui SCN, Mikkelsen M, Saleh MG, Tapper S, Edden RAE. Osprey: Open-Source Processing, Reconstruction & Estimation of Magnetic Resonance Spectroscopy Data. J Neurosci Meth. 2020. 343:108827.
5. Veenendaal, T., Backes, W., et al. Glutamate quantification by PRESS or MEGA- PRESS: Validation, repeatability, and concordance., (2018). https://doi.org/10.1016/j.mri.2017.12.029
6. Cheng, H, Wang, A, Newman, S, Dydak, U. An investigation of glutamate quantification with PRESS and MEGA-PRESS. NMR in Biomedicine. 2021; 34: https://doi.org/10.1002/nbm.4453
7. Wilson et al., Methodological consensus on clinical proton MRS of the brain: Review and recommendations. Magn Reson Med 2019;1-24.
8. Maddock, R., Caton, M., Ragland, J. Estimating glutamate and Glx from GABA- optimized MEGA-PRESS: Off-resonance but not difference spectra values correspond to PRESS values, (2018). https://doi.org/10.1016/j.pscychresns.2018.07.003
Figures