5262
The impact of data normalization and plane view in deep learning for classifying multiple sclerosis subtypes using MRI scans.1Biomedical Engineering, University of Calgary, Calgary, AB, Canada, 2University of Calgary, Calgary, AB, Canada
Synopsis
Keywords: Machine Learning/Artificial Intelligence, Data Processing
Disease activity varies between patients with multiple sclerosis (MS), and patients who have a greater risk of developing a progressive course require more aggressive therapies earlier. However, differentiating disease severity is challenging using conventional methods as the disease often progresses silently. By taking advantage of one of the most advanced quantitative methods, convolutional neural networks, we aim to develop a new deep learning model to differentiate two common MS subtypes: relapsing-remitting course from secondary progressive phenotype. This study focuses on varying image pre-processing techniques and using different data views using conventional brain MRI.Introduction
Multiple Sclerosis (MS) is a common and severe chronic disease of the central nervous system (CNS) affecting 2.8 million people around the world1. Most patients start with relapsing-remitting MS (RRMS) and later progress to secondary progressive MS (SPMS) accompanied by irreversible disabilities2. MS is a highly heterogeneous disease where no two patients experience the same path through their disease progression. This requires therapies to be tailored differently for everyone. Early identification of patients prone to progression can help with receiving an early and more aggressive therapy to improve prognosis3,4.A superior tool for monitoring MS is magnetic resonance imaging (MRI). In clinical practice, T1-weighted, T2- weighted, and FLAIR- MRI are the mainstay for MS diagnosis and management. However, conventional MRI lack specificity to identify precise pathology and are limited in showing concrete MS subtype characteristics when being looked at by clinicians5.
Deep learning models can handle complex inputs and extract robust imaging features without user intervention supporting clinicians’ decision-making. Several studies have explored the use of deep learning in predicting disease development in MS using MRI6,7. However, there is still a lack of a model with systemically tested architecture for classifying RRMS and SPMS subtypes. Specifically, most studies focus on using axial brain MRI, and the impact of other MRI views and different normalizations on MRI data is unclear.
Method
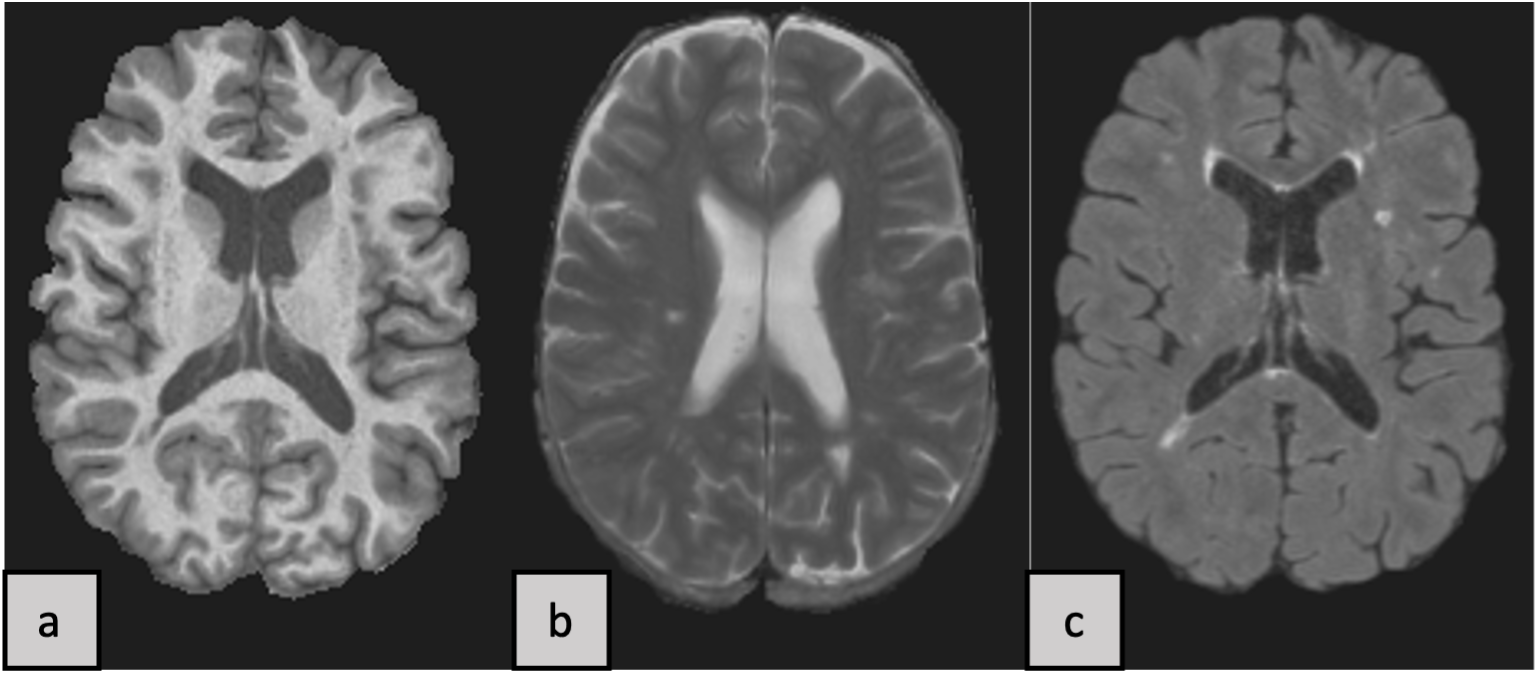
The experimental dataset contains brain MRI scans from 19 MS patients, where 10 patients were in the RRMS class and 9 were in the SPMS class. The MRI protocol includes 3 conventional sequences: T1-weighted, T2-weighted and FLAIR MRI (Fig.1). 16 patients (8 RRMS, 8 SPMS) for training and 3 patients(2 RRMS and 1 SPMS) for validation were randomly selected for each training trial during the whole experiment.The VGG19 convolutional neural network (CNN)8,9 model was trained using a transfer learning approach. We used ‘imagenet’ weights to initialize the model with the input shape of the data being (256, 256, 3). The initial tests were to fine-tune hyperparameters using only axial planes. To evaluate the models’ performance, we used loss, accuracy, AUC, sensitivity, specificity, and F1-score metrics.
The model was tested with different combinations of these 3 common views: axial, coronal, and sagittal. Each combination was called a ‘plane mode’: plane mode #0-#2 contain axial, sagittal, and coronal views, respectively. Plane mode #3 combines axial and sagittal view, #4 combines axial and coronal view, #5 combines sagittal and coronal view, and #6 contains all 3 views. All sample images were shuffled randomly within their respective plane modes and then fed into the model.
We also analyzed the role of different image normalization approaches in the CNN model performance: 1) min-max normalization, 2) z-score normalization, 3) z-score plus min-max normalization.
For the ‘min-max’ method, each slice of each scan patient-wise was normalized to 0-1 using the min-max equation. In ‘z-score’ normalization, for each patient’s sequence scan, mean and std of the brain region were calculated and each scan normalized10 independently.
For ‘z-score plus min-max’, the MRI slices were first normalized using the same method as explained in the (‘z-score normalization’) section and then each slice was min-max normalized separately. We used edge padding11 to pad each normalized slice in all plane views to size (256, 256). In the last step, slices that have very low to no information (black and almost black) were omitted from the training and validation dataset.
Results
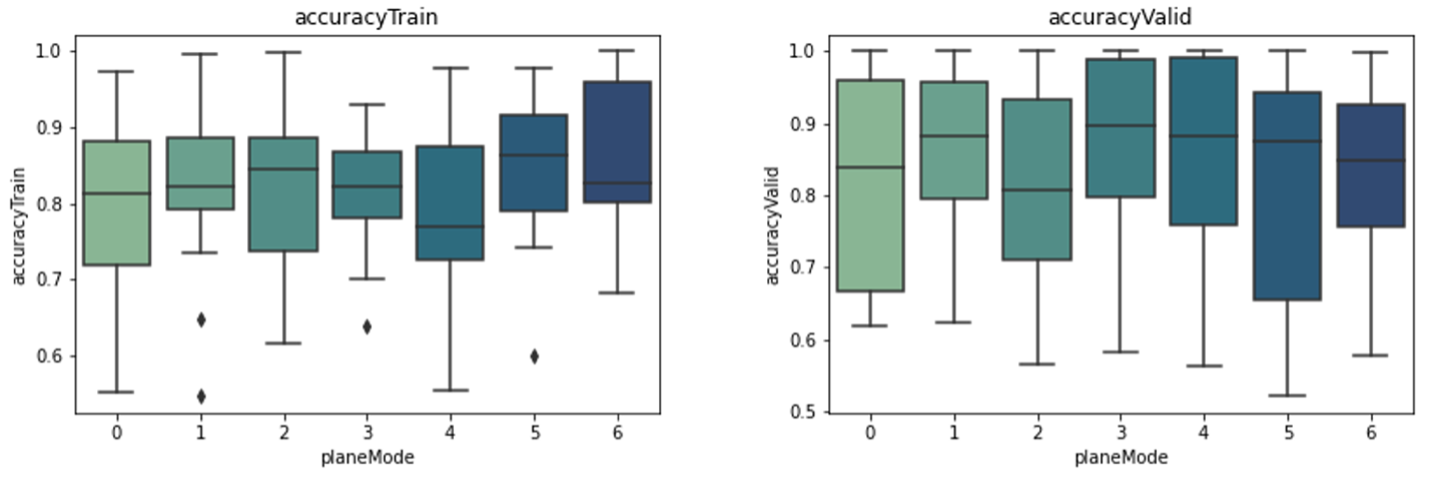
Between all the plane modes, #1, #2 and #5, which used planes (sagittal), (coronal), and (sagittal plus coronal), respectively showed the best results among all normalizations. Among our three tested normalization methods, z-score normalization resulted in the best performance (Fig.2). Comparing the other two methods, they showed close performances, suggesting that min-max normalization can reduce performance when applied to a z-score normalized dataset.Best results with average of 81% accuracy in validation were acquired when using the z-score method to normalize the data from plane mode #5 which uses sagittal and coronal views. Our fine-tuned hyperparameters during the experiments were: batch size=30, dense unit=256, dropout=0.2, learning rate=0.001, and the number of trainable layers=1.
Discussion
Our study uses CNN models to classify RRMS and SPMS subtypes with conventional MRI inputs. Currently, most studies are using the min-max normalization method in their preprocessing and suggest that using min-max plus z-score normalization improves deep learning model performance. In contrast, our study showed the best performance when using only z-score normalization. Most of the studies in this field are using 2D CNN models based on the axial view of MRI scans.Our study is unique by taking advantage of the other views, sagittal and coronal, which are almost always advantageous in improving the CNN model performance. The fact that coronal views have performed slightly better may be due to the greater number of image slices (218) compared to axial and sagittal views (182 per sequence), deserving further confirmation. Moreover, to gain more insight into our classifier’s decision-making process we are aiming to use gradient-weighted class activation mapping (Grad-CAM)12 in the near future.
Conclusion
The use of z-score normalized sagittal and coronal MRI planes leads to the high highest performance in classifying RRMS and SPMS using the VGG19 model.Acknowledgements
I thank my supervisor Dr. Yunyan Zhang and my co-supervisor Dr. Mariana Pinheiro Bento and all the lab members. I also thank the Faculty of Graduate Studies and the Biomedical Engineering Graduate Program of the University of Calgary.References
1. “Atlas-3rd-Edition-Epidemiology-report-EN-updated-30-9-20.pdf.”, <https://www.msif.org/wp-content/uploads/2020/10/Atlas-3rd-Edition-Epidemiology-report-EN-updated-30-9-20.pdf> (12 October 2021 ).
2. Gross, H. J. and Watson, C., “Characteristics, burden of illness, and physical functioning of patients with relapsing-remitting and secondary progressive multiple sclerosis: a cross-sectional US survey,” Neuropsychiatr. Dis. Treat. 13, 1349–1357 (2017).
3. Dobson, R. and Giovannoni, G., “Multiple sclerosis – a review,” Eur. J. Neurol. 26(1), 27–40 (2019).
4. Pandit, L., “No Evidence of Disease Activity (NEDA) in Multiple Sclerosis - Shifting the Goal Posts,” Ann. Indian Acad. Neurol. 22(3), 261–263 (2019).
5. Granziera, C., Wuerfel, J., Barkhof, F., Calabrese, M., De Stefano, N., Enzinger, C., Evangelou, N., Filippi, M., Geurts, J. J. G., Reich, D. S., Rocca, M. A., Ropele, S., Rovira, À., Sati, P., Toosy, A. T., Vrenken, H., Gandini Wheeler-Kingshott, C. A. M. and Kappos, L., “Quantitative magnetic resonance imaging towards clinical application in multiple sclerosis,” Brain 144(5), 1296–1311 (2021).
6. Tousignant, A., Lemaıtre, P., Precup, D., Arnold, D. L. and Arbel, T., “Prediction of Disease Progression in Multiple Sclerosis Patients using Deep Learning Analysis of MRI Data,” 10.
7. Yoo, Y., Tang, L. Y. W., Li, D. K. B., Metz, L., Kolind, S., Traboulsee, A. L. and Tam, R. C., “Deep learning of brain lesion patterns and user-defined clinical and MRI features for predicting conversion to multiple sclerosis from clinically isolated syndrome,” Comput. Methods Biomech. Biomed. Eng. Imaging Vis. 7(3), 250–259 (2019).
8. O’Shea, K. and Nash, R., “An Introduction to Convolutional Neural Networks,” ArXiv151108458 Cs (2015).
9. Simonyan, K. and Zisserman, A., “Very Deep Convolutional Networks for Large-Scale Image Recognition,” ArXiv14091556 Cs (2015).
10. Patro, S. G. K. and sahu, K. K., “Normalization: A Preprocessing Stage,” IARJSET, 20–22 (2015).
11. Harris, C. R., Millman, K. J., van der Walt, S. J., Gommers, R., Virtanen, P., Cournapeau, D., Wieser, E., Taylor, J., Berg, S., Smith, N. J., Kern, R., Picus, M., Hoyer, S., van Kerkwijk, M. H., Brett, M., Haldane, A., del Río, J. F., Wiebe, M., Peterson, P., et al., “Array programming with NumPy,” 7825, Nature 585(7825), 357–362 (2020).
12. Selvaraju, R. R., Cogswell, M., Das, A., Vedantam, R., Parikh, D. and Batra, D., “Grad-CAM: Visual Explanations From Deep Networks via Gradient-Based Localization,” 9.
Figures