5261
The relationship of brain areal activity with the entire brain’s activity
Jie Huang1
1Michigan State University, East Lansing, MI, United States
1Michigan State University, East Lansing, MI, United States
Synopsis
Keywords: Data Analysis, fMRI
The relationship between the activity of brain areas and that of the entire brain remains unknown. The temporal correlation of the BOLD time signal of an area with that of every point in the brain yields a full spatial map that characterizes the entire brain’s functional co-activity (FC) relative to that area’s activity. Analyzing the temporal correlation of the signal time courses of two areas and the spatial correlation of their corresponding two FC maps for all pairwise areas revealed a quantitative relationship between the activity of brain areas and that of the entire brain.Introduction
The complex activity of human brains varies from area to area and from time to time across the whole brain. BOLD-fMRI measures this spatiotemporal activity at large-scale systems level. The BOLD time signal of an area reflects a collective neuronal activity of over million neurons under that area, and the temporal correlation of this time signal with that of every point in the brain yields a full spatial map that characterizes the entire brain’s functional co-activity (FC) relative to that area’s activity. The temporal correlation (TC) coefficient r of the signal time courses of two areas quantifies the degree of co-activity between the two areas, and the spatial correlation (SC) coefficient R of their corresponding two FC maps quantifies the co-activity between these two maps. In this study we found that a modified sigmoid function quantified this R with r, revealing a relationship between the activity of brain areas and that of the entire brain.Methods and Materials
This is a follow-up study of our previous three studies1-3. Nine healthy subjects undertook a 12 min resting-state (rs) fMRI scan and a 12 min task-fMRI scan. Whole brain functional images were acquired on a GE 3.0 T clinical scanner with an 8-channel head coil using a GE-EPI pulse sequence: TE/TR = 28/2500 ms, flip angle 80°, FOV 224 mm, matrix 64×64, slice thickness 3.5 mm, and 38 axial slices to cover the whole brain.We recently conceived the concept of human brain functional areas of unitary pooled activity (FAUPAs) and developed a method to identify FAUPAs with fMRI1. A FAUPA is defined as an area in which the temporal variation of the activity is the same across the entire area, i.e., the neuronal mass activity is a unitary dynamic activity across the entire area. FAUPAs were identified for both rs- and task-fMRI1. In this study, for each identified FAUPA we first computed the TC r of that FAUPA’s signal time course with that of every voxel within the brain to yield a FC map for that FAUPA. Then, we computed the TC r of signal time course between two FAUPAs and the SC R of their corresponding two FC maps. For a given brain state (resting or task), we computed the TC r of pairwise combinations of all FAUPAs with the SC R of pairwise combinations of their corresponding FC maps, resulting in an r-R curve for each brain state of each subject.
Results
For each brain state and each subject, the computed r-R curve showed a shape similar to a stretched S along the horizontal direction (i.e., a sigmoid curve) (Fig. 1). To quantify this r-R curve, we introduced the function:$$R(r)=[(1+r)^a-(1-r)^a]/[(1+r)^a+(1-r)^a], (1)$$
a modified sigmoid function with the range of values from -1 to 1 for both r and R. a is a to be quantified parameter. To quantify the value of a for each brain state of each subject, we defined $$$Q=∑_r[R(r)-R_r]^2$$$, where Rr denotes the SC R for the given r. Q quantifies the total deviation of Rr from R(r) over all r values. Minimizing Q yielded the best fitted value of a for each brain state of each subject (Fig. 1). Eq. 1 quantified the relationship between brain areal activity and the entire brain’s activity.
The degree of the similarity between two FC maps F1(i) and F2(i) can be quantified by S4:
$$S=(1-∑_i [[F_1 (i)-m(i)]^2+[F_2 (i )-m(i)]^2 ]/∑_i[[F_1 (i)-mn]^2+[F_2 (i)-mn]^2 ])×100, (i=1, 2, ··· V), (2)$$
where m(i)=[F1(i)+F2(i)]/2, $$$mn=∑_i m(i)/V$$$, and V the total number of voxels in each map. (The unit of S is %). The more similar the two maps are, the larger the value of S. When F1 = F2, S = 100% (identical). When F1 = -F2, S = 0% (no similarity). For all pairwise combinations of the identified FAUPAs, we computed the similarity S for each r, resulted in an r-S curve for each brain state of each subject (Fig.2). To quantify this r-S curve, we introduced the function:
$$S(r)=[(1+r)^b×100]/[(1+r)]^b+(1-r)^b], (3)$$
a modified sigmoid function with the range of values from -1 to 1 for r and from 0% to 100% for S, respectively. Like in Eq. 1, b is also a to be quantified parameter. To quantify the value of b for each brain state of each subject, we defined $$$P=∑_r[S(r)-S_r]^2$$$, where Sr denotes the similarity S for the given r. Minimizing P yielded the best fitted value of b for each brain state of each subject (Fig. 2). a and b were significantly correlated for both resting and task states (Fig. 3).
Discussion and Conclusions
Eq. 1 quantifies the relationship between the TC r of two FAUPAs and the SC R of their corresponding two FC maps for both functional states and every subject (Fig. 1), revealing a relationship between the activity of brain areas and that of the entire brain. Eq. 3 quantifies the relationship between the TC r of two FAUPAs and the similarity S of their corresponding two FC maps for both brain states and every subject, reflecting the same relationship between brain areal activity and the entire brain’s activity as manifested in the strongly correlated a with b (Fig. 3).Acknowledgements
No acknowledgement found.References
1 Huang, J. Human brain functional areas of unitary pooled activity discovered with fMRI. Sci Rep 8, 2388, doi:10.1038/s41598-018-20778-3 (2018).
2 Huang, J. Greater brain activity during the resting state and the control of activation during the performance of tasks. Sci Rep 9, 5027, doi:10.1038/s41598-019-41606-2 (2019).
3 Huang, J. Dynamic activity of human brain task-specific networks. Sci Rep 10, 7851, doi:10.1038/s41598-020-64897-2 (2020).
4 Cohen, A. L. et al. Defining functional areas in individual human brains using resting functional connectivity MRI. Neuroimage 41, 45-57, doi:10.1016/j.neuroimage.2008.01.066 (2008).
Figures

Figure 1.
Illustration of the quantitative relationship between brain areal activity and
the entire brain’s activity. Columns 1-3: similar r-R curves for both brain
states and all subjects. Column
4: illustration of the best fit of Eq. 1 for both resting and task states in a
representative subject. Column 5: the group mean r-R curve (gray line)
averaged over all subjects and its comparison with R(r) (black line) for each
brain state. The error bar indicates SD. Last 3 rows: the quantified value of a in Eq. 1 for
each brain state of each subject.
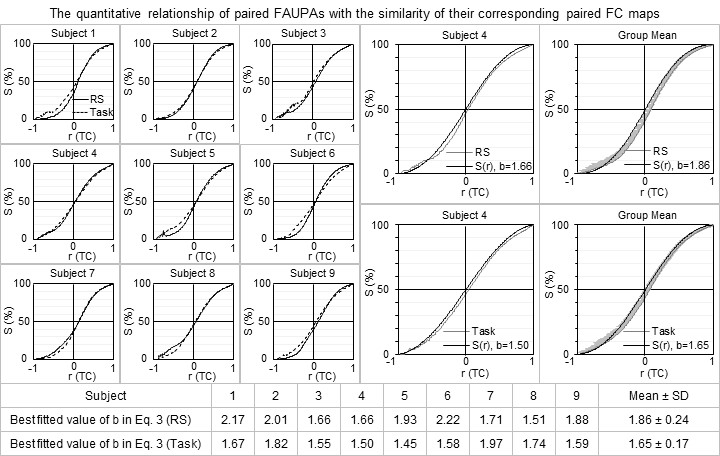
Figure 2.
Illustration of the r-S curves that
quantitatively related the TC r of paired FAUPAs with the similarity S of their
corresponding paired FC maps for each brain state of each subject (columns
1-3). Column 4: illustration of the best fit of Eq. 3 for both resting and task
states of a representative subject. Column 5: the group mean r-S curve (gray
line) averaged over all subjects and its comparison with S(r) (black line)
for each brain state. The error bar indicates SD. Last 3 rows: the quantified value of b in Eq. 3 for
each brain state of each subject.
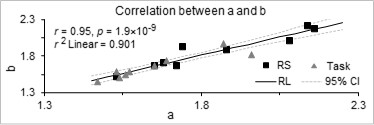
Figure 3.
The strong correlation between a and b for both resting state (RS) and task
reflects the same relationship between the activity of brain areas and that of the
entire brain. RL: regression line; and CI: confidence interval.
DOI: https://doi.org/10.58530/2023/5261