5260
Entropy informs about uncertainty in probabilistic brain tissue segmentation1University College London, London, United Kingdom, 2National Physical Laboratory, London, United Kingdom
Synopsis
Keywords: Segmentation, Brain, Uncertainty
Segmentation is crucial in analysing volumes of brain tissue compartments in studies of healthy development and pathological changes. Probabilistic segmentation is widely used, but the choice of threshold on probability maps has large effects on the resulting tissue volumes, and there is no consensus on optimal choice of such threshold. This work presents a way to minimise this effect by quantifying the uncertainty using Shannon entropy. Entropy map contains information about uncertainties in each individual voxel and this can be used to inform about uncertainty in MRI-based tissue segmentation.
Introduction
Segmentation is crucial in brain imaging analysis to determine volumes of tissue compartments (TCs). Changes in tissue volume are often investigated in studies concerning healthy development, or pathological changes e.g. neurodegeneration. Segmentation software that produces probability maps of TCs is commonly used. However, this requires the selection of a probability threshold (Tp) to produce binary maps to segment TCs and calculate their volumes. For a given TC, every voxel with probability above Tp is included, and every voxel with probability below Tp is excluded. An issue with this approach is the lack of consensus on the choice of optimal Tp1-5, although previous studies agree that the choice of Tp has large effect on binary segmentation results1,2. We present a way to minimise those effects by quantifying uncertainty using Shannon entropy. Entropy measures the average uncertainty in a random variables6,7, and was used previously in segmentation to assess the uncertainty using machine learning8. To our knowledge, it has never been utilised in probabilistic segmentation (using e.g. SPM129) of healthy brain MRI. We investigate to what degree Shannon entropy can help with minimising underestimation or overestimation of brain TCs volume measurements by providing an uncertainty statement on the results of segmentation.Methods
We used T1-weighted scans of 5 healthy adult brains, acquired on a Siemens Prisma 3T scanner. The results are presented for a representative example. The data were not further corrected to avoid contaminating results with effects of pre-processing on uncertainties. Probability maps of grey matter (GM), white matter (WM) and cerebrospinal fluid (CSF) were derived using SMP12 software9 with default settings. Uncertainties were derived as entropy map using Shannon entropy equation6:$$H(p)=\sum_{i=1}^np(x_i)log_2(p(x_i))\quad(1)$$
where: p(xi) is the probability of a voxel belonging to TC class i, with i = 1,2,…n, where n is a number of TCs. A bespoke algorithm was used to capture uncertainty in the high probability class (consisting of voxels with probability > Tp) by adding a new class – uncertain class. The algorithm utilises entropy map and probability maps, with corresponding thresholds. Each voxel can be in one or more certain or uncertain classes. If the entropy of a given voxel is below entropy threshold (TH), we assume the voxel belongs to one tissue only, and place it in the certain class for which probability > Tp. Otherwise the voxel is placed in all uncertain classes of TCs for which probability > Tp. Two assumptions are made: 1) For a given voxel with entropy < TH, only one TC have probability > Tp; 2) If a voxel has entropy < TH and probability > Tp for one TC, it cannot belong to uncertain class of other TCs. We also investigated how volumes of certain and uncertain classes for each TC vary with fixed TH and Tp ranging from 0.0 to 1.0 (step size 0.05). Empirical choice of TH = 0.4 was made so the volumes of the certain class are not particularly sensitive to the choice of Tp.
Results
Entropy map (Fig. 1) informs about uncertainties in each individual voxel. Higher entropy means higher uncertainty. We observe that higher uncertainty is present specifically at the edges between TCs. Fig. 2 shows each segmented TC at low Tp (0.2) with estimated uncertainty (red regions). Fig. 3 shows that at a fixed TH, for Tp between ≈ 0.2 and 0.8, there is a plateau in the variation of the certain class. Table 1 summarises the calculated volumes of each TC with percentages indicating the portion of total volume belonging to uncertain class. Fig. 4 presents all segmented tissues with uncertainties.Discussion
Brain tissue volume estimation is a key indicator for healthy development as well as disease progression, but it is highly dependent on segmentation. Previous studies1,2 established that the choice of threshold on probability maps highly influences resulting volumes. However, there is little consensus on optimal threshold choice 1-5. Including more volume solves possible underestimation. Including uncertainty (estimated with Shannon entropy) solves possible overestimation by informing which regions may still belong to a given tissue but with lower certainty. In Fig. 2, the choice of low Tp was motivated by inspecting results from Fig 3, and that minimises the effect of choice of Tp on the resulting segmentation. The uncertainty maps (Fig. 1 and Fig. 2) highlights tissue boundary regions as the most uncertain, which is expected due to partial volume effects. In these regions the choice of Tp can be particularly important and inconsistencies can easily mask important changes. Estimating and visualising uncertainties is a crucial step in making measurement of brain tissue volume a technically complete measurement. Furthermore, together Fig. 2 and Fig. 4 could present additional information that could be utilized in e.g. surgical planning, visualising uncertainties at tissue boundaries.Conclusions
We showed that Shannon entropy can inform about uncertainty in MRI scan segmentation, which could be a useful information for e.g., studies investigating longitudinal volume changes. There is more uncertainty at the edges between tissues and the choice of Tp has a large effect on binary maps. Including uncertainty in volume measurement can minimise the effects of choice of Tp on the results.Acknowledgements
This project is funded by UCL and the National Physical Laboratory as part of the EPSRC iCASE 2021-22 programme. The NPL contribution was funded by the Department of Business, Engineering and Industrial Strategy (BEIS) through the National Measurement Strategy under the Data Science Modelling & Analytics Applications theme.References
1. Anbeek et al., 2003, Neuroimage; 2. Tudorascu et al., 2016, Front Neurosci; 3. Anbeek et al., 2008, Pediatr Res.; 4. Anabeek et al., 2005, Neuroimage; 5. Eggert et al., 2012, PLoS One; 6. Cover and Thomas, 1991, Willey Interscience, p.5; 7. Krygier et al., 2021, nature communications; 8. Roy et al., 2019, Neuroimage; 9. "SPM - Statistical Parametric Mapping". www.fil.ion.ucl.ac.uk. Retrieved 2022-11-03.Figures
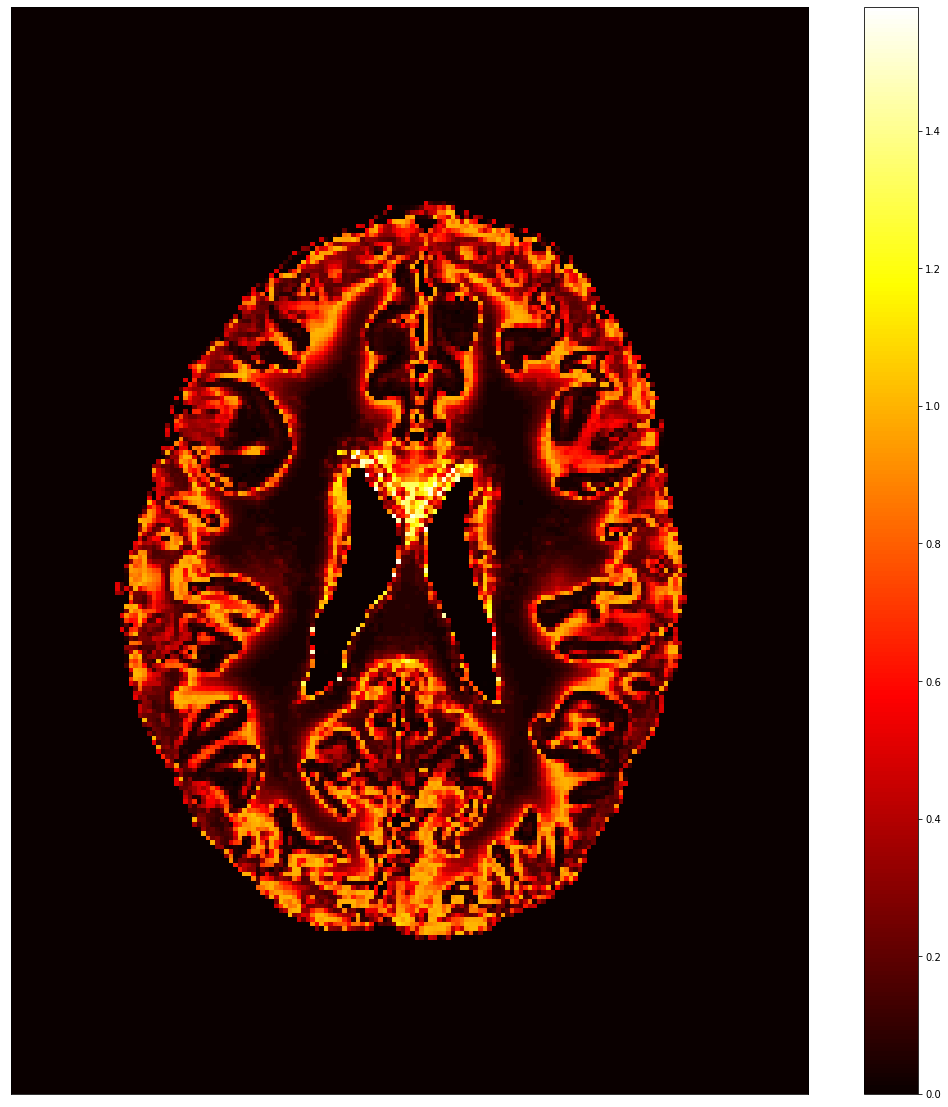
Fig. 1. Entropy map derived from Shannon entropy equation for probability maps of GM, WM and CSF. Higher entropy indicates higher average uncertainty for a given voxel.
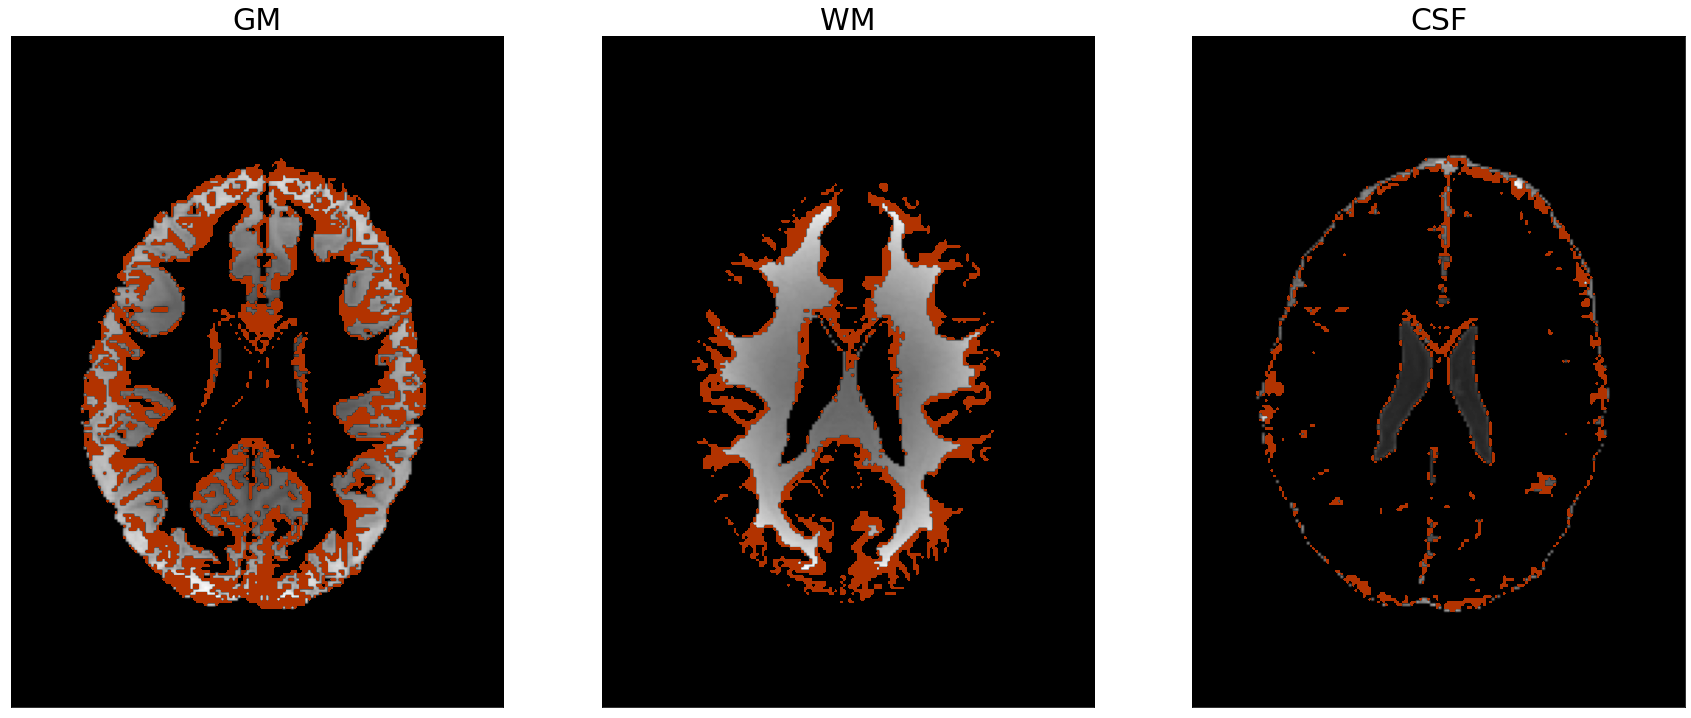
Fig. 2. Segmented tissues (GM, WM, CSF) including uncertainties coloured in red.
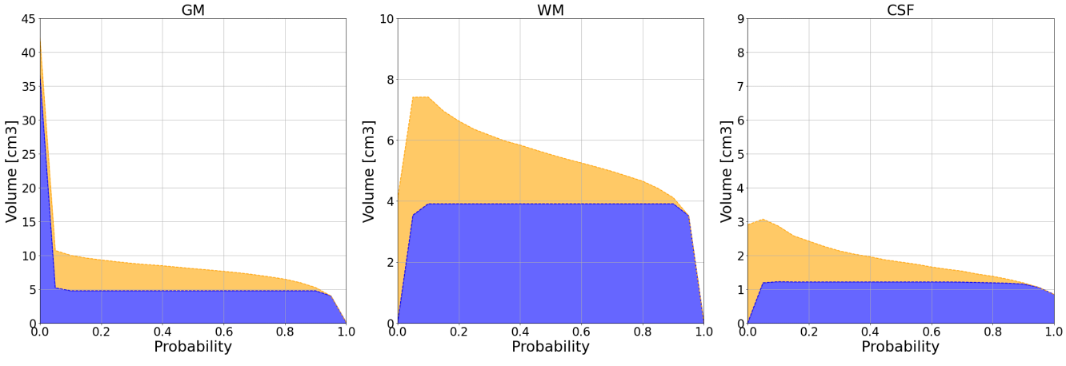
Fig. 3. Volume variation at fixed TH and varying Tp for each tissue (GM, WM, CSF) in a single representative slice. Blue regions present a volume with low entropy, and yellow regions present volume with high entropy (uncertain).
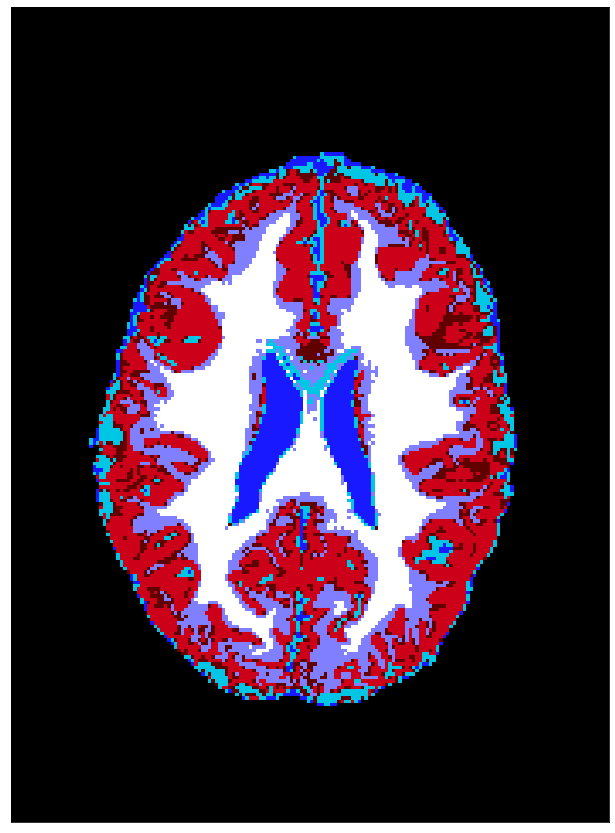
Fig. 4. Map presenting all binary maps combined for all tissues with uncertainties. GM certain – red; GM uncertain – dark red; WM certain – white; WM uncertain – violet; CSF certain – dark blue; CSF uncertain – light blue; background – black.
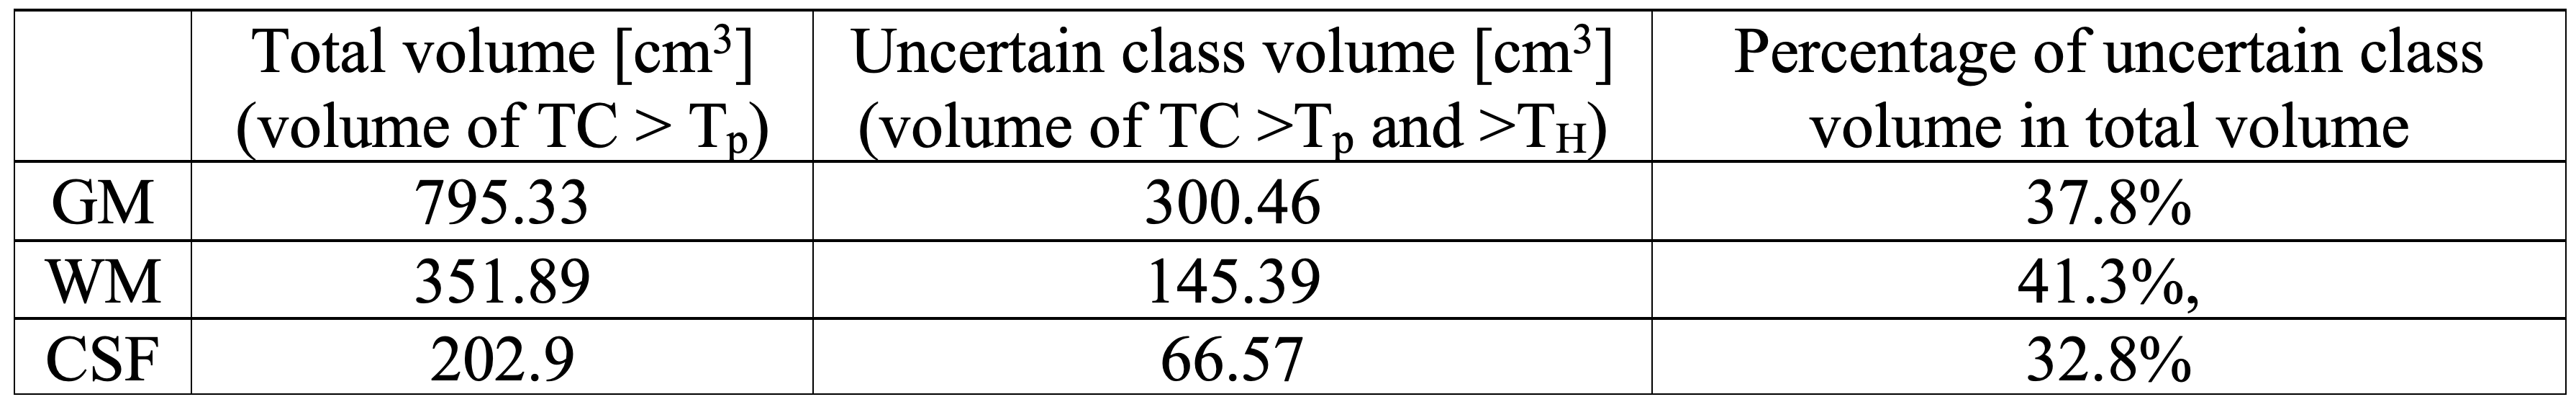
Table 1. Calculated total volumes and uncertain class volumes for TCs