5258
Pilot Tone vs pTx Scattering: A Comparison between ‘RF Sensor’ Methods for Rigid Body Motion Detection of the Brain at 7T
James L. Kent1, Ladislav Valkovič2,3, Iulius Dragonu4, Mark Chiew1,5,6, and Aaron T. Hess1
1Wellcome Centre for Integrative Neuroimaging, FMRIB, Nuffield Department of Clinical Neurosciences, University of Oxford, Oxford, United Kingdom, 2Oxford Centre for Clinical Magnetic Resonance Research, John Radcliffe Hospital, University of Oxford, Oxford, United Kingdom, 3Department of Imaging Methods, Institute of Measurement Science, Slovak Academy of Sciences, Bratislava, Slovakia, 4Research & Collaborations GB&I, Siemens Healthcare Ltd, Camberley, United Kingdom, 5Department of Medical Biophysics, University of Toronto, Toronto, ON, Canada, 6Physical Sciences, Sunnybrook Research Institute, Toronto, ON, Canada
1Wellcome Centre for Integrative Neuroimaging, FMRIB, Nuffield Department of Clinical Neurosciences, University of Oxford, Oxford, United Kingdom, 2Oxford Centre for Clinical Magnetic Resonance Research, John Radcliffe Hospital, University of Oxford, Oxford, United Kingdom, 3Department of Imaging Methods, Institute of Measurement Science, Slovak Academy of Sciences, Bratislava, Slovakia, 4Research & Collaborations GB&I, Siemens Healthcare Ltd, Camberley, United Kingdom, 5Department of Medical Biophysics, University of Toronto, Toronto, ON, Canada, 6Physical Sciences, Sunnybrook Research Institute, Toronto, ON, Canada
Synopsis
Keywords: Motion Correction, Motion Correction
RF sensor methods for motion correction require no (or minimal) additional hardware, are sequence independent and have high temporal resolution. Several RF sensor-based methods for rigid-body head motion detection have been demonstrated but which method offers the most sensitivity to motion is yet unknown. We aim to compare the sensitivity of PT and pTxS methods by simultaneously measuring these signals during continuous motion, training a linear model from EPI registered images and analysing the ability to predict rigid head positions. Currently, we see little difference in their ability to predict rigid head motion but further investigation is needed.Introduction
RF sensor methods for motion detection require no (or minimal) additional hardware, are sequence independent and have high temporal resolution. Several RF sensor-based methods for rigid-body head motion detection have been demonstrated1,2 but which method offers the most sensitivity to motion is yet unknown. Pilot tone (PT) uses an external ~90kHz off-resonance radiofrequency source at a single frequency and is measured on the receive channels during data acquisition and hence the signal appears in the oversampled region of k-space. Parallel transmit scattering (pTxS) differs in that it reflects the electrical coupling between transmit channels during transmission and is measured by the directional couplers (typically used for SAR monitoring). In this work we compare the accuracy of PT and pTxS in predicting rigid-body head motion with a multivariate linear regression model.Methods
Two subjects were scanned in a 7 Tesla MRI (VB17, Siemens Healthcare) equipped with parallel transmit and imaged using an 8Tx/32Rx head coil (Nova Medical). Subject A was guided via a projector to perform circular, up/down, and left/right motion paradigms. Subject B performed similar head motions as subject A but with a larger amplitude and additional roll motion. A segmented CAIPI 3D EPI sequence was used to obtain 1200 volumes (TRvol = 256 ms). TE/TR = 6/16 ms, FA = 15°, BW = 2894 Hz/px, FOV = 250×250×125 mm3, slice thickness = 3.9 mm, scan matrix = 64×49×32 (including 75% partial Fourier), total 3D acceleration factor 8. PT and pTxS signals were simultaneously measured. A water excitation pulse was overlaid with a frequency-division multiplexed scattering matrix measurement3 (100 kHz offset; 10 kHz spacing; 15% pulse amplitude), giving 16 pTxS measurements per image volume. PT was implemented by transmitting a pure sine wave (90 kHz off resonance) using an external RF signal generator (Signal Hound, VSG25A) with a nominal output power of -30 dBm attached to a dipole antenna placed at the end of the patient table.Reconstruction was performed using a SENSE reconstruction in the BART toolbox4. Brain extraction and 3D rigid-body registration were performed against the first image volume using FSL’s BET and FLIRT tools5 to obtain the relative head position from the transformation matrices. These were then lowpass filtered to remove sporadic erroneous measurements from registration. Eddy current related phase shifts and +/- readout frequency changes in the PT signal were corrected by multiplying each data point with the conjugate phase from a reference (summation across all receive channels). PT signals were averaged for each EPI shot to obtain 16 measurements per image volume. For pTxS, the real and imaginary components of the (8×8) S-matrix were reshaped as a vector (1×128) and used for training and evaluation of the linear model in MATLAB (R2021a, MathWorks). For PT, the absolute value of the PT signal results in a (1×32) vector. A multivariate linear regression model was formed by fitting the first 400 EPI registrations (600 for Subject B) to the RF signals and the remaining 800 volumes were used to test the model. The six degrees of motion were collapsed to a single global RMSE6 score with an assumed head radius of 80mm. To prevent overfitting, PT and pTxS signals were standardised, whitened using a singular value decomposition (SVD), and truncated to reduce their dimensionality to rank 12. A combination of signals was also evaluated (1×160).
Results
When instructed to move, subjects A/B moved with an average velocity of 2.5/4.8mms-1 with translations and rotations up to 20/30mm and 7/10°. During a stationary 20s window, the RMSE for subjects A/B was 1.0/0.7mm for PT and 0.6/0.5mm for pTxS. During motion, the ‘ground truth’ registration precision for subjects A/B was estimated to be 0.5mm/0.9mm for translations and 0.2°/0.3° for rotations (determined as the first order derivative/). The cumulative energy in the first 12 singular values was 97% for pTxS, 99% for PT, and 97% for combined signals. The RMSE for each degree of freedom is shown in Table 1 as well as the average global RMSE which was 1.5/2.3mm for PT, 1.4/2.1mm for pTxS and 1.3/2.1mm for a combination of these for Subjects A/B. The predicted motion traces from PT, pTxS and a combination of both are shown in Figure 1 for each degree of freedom and correlate well with the ground truth.Discussion
Both PT and pTxS show an increased global RMSE for subject B. This is likely due to changes in coil loading related to rigid motion; this is especially evident towards the end of the test scans. Motion predictions using all methods agree with EPI registered motion and where they do not, they tend to agree well with each other, indicating true changes not captured by the rigid-body motion model. Further work is required to interpret non-rigid body system changes and refine the motion model to achieve the accuracy required for in-vivo motion tracking. Going forward, we will also explore the sensitivity to smaller amplitudes of motion.Conclusion
There is high sensitivity to rigid body head motion in both PT and pTxS signals. Both methods currently achieve a similar degree of accuracy, however, more investigation is required to determine the sensitivity for smaller amplitudes of motion.Acknowledgements
JK acknowledges the support of EPSRC through an iCASE award in collaboration with Siemens Healthcare Ltd. The Wellcome Centre for Integrative Neuroimaging is supported by core funding from the Wellcome Trust (203139/Z/16/Z). LV is funded by a Sir Henry Dale Fellowship awarded jointly by the Wellcome Trust and the Royal Society (221805/Z/20/Z) and also acknowledges the support of the Slovak Grant Agencies VEGA (2/0003/20) and APVV (#19–0032). MC is supported by the Canada Research Chairs Program.References
- Papp D, Jaeschke S, Rieger SW, Clare S, Hess AT. Simultaneous detection of cardiac, respiratory and rigid body head motion using the scattering of a parallel transmit RF coil at 7T. In: Proc. Intl. Soc. Mag. Reson. Med. 26. 2018. p. 1168.
- Speier P, Fenchel M, Rehner R. PT-Nav: a novel respiratory navigation method for continuous acquisitions based on modulation of a pilot tone in the MR-receiver. In: Proc. ESMRMB. Vol. 28. 2015. pp. 97–98.
- Jaeschke SHF, Robson MD, Hess AT. Scattering matrix imaging pulse design for real-time respiration and cardiac motion monitoring. Magn Reson Med 2019. 82:2169–2177.
- Uecker M, et al. mrirecon/bart: version 0.7.00 (v0.7.00). Zenodo.
- Jenkinson M, Bannister P, Brady M, Smith S. Improved Optimization for the Robust and Accurate Linear Registration and Motion Correction of Brain Images. Neuroimage 2002;17:825–841.
- Jenkinson M. Measuring Transformation Error by RMS Deviation. Intern Tech Rep TR99MJ1, FMRIB Centre, Univ Oxford 1999.
Figures
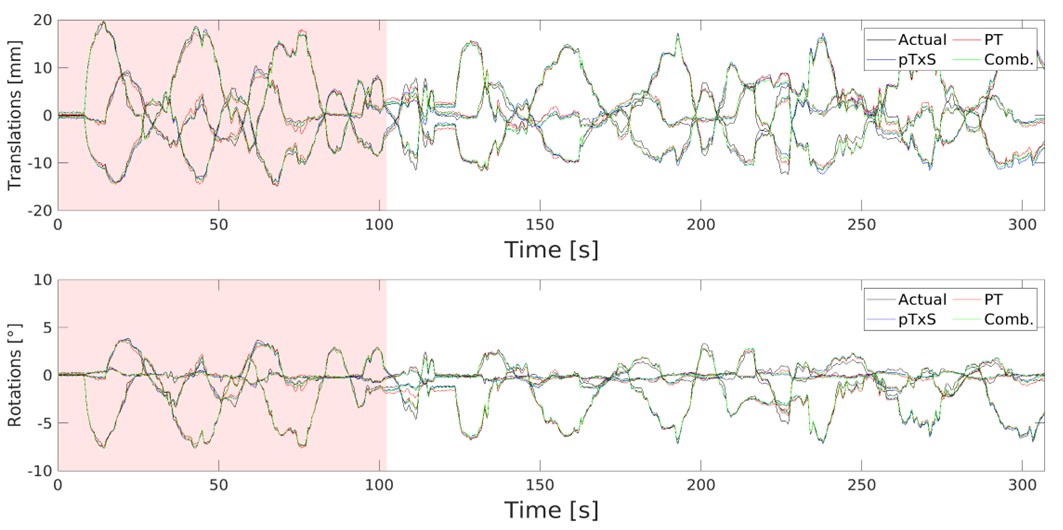
Figure 1: Six degree of freedom motion traces relative
to the first imaging volume for ‘actual’ motion, pTx Scattering, Pilot Tone and
a combination of pTx Scattering and PT signals for subject A. The red section shows data
used for training (400 volumes) and to predict remaining timeseries (800
volumes).
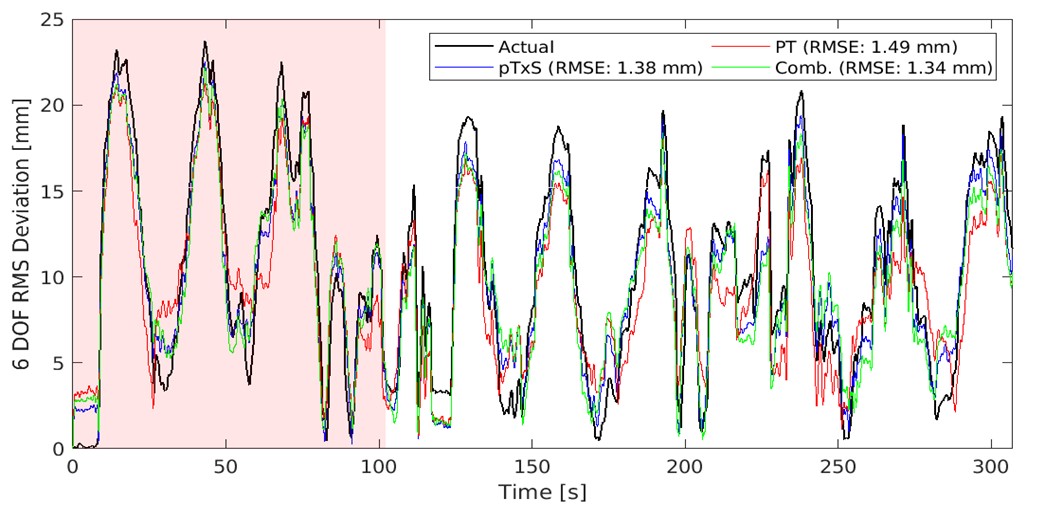
Figure 2: Global root-mean-square deviation in motion
traces to the first volume for EPI registered motion, pTx Scattering, Pilot
Tone and a combination of pTx Scattering and PT signals for subject A. The average global
root-mean-square error (RMSE) across the predicted timeseries is displayed in
the top right.
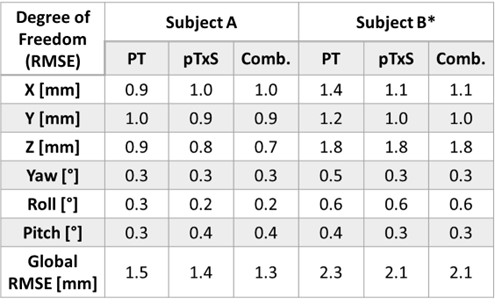
Table 1: Root-mean-square error for Pilot Tone (PT),
pTx Scattering (pTxS) and a combination of PT and pTxS signals for both subject
A and B across the predicted timeseries. *Data for subject B is trained on 600
volumes to include the additional roll motion in training.
DOI: https://doi.org/10.58530/2023/5258