5254
Translational validation of a MRI-based CMRO2 mapping method for penumbra definition in acute ischemic stroke1Univ Lyon, CarMeN Laboratory, INSERM, INRA, INSA Lyon, Universite Claude Bernard Lyon 1, Lyon, France, 2Olea Medical, La Ciotat, France, 3Univ. Grenoble Alpes, Inserm, U1216, Grenoble Institut Neurosciences, Grenoble, France, 4Institut des Sciences Cognitives Marc Jeannerod (ISCMJ), Unite Mixte de Recherche 5229 du Centre National de la Recherche Scientifique (CNRS), Bron, France, 5Cynbiose SAS, Marcy-L'Etoile, France, 6CERMEP - Imagerie du Vivant, Lyon, France, 7Hospices Civils of Lyon, Lyon, France, 8Stroke department, Hospices Civils of Lyon, Lyon, France, 9CREATIS, CNRS UMR-5220, INSERM U1206, Universite Lyon 1, INSA Lyon, Villeurbanne, France, 10Neuroradiology department, Hospices Civils of Lyon, Lyon, France
Synopsis
Keywords: Data Processing, Oxygenation, Oxygen Metabolism
Latest challenges in acute ischemic stroke management involve tissue-based approaches to define a tailored ischemic penumbra to each patients. Oxygen metabolism imaging offers new perspectives to tackle these challenges. A fully automated pipeline was developed providing oxygen metabolism parameters from MRI acquisitions including advanced processing methods such as motion-correction, registration and bayesian-based deconvolution. The method was tested on an ischemia-reperfusion non-human primate model with simultaneous PET-MRI acquisitions providing gold-standard comparison of oxygen parameters. Results show strong similarities in ratio of penumbral tissues detected in the ischemic hemisphere between the two modalities and opens new perspectives of improvement in parameters definition.Introduction
In case of acute ischemic stroke (AIS), the infarct core (irreversibly damaged tissues) progresses within the ischemic penumbra (severely hypoperfused, electrically silent tissues with preserved metabolism), but the latter can be salvaged if perfusion is restored 1, 2. Its mapping, using medical imaging, is critical when managing AIS patients in order to identify those who are the most amenable to reperfusion strategies 3. Initially, [15O]-PET imaging validated the existence of the ischemic penumbra with metabolic parameters albeit exposed patients to radioactivity 2. Alternatives, such as CT and MRI, have been introduced to estimate the core progression in clinical routine and emergency settings 4, 5. However, their reliability in defining the penumbra is questioned as “tissue-based” approaches tailored to each patient, are increasingly favored 6. In this context, new parameters better defining the penumbra would greatly improve AIS care. Numerous methods providing oxygen metabolism parameters from MRI acquisitions based on Blood Oxygen Level Dependent effect (BOLD) and/or Susceptibility Weighted Imaging (SWI) have been proposed 7–10.The multiparametric quantitative BOLD (mqBOLD) method provides oxygen extraction fraction (OEF) and cerebral metabolic rate of oxygen (CMRO2) by combining relaxation rate and hemodynamic maps such as cerebral blood flow (CBF) 8. A fully automated pipeline was defined integrating the mqBOLD method along with advanced pre-processings.Methods
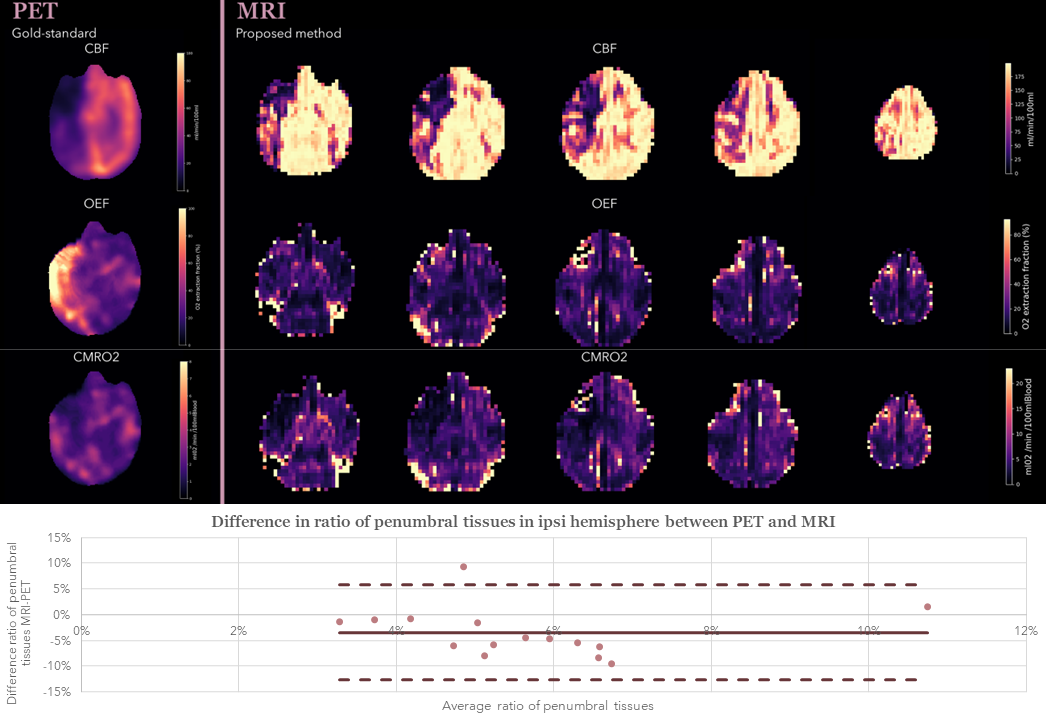
Pre-processings include motion correction, registration and bayesian deconvolution of dynamic signals 11. The processing steps with input and output data are given in Figure 1. The pipeline was developed using retrospective data of a pilot study of 31 patients with symptomatic intracranial stenosis but was also compatible with pre-clinical data of non-human primates (NHP, macaca fascicularis)12. Therefore, retrospective pre-clinical data of a non-human primate model of stroke ischemia-reperfusion with simultaneous PET-MRI multisettings imaging were evaluated using the newly developed pipeline 13. This translational method enables the validation of MRI oxygen metabolism imaging against PET gold standard in AIS. The newly proposed method was compared to the PET gold-standard for each pre-clinical subject (N=15) in occlusion settings. The challenge of comparing results with a high variability across individiuals was overcome by a Z-score normalization based analysis: (1) The outliers were filtered with the Hampel identifier 14, (2) The mean and standard deviation were calculated in the contra-hemisphere (opposite side of the lesion), (3) The Z-score image was calculated on the lesion side voxels (ipsi-hemisphere) using the previously mentioned mean and standard-deviation with Zscore=(xi−μ)/σ. The resulting Z-score image of the ipsi-hemisphere was compared across individuals to PET data using the same process. The ratio of penumbra in the ipsi-hemisphere was calculated based on its initial definition of decreased CBF, increased OEF and maintained CMRO2. Penumbral voxels were selected within the hemisphere using the following criteria:$$(Z_{score}(CBF) < 1^{st}quantile) \& (Z_{score}(OEF) > 3^{rd}quantile) \& (1^{st}quantile < Z_{score}(CMRO_2) < 3^{rd}quantile)$$
The resulting selection on PET and MRI data were compared using Bland-Altman representations.
Results
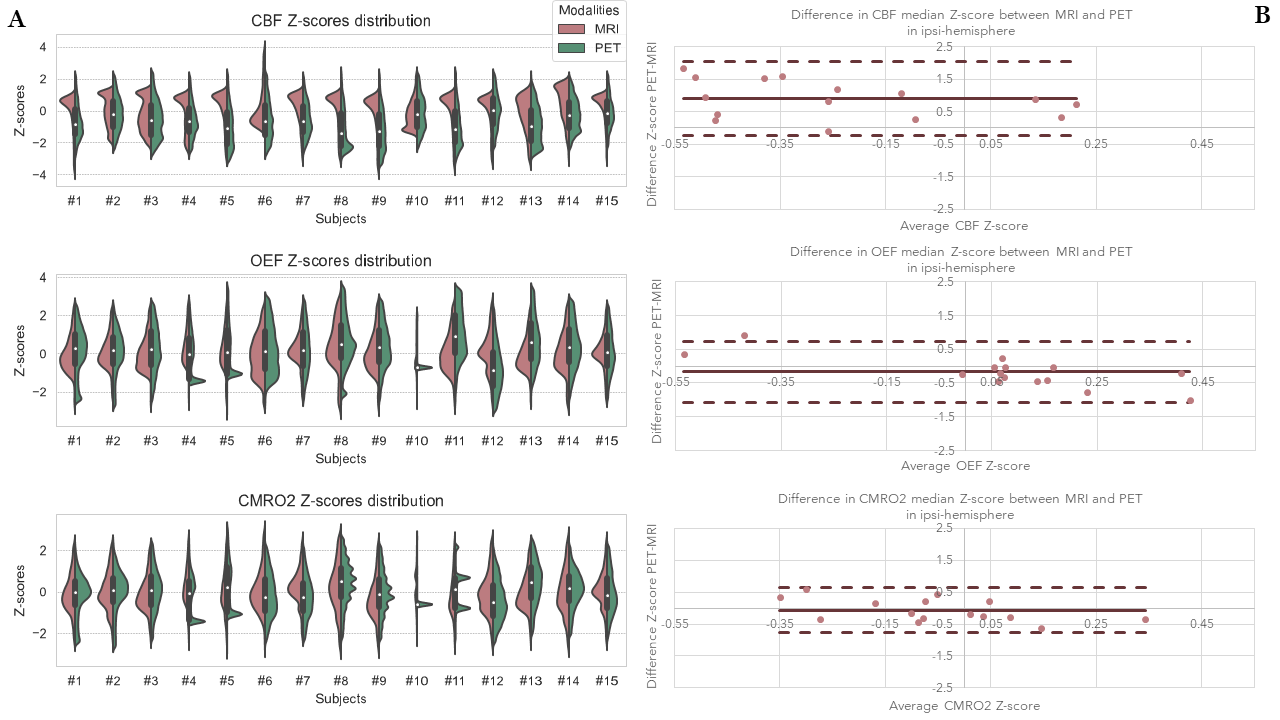
Figure 2 provides the resulting CBF, OEF and CMRO2 maps over 5 slices in parallel with equivalent PET maps. At the bottom of Figure 2 a comparison of penumbral tissues ratio within the ipsi region between PET and MRI shows a high degree of similarity for all lesion sizes. Figure 3 provides an overview of the Z-score results in ipsi-hemisphere. The comparison of the Z-score distribution between PET and MRI for each map in Figure 3A, shows a lower variability with the MRI method as opposed to PET throughout individuals. However, the tendancies for decreased CBF and increased OEF appear stronger in the PET distribution compared to MRI. The Bland-Altman comparisons of median Z-score in Figure 3B show a difference in CBF calculations compared to OEF and CMRO2 maps. Overall, the Z-score median in PET and MRI tend to be similar and the expected penumbral-tissue type variations can be observed with the average CBF and OEF bellow and above zero, respectively.Discussion and conclusion
Regarding the method, bias have been identified in the Bland-Altman representations highlighting the need for better qualification and quantification parameters, specifically adapting to white matter and gray matter differences.While further analysis after subjects co-registration are required to fully qualify the newly-proposed method, this analysis shows encouraging results in penumbra detection when compared to PET gold-standard. The subjects co-registration should also provide a better comparison of the detected penumbral tissues with access to more reliable image comparison metrics and volumic evaluations. Additionally, the penumbra must be studied through the scope of a reperfusion therapy target predictor to fully validate its relevance for AIS management. The ischemia-reperfusion pre-clinical model provides reperfusion and follow-up imaging to further explore this scope.Acknowledgements
We acknowledge all actors of both clinical and pre-clinical studies for providing valuable data and making this research possible.References
1. Astrup J, Siesjo BK, and Symon L. Thresholds in cerebral ischemia - the ischemic penumbra. Stroke 1981;12. Publisher: American Heart Association:723–5.
2. Baron JC, Bousser MG, Comar D, Soussaline F, and Castaigne P. Noninvasive Tomographic Study of Cerebral Blood Flow and Oxygen Metabolism in vivo. European Neurology 1981;20. Publisher: Karger Publishers:273–84.
3. Powers WJ, Rabinstein AA, Ackerson T, et al. Guidelines for the Early Management of Patients With Acute Ischemic Stroke: 2019 Update to the 2018 Guidelines for the Early Management of Acute Ischemic Stroke: A Guideline for Healthcare Professionals From the American Heart Association/American Stroke Association. Stroke 2019;50. Publisher: American Heart Association:e344–e418.
4. Warach S, Dashe JF, and Edelman RR. Clinical outcome in ischemic stroke predicted by early diffusion-weighted and perfusion magnetic resonance imaging: a preliminary analysis. Journal of Cerebral Blood Flow and Metabolism: Official Journal of the International Society of Cerebral Blood Flow and Metabolism 1996;16:53–9.
5. Wintermark M, Reichhart M, Thiran JP, et al. Prognostic accuracy of cerebral blood flow measurement by perfusion computed tomography, at the time of emergency room admission, in acute stroke patients. Annals of Neurology 2002;51:417–32.
6. Chalet L, Boutelier T, Christen T, et al. Clinical Imaging of the Penumbra in Ischemic Stroke: From the Concept to the Era of Mechanical Thrombectomy. Frontiers in Cardiovascular Medicine 2022;9.
7. He X and Yablonskiy DA. Quantitative BOLD: mapping of human cerebral deoxygenated blood volume and oxygen extraction fraction: default state. Magnetic Resonance in Medicine 2007;57:115–26.
8. Christen T, Lemasson B, Pannetier N, et al. Evaluation of a quantitative blood oxygenation level-dependent (qBOLD) approach to map local blood oxygen saturation. NMR in biomedicine 2011;24:393–403.
9. Cho J, Kee Y, Spincemaille P, et al. Cerebral metabolic rate of oxygen (CMRO2 ) mapping by combining quantitative susceptibility mapping (QSM) and quantitative blood oxygenation level-dependent imaging (qBOLD). Magnetic Resonance in Medicine 2018;80:1595–604.
10. Fan AP, Khalil AA, Fiebach JB, et al. Elevated brain oxygen extraction fraction measured by MRI susceptibility relates to perfusion status in acute ischemic stroke. Journal of Cerebral Blood Flow and Metabolism: Official Journal of the International Society of Cerebral Blood Flow and Metabolism 2020;40:539–51.
11. Boutelier T, Kudo K, Pautot F, and Sasaki M. Bayesian Hemodynamic Parameter Estimation by Bolus Tracking Perfusion Weighted Imaging. IEEE Transactions on Medical Imaging 2012;31. Conference Name: IEEE Transactions on Medical Imaging:1381–95.
12. Eker OF, Ameli R, Makris N, et al. MRI Assessment of Oxygen Metabolism and Hemodynamic Status in Symptomatic Intracranial Atherosclerotic Stenosis: A Pilot Study. Journal of Neuroimaging 2019;29. eprint: https://onlinelibrary.wiley.com/doi/pdf/10.1111/jon.12615:467–75.
13. Debatisse J, Wateau O, Cho TH, et al. A non-human primate model of stroke reproducing endovascular thrombectomy and allowing long-term imaging and neurological read-outs. Journal of Cerebral Blood Flow & Metabolism 2021;41:745–60.
14. Davies L and Gather U. The Identification of Multiple Outliers. Journal of the American Statistical Association 1993;88. Publisher: Taylor & Francis eprint: https://www.tandfonline.com/doi/pdf/10.1080/01621459.1993.10476339:782–92.
Figures
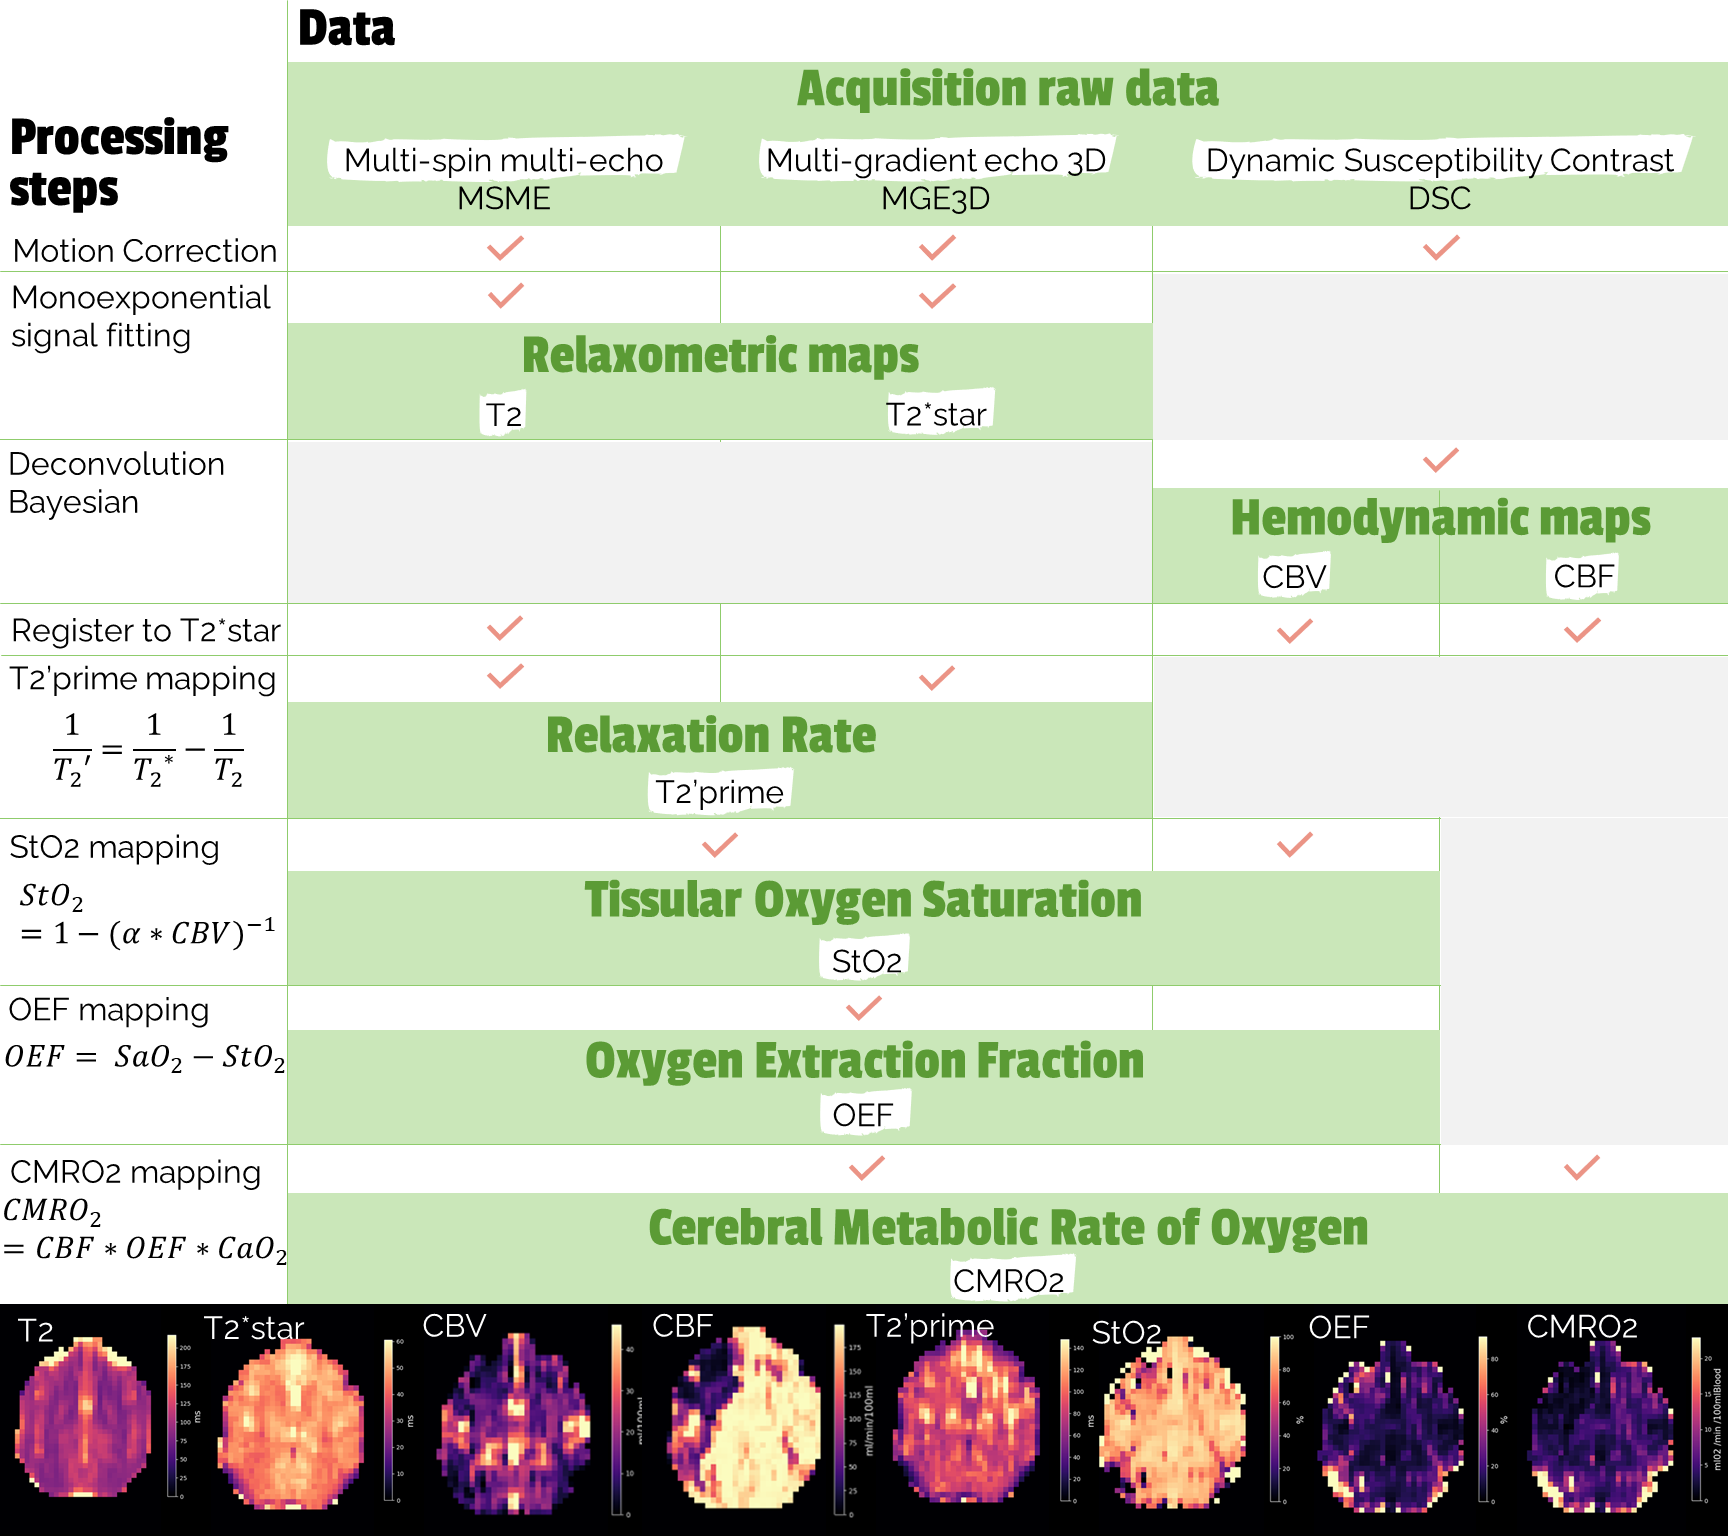
Figure 1: Detailed processing steps with input and output data. CBV: Cerebral Blood Volume, CBF: Cerebral Blood FLow, SaO2: Arterial blood oxygen saturation, CaO2: Blood oxygen content, $$\alpha = (3/4) * \pi * \gamma * \delta \chi _0 * B_0 * Hct $$