5247
Radiologist validation of a multi-tissue breast segmentation convolutional neural net ensemble
Michelle Weitz1, John R. Pfeiffer1, Arda Pekis1, Tyler M. Earnest1, Joseph R. Peterson1, Anuja K Antony1, Kathryn Zamora2, and Stefanie Woodard2
1SimBioSys, Inc., Chicago, IL, United States, 2University of Alabama at Birmingham Heersink School of Medicine, Birmingham, AL, United States
1SimBioSys, Inc., Chicago, IL, United States, 2University of Alabama at Birmingham Heersink School of Medicine, Birmingham, AL, United States
Synopsis
Keywords: Breast, Cancer
We developed and validated (with the expertise of two breast-specialized radiologists) an ensembled suite of convolutional neural network models that accurately segment tumor, chest wall, adipose, gland, vasculature, and skin from a patient's T1-weighted DCE breast MRI.Introduction
Magnetic resonance imaging (MRI), used in concert with computer-aided methods, can detect, diagnose, and characterize invasive breast cancers. To this end, fully automated segmentation of breast tissues is important for quantitative breast imaging analysis, and for use in spatially resolved biophysical models of breast cancer. To ensure the accuracy of segmentations, tissue label maps from such models must be validated by domain experts such as radiologists.We developed an ensembled suite of convolutional neural networks (core components of SimBioSys TumorSight) that segmented tumor and other tissues, in and around the breast (chest, adipose, gland, vasculature, skin). We sought to validate model results against the expertise of two breast-specialized radiologists. A ground truth dataset was created based on the radiologists’ assessments of tumor longest dimensions (LD), tumor segmentation, multi-tissue segmentation, and background parenchymal enhancement (BPE). This allowed us to quantify the agreement between the convolutional neural networks (CNN) and the radiologists, and also the observed variability between radiologists. This metric can be used as a lower bound for the expected variability between CNN results and radiologists’ assessments, providing a benchmark to evaluate current and future models.
Methods
CNN-generated tumor and multi-tissue segmentations were created for 100 early-stage breast cancer cases based on dynamic contrast enhanced (DCE) MRI from the University of Alabama Birmingham (UAB) Hospital (e.g., Figure 1). Each case underwent an internal review and, if necessary, the tumor segmentation was manually edited (“manual segmentation”) to more accurately reflect the underlying tumor characteristics. These cases were then independently assessed by two board-certified radiologists (Reviewer 1 and Reviewer 2) for the following: LD (measurements of primary tumor and total extent of disease), tumor segmentation (approve/reject), multi-tissue segmentation (approve/reject), as well as categorizing BPE per BI-RADS1. The reviewers were required to make their LD measurements prior to viewing the tumor and multi-tissue segmentation to minimize bias. CNN-generated segmentations without any manual edits were used for comparison (“CNN segmentations”). A workflow summary is shown in Figure 2.Percent approval by reviewer was calculated, and lower bounds (LB) of a one-sided 95% exact confidence interval (CI) are given for both tumor and multi-tissue segmentations. IRR was measured between the two reviewers using Gwet's AC12 for tumor and multi-tissue segmentation calls, as well as BPE. Reviewer’s LD measurements were used to create a 3D bounding box around the tumor. Intra-class correlation3 (ICC) was used to assess the reliability of the aforementioned measurements between the reviewers, the CNN segmentations, and the manual segmentations.
Results
Reviewer 1 approved 67 of 91 tumor segmentations (73.6%, LB 95% CI=65.0%) and 87 of 90 multi-tissue segmentations (96.7%, LB 95% CI=91.6%). Reviewer 2 approved 84 of 96 tumor segmentations (87.5%, LB 95% CI=80.5%) and 88 of 93 multi-tissue segmentations (94.6%, LB 95% CI=89.0%). Overall, 87 of the 97 reviewed tumor segmentations (89.7%) were approved by one or more reviewer, along with 80 of 86 multi-tissue segmentations (93.0%). Reasons for incomplete reviews included issues loading/visualizing the images, and issues locating the lesion. A Gwet’s AC1 of 0.70, indicating substantial reliability, was observed between reviewers regarding tumor segmentation calls, and a Gwet’s AC1 of 0.93 was observed for multi-tissue segmentation calls, indicating strong reliability. High concordance was observed on BPE categorization (71.0% agreement, Gwet’s AC1=0.62). Cohort demographics and clinical characteristics are found in Table 1.The ICC coefficient for the log of the bounding box volume around the primary tumor was 0.82 (95% CI: [0.75, 0.87] between the two reviewers and the CNN segmentations, indicating good reliability. ICC was 0.92 (95% CI: [0.89, 0.94]) between the two reviewers and the manual segmentations, indicating excellent reliability. Strong Pearson correlations (rrange=0.77 to 0.90) between maximum LD measurements were observed for all six comparisons (Figure 3). Summary statistics for the maximum LD measurements and bounding box volumes are found in Table 2.
Discussion
We observed a high level of acceptance for both tumor and multi-tissue segmentations. In addition, we observed high levels of agreement between Reviewer 1 and 2 on measures of tumor segmentation acceptance, and multi-tissue segmentation acceptance. These findings strongly support the validity of our CNN for tumor and multi-tissue segmentation purposes and facilitate the use of accepted segmentations in downstream segmentation model fine-tuning.We also found high concordance between Reviewer 1 and 2 regarding measurement of the main mass LD, and the total extent of disease LD. Additionally, strong correlation was observed between the CNN segmentations and the reviewers, as well as the manual segmentations and the reviewers (Figure 3). Importantly, these concordance measurements assist the contextualization of CNN model output, by establishing a ceiling of future model performance. A high level of concordance was also observed, regarding BPE categorization (71.0% agreement); this context will be used as an internal benchmark in the development of future BPE-detection models. These results are consistent with recent studies4,5.
Conclusion
Input and evaluation from domain experts (e.g., radiologists) is an invaluable step in validating the results of CNN-generated segmentations and creating benchmarks for future work. By completing this exercise, we have assessed the acceptability of our segmentations, quantified reliability between CNN, internal reviewers, and external radiologists, and generated a ground truth dataset that can be used for future validation and research/development efforts.Acknowledgements
The study team would like to thank Dr. Erica Stringer-Reasor for her aid in facilitating this work.References
- Morris EA, Comstock CE, Lee CH, et al. ACR BI-RADS® Magnetic Resonance Imaging. In: ACR BI-RADS® Atlas, Breast Imaging Reporting and Data System. Reston, VA, American College of Radiology; 2013.
- Gwet K. L. (2008). Computing inter-rater reliability and its variance in the presence of high agreement. The British journal of mathematical and statistical psychology, 61(Pt 1), 29–48. https://doi.org/10.1348/000711006X126600
- Shrout, P. E., & Fleiss, J. L. (1979). Intraclass correlations: Uses in assessing rater reliability. Psychological Bulletin, 86(2), 420–428. https://doi.org/10.1037/0033-2909.86.2.420
- Bignotti, B., Calabrese, M., Signori, A., Tosto, S., Valdora, F., Tagliafico, A., Durando, M., & Mariscotti, G. (2019). Background parenchymal enhancement assessment: Inter- and intra-rater reliability across breast MRI sequences. European journal of radiology, 114, 57–61. https://doi.org/10.1016/j.ejrad.2019.02.036
- Zhao, H. B., Liu, C., Ye, J., Chang, L. F., Xu, Q., Shi, B. W., Liu, L. L., Yin, Y. L., & Shi, B. B. (2021). A comparison between deep learning convolutional neural networks and radiologists in the differentiation of benign and malignant thyroid nodules on CT images. Endokrynologia Polska, 72(3), 217–225. https://doi.org/10.5603/EP.a2021.0015
Figures
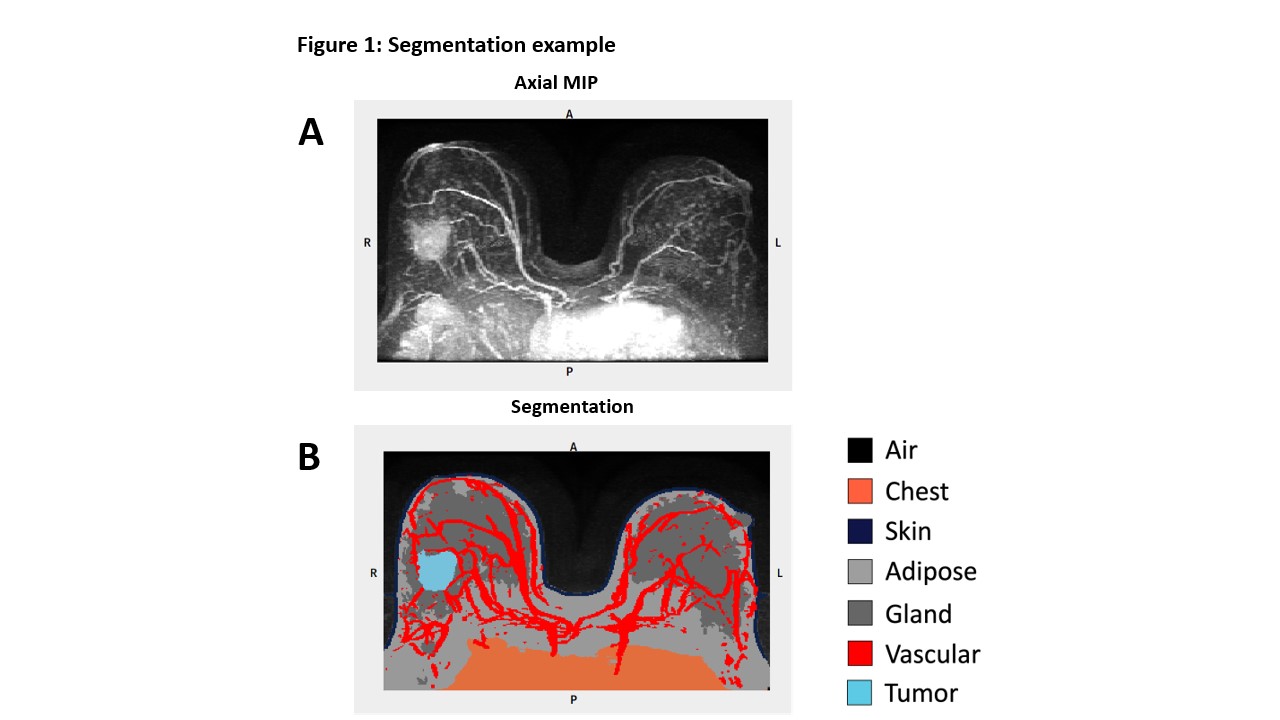
Figure 1: In Figure 1A the subtraction series axial maximum intensity projection (MIP) is shown, while Figure 1B shows an example of the CNN-generated tumor and multi-tissue segmentation with tumor (light blue), chest (orange), adipose (light grey), gland (dark grey), vasculature (red), skin (dark blue), and air (black) labeled.
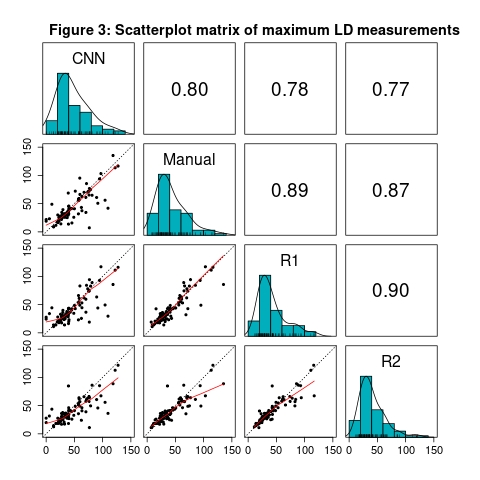
Figure 3: Along the diagonal, histograms of the maximum LD measurement from the primary tumor CNN segmentation, manually-edited segmentation, Reviewer 1, and Reviewer 2 are shown. Pairwise comparisons of each case are shown in the scatterplots, with the red lines representing the locally estimated scatterplot smoothing (LOESS) line and the dotted black lines representing perfect agreement. Above the diagonal Pearson correlation coefficients are provided.
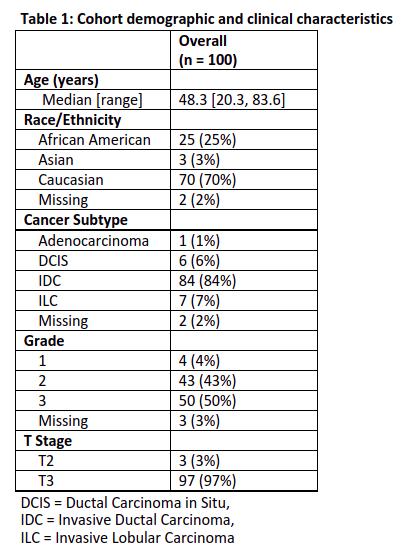
Table 1: Cohort demographics and clinical characteristics
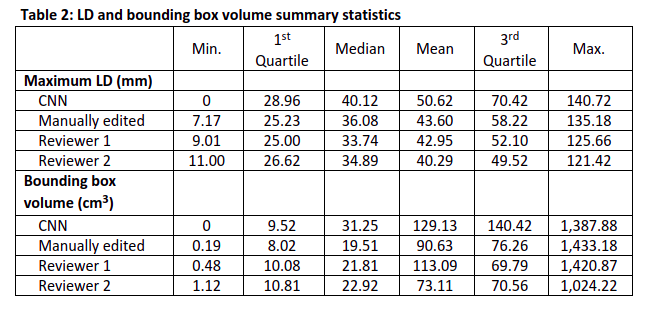
Table 2: LD and bounding box volume summary statistics
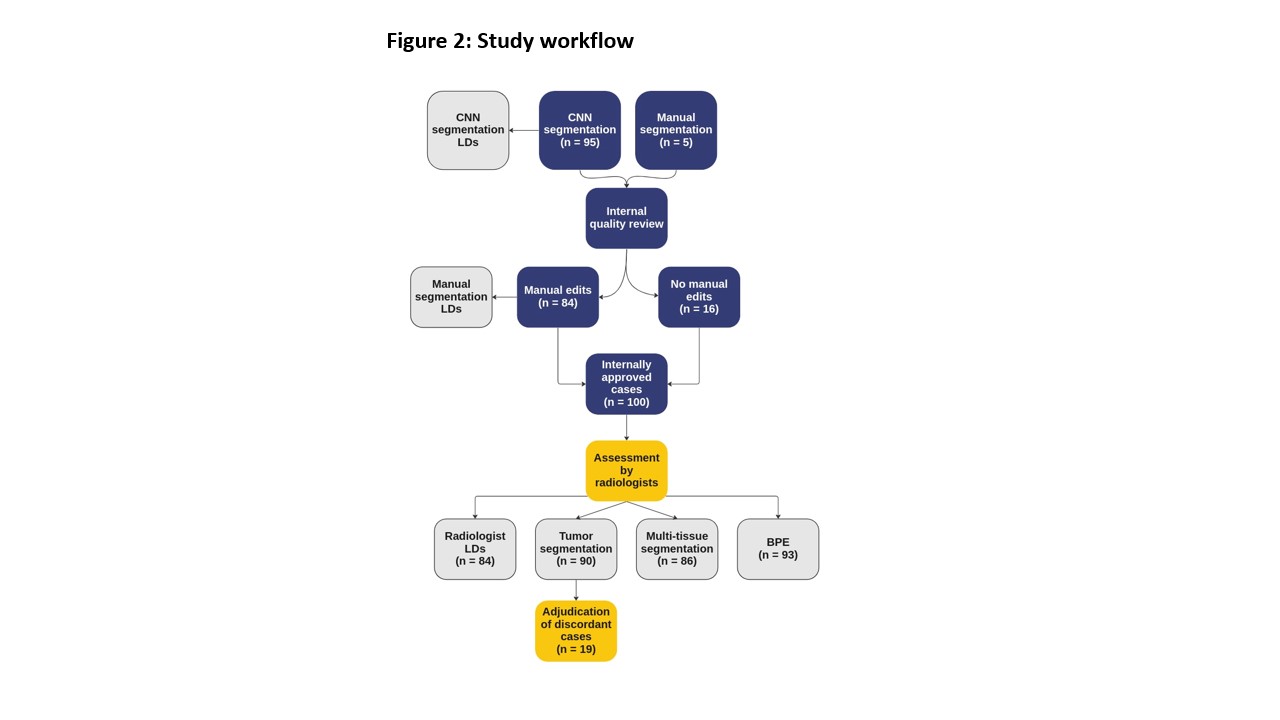
Figure 2: CNN-generated segmentations were created and went through an internal quality review process. Manual edits were made as necessary before the cases were reviewed by the two radiologists. Longest dimension (LD) measurements were made, tumor and multi-tissue segmentations were assessed, and background parenchymal enhancement (BPE) was categorized. A pre-planned adjudication of cases with discordant tumor segmentation assessments will be undertaken by the radiologists.
DOI: https://doi.org/10.58530/2023/5247