5246
Robust Resolution Improvement of UTE-MR Angiogram using 3D Super-Resolution Generative Adversarial Network
Abel Worku Tessema1,2 and HyungJoon Cho1
1Department of Biomedical Engineering, Ulsan National Institute of Science and Technology, Ulsan, Korea, Republic of, 2School of Biomedical Engineering, Jimma Institute of Technology, Jimma University, Jimma, Ethiopia
1Department of Biomedical Engineering, Ulsan National Institute of Science and Technology, Ulsan, Korea, Republic of, 2School of Biomedical Engineering, Jimma Institute of Technology, Jimma University, Jimma, Ethiopia
Synopsis
Keywords: Vessels, Blood vessels, MR Angiogram, Super-resolution neural network
UTE-MRA is used to visualize the vasculature of the body. But the visibility of smaller blood vessels is highly dependent on the resolution which requires a long scanning time. We applied a customized 3D-SRGAN network on UTE-MRA data to increase the resolution and have achieved a structural similarity, peak signal-to-noise ratio, and mean squared error of 0.932, 32.001, and 0.00064 respectively compared with the ground truth high-resolution data. The proposed method performed better than 3D-SRGAN and cubic spline interpolation and can be used reduce the scanning time significantly and provide better image quality.Introduction
3D magnetic resonance angiography (MRA) is used to visualize macroscopic vasculatures using blood flow as a source of contrast. MRA can be used to diagnose stroke, atherosclerosis, aneurysm, stenosis, and others. But in clinical diagnosis using MRA, resolution plays an important role in estimating the detail of anatomical structures of blood vessels which is achieved with the cost of long scanning time.Longer scanning time may induce motion artifact, not convenient for both patients as well as health providers, and most importantly, affect the timeliness of diagnosis and treatment of patients with stroke. Therefore, this study is aiming to improve the resolution of MRA data scanned in a shorter time using a super-resolution generative adversarial network.
Methods
Ultra-short echo time MRA (UTE-MRA) was acquired from adult Wistar rats (body weight 260 – 400g) after approval of animal care by the institutional animal care and use committee (IACUC) of Ulsan National Institute of Science and Technology (UNIST) and carried out according to the guideline. A total of 18 3D UTE-MRA data were collected using UTE pulse sequence with an image resolution of 128×128×128 (low-resolution data) and 256×256×256 (high-resolution data), voxel size of 234×234×234 μm3, and 117×117×117 μm3 respectively, TR= 22ms, TE = 0.012ms and FOV of 30×30×30 mm3 after intravenous bolus injection of SPION with a dose of 360 μmol/Kg 1. The low-resolution and high-resolution data take 16 and 66 minutes to acquire respectively.The raw MRA data were pre-processed to reduce the noise. 3D super-resolution generative adversarial network (3D-SRGAN) was customized, fine-tuned, and trained on 896 patches from 14 MRA data to up-sample low-resolution data to high-resolution. Due to the limited capacity of hardware, and the size of the data, the training was performed using a patch of size 32×32×32 without overlapping to generate the corresponding super-resolution patch of size 64×64×64. The remaining 4 MRA data (256 patches) were used to test and compare the performance of the 3D-SRGAN. Finally, the model's performance was compared with cubic spline interpolation and the method implemented by Sánchez, I. et al2.
Result
The structural similarity (SSIM), peak signal-to-noise ratio (PSNR), and mean squared error (MSE) of 0.932, 32.001, and 0.00064 respectively were achieved. The image quality is greatly improved compared to up-sampling using cubic spline interpolation which performed SSIM, PSNR, and MSE of 0.382, 19.503, and 0.01125, respectively.In addition, our custom 3DSRGAN provides better results compared to the SRGAN implemented by Sánchez, I. et al., which provides SSIM, PSNR, and MSE of 0.929, 31.096 and 0.00078, respectively 2. figure 1 and 2 shows the comparison of the original high-resolution image with the up-sampled image using cubic spline interpolation, and 3D SRGAN methods after applying maximum intensity projection along the three axes.
Discussion and Conclusion
The anatomical detail of blood vessels becomes visible in high-resolution UTE-MRA which is very challenging to acquire due to long scanning time and prone to motion artifact. In this study, the low-resolution and high-resolution data take 16 and 66 minutes respectively. The quality of data used directly affects the overall sensitivity of clinical diagnosis. Therefore, a method that improves the resolution of MRA data is crucial for improving the performance of diagnosis without the cost of longer scanning time.Creating super-resolution images from the corresponding low-resolution image using a super-resolution neural network is one of the currently active areas of research2,3,4. The result of our 3D-SRGAN was a lot better than cubic spline interpolation (SSIM 0.382) as well as using 3D-SRGAN (SSIM = 0.929) and generated a more realistic and very similar image (SSIM= 0.932) compared with the corresponding ground truth high-resolution image.
Acknowledgements
This work was supported by a grant from the National Research Foundation of Korea, from the Korean government (No. 2022R1A2C2011191).
References
- Kang, M., Jin, S., Lee, D. and Cho, H., 2020. MRI visualization of whole brain macro-and microvascular remodeling in a rat model of ischemic stroke: a pilot study. Scientific reports, 10(1), pp.1-12.
- Sánchez, I. and Vilaplana, V., 2018. Brain MRI super-resolution using 3D generative adversarial networks. arXiv preprint arXiv:1812.11440.
- Wang, J., Chen, Y., Wu, Y., Shi, J. and Gee, J., 2020. Enhanced generative adversarial network for 3D brain MRI super-resolution. In Proceedings of the IEEE/CVF Winter Conference on Applications of Computer Vision (pp. 3627-3636).
- Ledig, C., Theis, L., Huszár, F., Caballero, J., Cunningham, A., Acosta, A., Aitken, A., Tejani, A., Totz, J., Wang, Z. and Shi, W., 2017. Photo-realistic single image super-resolution using a generative adversarial network. In Proceedings of the IEEE conference on computer vision and pattern recognition (pp. 4681-4690).
Figures
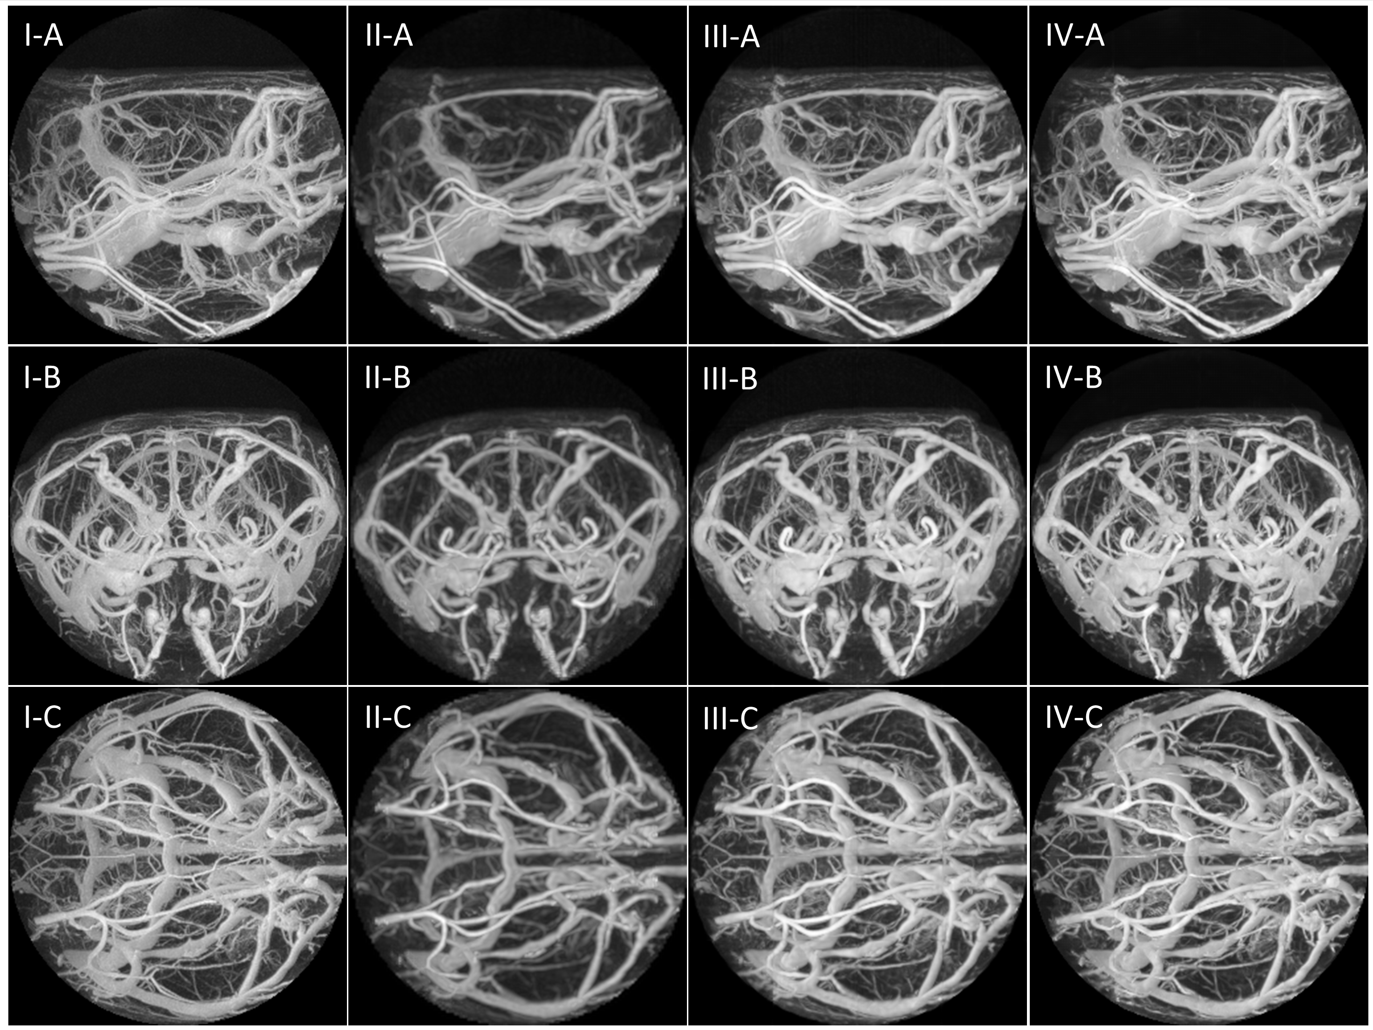
Super-resolution
of UTE-MRA data. I-IV shows the original image, cubic spline interpolation, 3DSRGAN2,
and our custom 3DSRGAN results, respectively. The letters A, B, and C show the
3D-MRA data after maximum intensity projection along the x-axis, z-axis, and y-axis,
respectively.
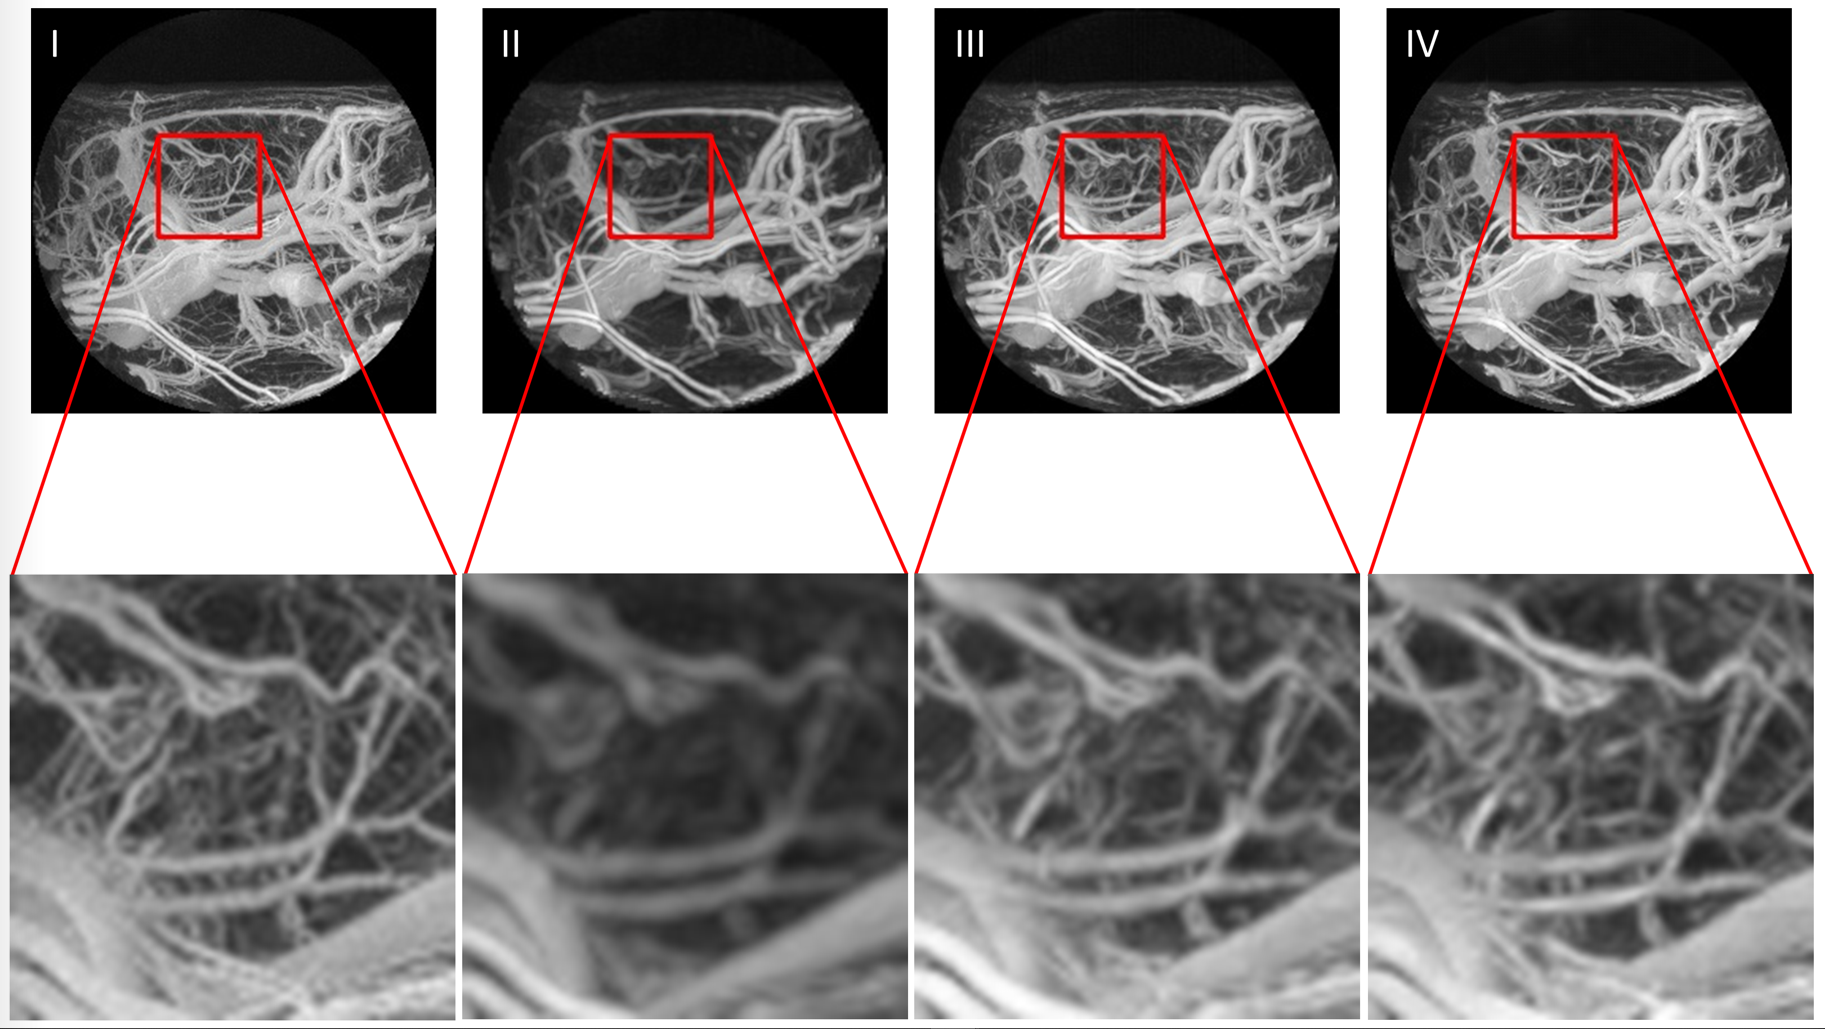
Comparison
of Super-resolution techniques. I-IV shows the original image, cubic spline
interpolation, 3DSRGAN2, and
our custom 3DSRGAN results, respectively.
DOI: https://doi.org/10.58530/2023/5246