5244
High-resolution and highly accelerated T2 mapping in kidney cancer treatment-response and subtype differentiation1Department of Radiology, University of Cambridge, Cambridge, United Kingdom, 2University of Nottingham, Nottingham, United Kingdom, 3Department of Histopathology, CUH NHS Foundation Trust, Cambridge, United Kingdom, 4Department of Oncology, University of Cambridge, Cambridge, United Kingdom, 5Department of Surgery, University of Cambridge, Cambridge, United Kingdom
Synopsis
Keywords: Kidney, Cancer, T2-mapping
Here we have applied newly developed T2 mapping methods based on Echo Merging and k-t Undersampling with Reduced flip Angles (TEMPURA) in the clinical setting of kidney cancer for the first time. The accelerated and high-resolution TEMPURA approach showed high promise in quantitatively and qualitatively evaluating the treatment response and differentiating between high vs. low grade clear-cell renal cell carcinoma, as well as different kidney tumor subtypes.
Introduction
Renal cell carcinoma (RCC) is the most lethal urological malignancy1, with 0-32% 5-year cancer-specific survival (CSS) in advanced stages2. Early detection and correct characterization significantly impact the clinical management and improve survival2. However, current diagnostic workup cannot accurately differentiate between grades, subtypes and predict treatment response3. Renal mass biopsy (RMB) is invasive, non-diagnostic in up to 20%4, and unrepresentative of tumor heterogeneity which can result in cancer undergrading or unnecessary surgery of benign lesions5,6. Imaging overcomes some RMB limitations, but current strategies do not examine the biology and treatment-response monitoring only probes changes in size7,8. Therefore, novel imaging methods which noninvasively characterize the microstructure/biology of whole tumors have potential to improve subtype differentiation, grading and treatment-response monitoring.T2 relaxation time in MRI relates to the degree of tissue extracellular water content9, and T2w-images are integral part of clinical MRI protocol for evaluation of kidney masses10. While T2w-images allow only qualitative image interpretation, T2 mapping achieves robust quantification of T211. T2 mapping has potential in distinguishing higher from lower grade clear-cell RCC (ccRCC)12, while harmonized T2 mapping is being developed for diffuse kidney diseases13. We have further improved the T2 mapping methods, which can both enhance the microstructure visualization and reduce the acquisition time from 3-5min to a breath-hold (18s). Here we report first application of novel T2 mapping methods to examine their potential in clinical kidney tumor management.
Methods
Eight patients with kidney tumors were recruited to the WIRE clinical trial14. They underwent baseline MRI using a 3 T scanner (GE Healthcare, WI) and a 32-channel cardiac array coil. Scanned sequences were: High-resolution T2mapping using Echo Merging Plus k-t Undersampling with Reduced flip Angles (High-res TEMPURA) and breath-hold (BH) TEMPURA; acquisition parameters are shown in Table 1. After the baseline scan, all patients underwent RMB to determine the histology. In cases of ccRCC, the patient proceeded to the next stage of the trial; undergoing neoadjuvant treatment. A follow-up scan was undertaken within five days before surgery with the same MRI sequences. Images were processed using the StimFit toolbox15. Tumor ROIs were drawn on T2 maps and compared to ipsilateral normal kidneys. Statistical analysis was performed using Student’s t-test for comparison between pre- and post-treatment and between grades. ANOVA was applied in comparison across subtypes. Results were presented as mean ± SD or median (range); P <0.05 was used as the cut-off for significance.Results
Summary of patients’ characteristics is shown in Table 2. Five patients had ccRCC, of which four proceeded with neoadjuvant medication and one was excluded from the trial due to newly identified colon mass. Two patients had renal oncocytoma (RO) and one had a low oncocytic tumor (LOT), which was reported as eosinophilic/oncocytic RCC (e/oRCC) on final postsurgical histology. Out of four ccRCC patients on neoadjuvant treatment, two received cediranib + olaparib drug combination, and two the olaparib only. Mean treatment time was 19 (range 15-28) days. All patients, apart from the two with RO, underwent nephrectomy which revealed a higher grade in all, but one patient compared to the RMB (80%).Representative T2 maps are shown in Figure 1. Synthetic T2w images extracted from High-res TEMPURA show greater microstructural detail of tumors compared to the standard T2w acquisition. The e/oRCC presented a clear demarcation of two distinct tumor portions, which could be the reason for histological report changing from LOT to postsurgical e/oRCC. The majority of ccRCCs were reported as higher grade tumours on surgery compared to the RMB report, which further supports potential of using imaging in conjunction with RMB to mitigate against undergrading.
Quantitative results are reported in Table 3, with graphical representations in Figure 2. A trend of decreased T2 values was observed in post-treatment ccRCC and in higher vs. lower grades on both TEMPURA sequences, with the BH TEMPURA showing statistical significance (P<0.05). Comparison across kidney tumor subtypes revealed the lowest T2 values in normal kidney, and a trend towards higher T2 in the most aggressive subtype, ccRCC. Comparison of normal vs. ccRCC (pre-treatment) was significant on ANOVA test, with P = 0.017 and P = 0.004, on High-res and BH TEMPURA, respectively.
Discussion
Here we tested novel T2 mapping methods for clinical imaging of kidney tumors for the first time. The high-resolution method improved the depiction of microstructural changes in kidney tumors, which could offer new insights into tumor biology compared to conventional T2w methods. BH TEMPURA significantly shortened the acquisition time and so enables potential integration within the clinical pathway. Additionally, imaging characterized whole-tumor heterogeneity unlike biopsy - as demonstrated by RCC cases, undegraded on RMB compared to surgical pathology.Both TEMPURA sequences provided comparable quantitative readouts. T2 decreased in post-treatment ccRCC, which may reflect normalized extracellular water content due to decreased vascular permeability as reported previously in glioblastoma under bevacizumab16. Lower T2 was measured in higher ccRCC grades, which is in agreement with a previous report12. The lowest T2 values were observed in normal kidney parenchyma, along with a trend of gradually increasing T2 across subtype aggressiveness.
Future studies will recruit additional patients to provide statistical comparisons and incorporate further methods to comprehensively characterize microstructure/biology of intra- and intertumoral heterogeneity of kidney tumors.
Acknowledgements
No acknowledgement found.References
1. Kratzer, T. B. et al. Progress Against Cancer Mortality 50 Years After Passage of the National Cancer Act. JAMA Oncol. 8, 156 (2022).
2. Escudier, B. et al. Renal cell carcinoma: ESMO Clinical Practice Guidelines for diagnosis, treatment and follow-up. Ann. Oncol. 30, 706–720 (2019).
3. Gordetsky, J. & Zarzour, J. Correlating Preoperative Imaging with Histologic Subtypes of Renal Cell Carcinoma and Common Mimickers. Curr. Urol. Rep. 17, 52 (2016).
4. Patel, H. D. et al. Diagnostic Accuracy and Risks of Biopsy in the Diagnosis of a Renal Mass Suspicious for Localized Renal Cell Carcinoma: Systematic Review of the Literature. J. Urol. 195, 1340–1347 (2016).
5. Harris, C. R., Whitson, J. M. & Meng, M. V. Under-grading of <4 cm renal masses on renal biopsy. BJU Int. 110, 794–797 (2012).
6. Patel, H. D. et al. Surgical histopathology for suspected oncocytoma on renal mass biopsy: a systematic review and meta-analysis. BJU Int. 119, 661–666 (2017).
7. Aykan, N. F. & Özatlı, T. Objective response rate assessment in oncology: Current situation and future expectations. World J. Clin. Oncol. 11, 53–73 (2020).
8. Persigehl, T., Lennartz, S. & Schwartz, L. H. iRECIST: how to do it. Cancer Imaging 20, 2 (2020).
9. O’Brien, A. T., Gil, K. E., Varghese, J., Simonetti, O. P. & Zareba, K. M. T2 mapping in myocardial disease: a comprehensive review. J. Cardiovasc. Magn. Reson. 24, 33 (2022).
10. Recommendations for cross-sectional imaging in cancer management, Second edition: Renal and adrenal tumours. (2014).
11. Magnetism. Questions and Answers in MRI http://mriquestions.com/bold-contrast.html.
12. Adams, L. C. Use of quantitative T2 mapping for the assessment of renal cell carcinomas: first results. 11 (2019).
13. Li, H. et al. Improved Harmonization of Renal T2 Mapping Between Vendors using Stimulated Echo Compensation. in Proceedings of Joint Annual Meeting ISMRM-ESMRMB & ISMRT 31st Annual Meeting 4409 (2022).
14. Theme, C.-C. WIndow of Opportunity Clinical Trials Platform for Evaluation of Novel Treatments Strategies in REnal Cell Cancer. https://clinicaltrials.gov/ct2/show/NCT03741426 (2021).
15. Lebel, M. StimFit: A toolbox for robust T2 mapping with stimulated echo compensation. in Proc. Intl. Soc. Mag. Reson. Med. 20 2558 (2012).
16. Hattingen, E. et al. Quantitative T2 mapping of recurrent glioblastoma under bevacizumab improves monitoring for non-enhancing tumor progression and predicts overall survival. Neuro-Oncol. 15, 1395–1404 (2013).
Figures
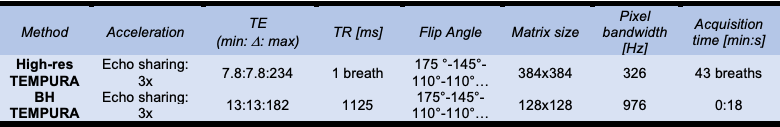
Table 1: TEMPURA acquisition parameters. Other parameters in common: FOV=384mm, 5 slices with thickness/gap of 4.5/1.0mm.
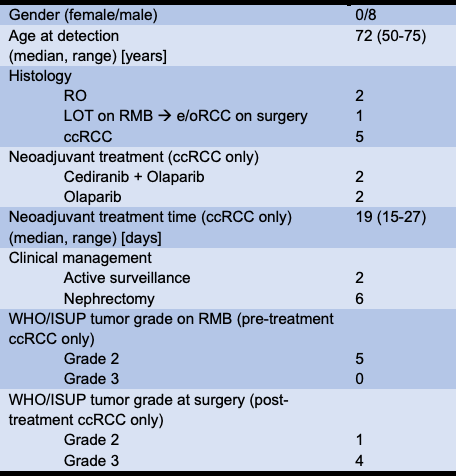
Table 2: Summary patients' characteristics.
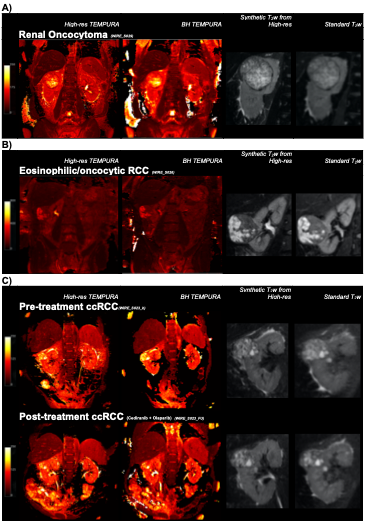
Figure 1: Representative T2 maps of patients with kidney tumors.
A) High-res TEMPURA, BH TEMPURA, synthetic T2w from High-res TEMPURA and standard T2w of the renal oncocytoma.
B) High-res TEMPURA, BH TEMPURA, synthetic T2w from High-res TEMPURA and standard T2w of the eosinophilic/oncocytic RCC.
C) High-res TEMPURA, BH TEMPURA, synthetic T2w from High-res TEMPURA and standard T2w of pre- and post-treatment ccRCC.
Figure 2: Scatter plots comparing High-res and BH TEMPURA derived T2 values (in ms). A) pre- and post-treatment ccRCC, B) surgical WHO/ISUP ccRCC grades 2 vs 3, and C) across kidney tumor subtypes. * and ** denote statistical significance P < 0.05 and P < 0.01, respectively.
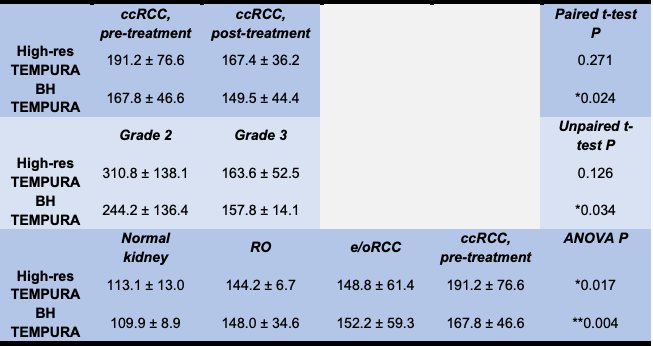
Table 3: Comparison of T2 values (in ms) using High-res and BH TEMPURA sequences between A) pre- and post-treatment ccRCC, B) surgical WHO/ISUP ccRCC grades 2 vs 3, and C) across kidney tumor subtypes. Data presented as mean ± SD.